Kinematics of Protostellar Objects in the Ophiuchus A Region
Abstract
We present the detection of infall, rotation and outflow kinematic signatures towards both a protostellar source, VLA 1623 and what was initially thought to be a pre-protostellar core, SM1N, in the Ophiuchus A region. The kinematic signatures of early star formation were detected in the dense molecular gas surrounding the embedded sources using high signal-to-noise millimeter and submillimeter data. Centroid velocity maps made with HCO+ J=43 and J=10 line emission exhibit the blue bulge signature of infall, which is predicted to be seen when infall motion dominates over rotational motion. Further evidence for infalling gas is found in the HCO+ blue asymmetric line profiles and red asymmetric opacity profiles. We also performed CO J=32 and J=10 observations to determine the direction, orientation, and extent of molecular outflows, and report the discovery of a new bipolar outflow possibly driven by SM1N.
Subject headings:
stars: circumstellar matter-ISM: clouds-stars: formation1. Introduction
Observationally, the earliest stage of evolution for low-mass protostars is the so-called “Class 0” phase, which is characterized by a blackbody-like spectral energy distribution (SED) that peaks in the submillimeter (André et al. (1993), hereafter AWB93). Barsony (1994) defines the following as characteristics of Class 0 objects: , an SED like a 30 K blackbody, undetected at m, and possession of a molecular outflow. These characteristics of Class 0 objects imply that they are in a very active mass accretion phase, and possess more circumstellar mass than stellar mass. An even earlier phase of evolution prior to class 0 objects has also been proposed, the so-called “pre-protostellar” stage (Ward-Thompson et al., 1994). Observationally, objects in this stage of evolution have SEDs that are similar to Class 0 objects, but they lack other kinematic signatures of star formation such as molecular outflows and centimeter continuum emission. The pre-protostellar cores are probably gravitationally bound, but lack a central hydrostatic stellar source, and are hence not yet “protostars”. Indeed molecular line spectroscopy of a number of pre-protostellar cores (e.g. Tafalla et al. (1998)) show that they are undergoing infall, but more slowly than that seen towards Class 0 protostars.
To study the detailed kinematical evolution of pre-protostellar objects to Class 0 objects and beyond, it is important to study both type of objects with observational tools like millimeter and submillimeter spectroscopy. Pre-protostellar cores do not possess a strong outflow, and hence it is expected to be less complex to disentangle the various motions that accompany star formation such as infall, rotation, outflow and turbulence. Since the details of the star formation process can vary from cloud to cloud, and may depend on environmental factors, it is crucial to choose pre-protostellar and protostellar candidates within the same region. The centrally condensed L1688 core of the nearby (160 pc) Ophiuchus (hereafter Oph) molecular cloud consists of a rich array of young stellar objects at various stages of evolution (Wilking & Lada, 1983). In particular, the cloud A region (called Oph A) harbors a number of pre-protostellar and protostellar cores. In this region, there is VLA 1623, which was designated as the prototype of the Class 0 phase of evolution (AWB93). VLA 1623 is known to possess a remarkably collimated and very young ( yrs) molecular outflow (André et al. (1990), AWB93). The millimeter and submillimeter continuum maps of AWB93 reveal that Oph A breaks up into 4 cores, SM1, VLA 1623, SM1N, and SM2. Of these, VLA 1623 was the only source with an identified outflow. Both SM1N and SM1 are probably real pre-protostellar cores (AWB93). Wide-field 1.3 mm continuum mapping by (Motte et al., 1998) (hereafter MAN98) reveals that Oph A is the brightest of all Oph cores, and in addition to VLA 1623 there are eight other starless cores in Oph A. The objects A-MM6, A-MM7, and A-MM8, together with SM1N, SM1 and SM2, compose an arc within Oph A, which seems to be delineating a photo-disassociation front of a PDR region illuminated by the nearby B star S1 (see MAN98). Recent high angular resolution N2H+ observations (Di Francesco et al., 2004) of the quiescent dense gas in this region show emission peaks of this tracer at SM1 and SM1N, but not at VLA 1623. N2H+ can deplete significantly at densities greater than cm-3 (Bergin et al., 2002), so the difference in N2H+ emission from SM1N to VLA 1623 might be another indicator that SM1N is less evolved than VLA 1623.
In this paper, we present results of a study of the Oph A region designed to make a comparison of pre-protostellar core(s) with a more evolved Class 0 protostellar object (VLA 1623). One of the main goals of this study was to understand better the earliest stages of star formation from the pre-protostellar phase to the Class 0 phase. However, as will be seen from the results of this study, SM1N seems to power an outflow, and is hence probably not pre-protostellar. To probe the kinematics and physical conditions of the cores, we performed a multi-transitional study using both density sensitive molecular tracers, and CO and its isotopes. HCO+ and N2H+ preferentially trace high density gas, while CO traces a much wider range of gas densities, in addition to being a good tracer of outflows. Submillimeter transitions of HCO+ and CO probe regions of higher density and excitation than the millimeter transitions. For this reason, we augment our millimeter observations with submillimeter observations of corresponding transitions. In §2, we describe our observations, and in §3 we present our results.
2. Observations
2.1. FCRAO
Millimeter observations of HCO+, H13CO+and N2H+ towards VLA 1623 and SM1N were performed with the Five College Radio Astronomy Observatory (FCRAO) 14m telescope in December 1998, February 1999, and June 2001 using the SEQUOIA 16-beam array receiver (Erickson et al., 1999), and the FAAS backend of 16 autocorrelation spectrometers. Mapping of the 12CO and 13CO J=10 transitions were also performed in February 2004 using the newly-developed on-the-fly (OTF) mapping technique at FCRAO using the upgraded SEQUOIA array receiver which had dual-polarization capability, and a dual channel correlator (DCC) backend that allowed the observation of both the 12CO and 13CO isotopes simultaneously with a spectral resolution of 50 kHz. The 2004 observations covered a area of the Oph A cloud. Table 1 summarizes the frequencies and effective resolutions of each transition. HCO+ and N2H+ line transitions were observed via frequency-switching with subsequent folding and third-order baseline removal. HCO+ and its isotopic observations span a region centered on VLA 1623 (. Pre-OTF data were reduced and analyzed with the Gildas CLASS software package. The OTF data was reduced using the FCRAO OTFTOOL software package (Heyer et al., 2004). Pointing and focus were verified with observations of SiO masers.
2.2. CSO
We obtained sub-millimeter observations using the 10.4 m telescope of the Caltech Submillimeter Observatory (CSO) at Mauna Kea, Hawaii. The May 1996 HCO+ and CO observations were performed using On-The-Fly (OTF) mapping. These observations were made with the 345 GHz SIS waveguide receiver (Ellison et al., 1989) and a 1000 channel, 50 MHz wide acousto-optical spectrometer. HCO+ observations span a region 70″ 70″ centered on both VLA 1623 and SM1N. Our CO observations mapped a region of 150″ 150″ centered on VLA 1623 and SM1N. Individual OTF maps made on VLA 1623 and SM1N were combined together to derive the results presented below. Data were reduced and analyzed using the CLASS software package.
| Molecule | Transition | Observatory | Frequency (GHz) | Beam Width (“) |
|---|---|---|---|---|
| H13CO+ | J = 10 | FCRAO | 86.754288 | 62 |
| HCO+ | J = 10 | FCRAO | 89.188496 | 60 |
| N2H+ | 123012 | FCRAO | 93.173770 | 58 |
| 13CO | J = 10 | FCRAO | 110.201354 | 49 |
| CO | J = 10 | FCRAO | 115.271202 | 47 |
| 13CO | J = 32 | CSO | 330.587980 | 23 |
| C17O | J = 32 | CSO | 337.061123 | 22 |
| CO | J = 32 | CSO | 345.795990 | 22 |
| H13CO+ | J = 43 | CSO | 346.998338 | 21 |
| HCO+ | J = 43 | CSO | 356.734134 | 21 |
3. Results
3.1. Molecular Line Profiles
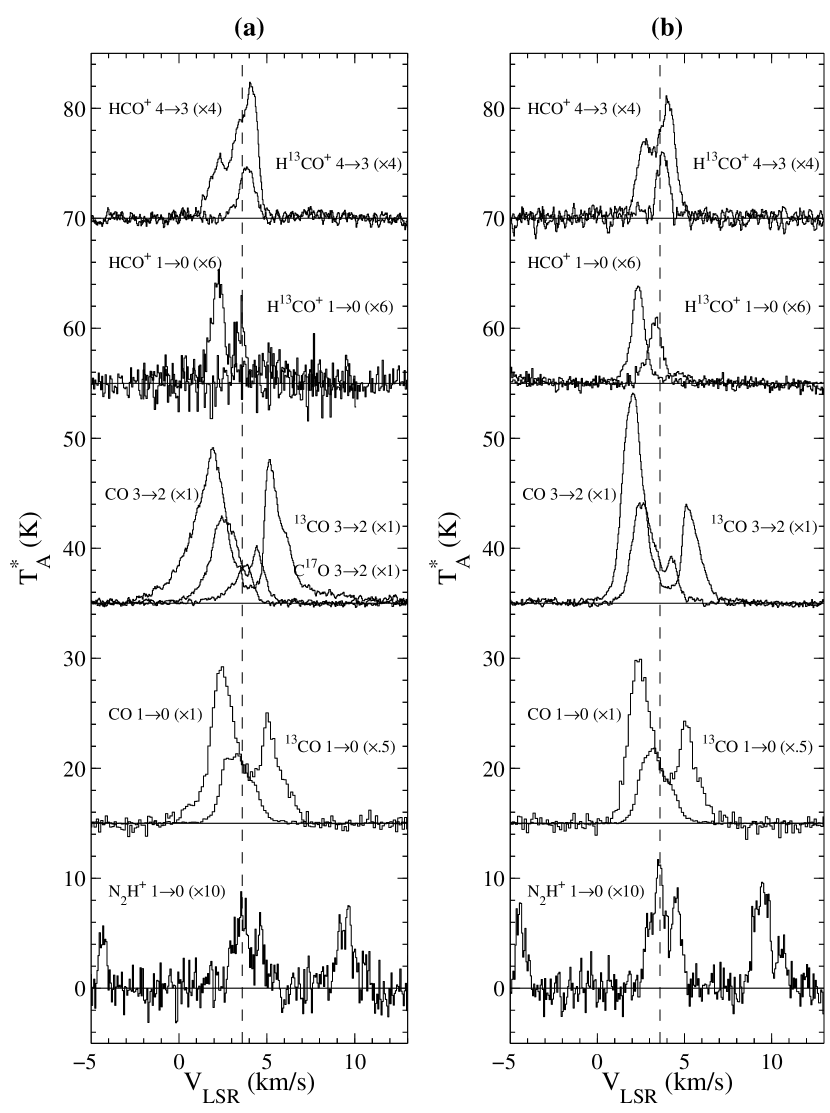
Figure 1 shows a summary of the spectral observations towards the central positions of two sources, VLA 1623 and SM1N. The left panel shows the observations towards VLA 1623 and the right panel shows the observations towards the source SM1N. Table 2 lists the derived centroid velocities for various molecular transitions towards the central position of VLA 1623 and SM1N. In order to exclude any effects of outflows, the centroid velocities in Table 2 were computed within a velocity interval of to km s-1.
| Source | Transition | (km s-1) |
|---|---|---|
| (km s-1) | ||
| VLA 1623 | CO J=10 | |
| (3.6aa derived from hyperfine structure ) | 13CO J=10 | |
| CO J=32 | ||
| 13CO J=32 | ||
| C17O J=32 | ||
| HCO+ J=10 | ||
| H13CO+ J=10 | ||
| HCO+ J=43 | ||
| H13CO+ J=43 | ||
| SM1N | CO J=10 | |
| (3.6aa derived from hyperfine structure ) | 13CO J=10 | |
| CO J=32 | ||
| 13CO J=32 | ||
| HCO+ J=10 | ||
| H13CO+ J=10 | ||
| HCO+ J=43 | ||
| H13CO+ J=43 |
Since N2H+ is typically optically thin, and is a good tracer of dense, quiescent gas (Benson et al. (1998) and references therein), we used the J=10 observations of N2H+ to determine the true systemic velocity towards these sources. Hyperfine fitting of the N2H+ lines (c.f. Caselli et al., 1995) yields a vLSR of and km s-1 towards VLA 1623 and SM1N respectively.
The central spectra of HCO+ and CO towards VLA 1623 and SM1N show strong self-reversed dips. These dips imply true self-absorption as the optically thin tracers (N2H+, C17O, H13CO+) peak at the velocity of the self-reversal. One interesting feature of the submillimeter CSO HCO+ J=43 spectra is the lack of the “classic” blue asymmetry expected in infalling regions. It is this “classic” blue asymmetric line profile signature that has been the technique of choice for most studies of infall (see for example, Gregersen et al. (1997), hereafter GEZC97). Indeed, the lack of blue asymmetry in their HCO+ observations led GEZC97 to conclude that VLA 1623 was an ambiguous case for the interpretation of infall. In fact, it can be seen from Figure 1 that the central HCO+ J=43 line profiles in both sources exhibit a red asymmetry, a profile consistent with expanding rather than infalling gas. Indeed, a very strong and collimated outflow has been discovered towards VLA 1623 (André et al., 1990). It is likely that the expected blue-asymmetric line profile signature of infall has been inverted in the presence of this strong outflow. The isotopic H13CO+ J=43 has a centroid velocity (see Table 2) which is red-shifted with respect to the main line (as might be expected for infall), but at the same time is slightly more red-shifted with respect to the km s-1 velocity derived from the N2H+ transition. In the presence of pure infall, the optically thin H13CO+ line would be expected to be centered on the systemic velocity of the cloud core. As will be shown in §3.2.2, HCO+ and its isotopes do trace the outflows, so this may cause the velocity centroid of these lines to move systematically redward, compared to the pure infall scenario.
In comparison with their corresponding HCO+ J=43 transitions, the HCO+ J=10 spectra are heavily blue shifted. Their self-absorption dips almost reach the continuum baseline, and the red-shifted peak is barely visible within the signal-to-noise ratio of our observations. Why are the HCO+ J=10 observations so different in appearance from the HCO+ J=43 observations? The two transitions are likely probing differing regions of gas. The gas observed by the larger beam of the FCRAO 14 m in HCO+ J=10 comes from extended regions around the two sources. The extended envelope traced by the lower transition may be indicative of the overall large scale motion of the gas due to collapse. The CSO HCO+ J=43 transition probes a smaller region of gas as well as probing farther into the envelope. Thus, the shorter wavelength submillimeter transition may be picking out the densest gas regions near the protostellar cores. Probing nearer the source allows detection of the inner region of infall but also the developing outflow, which might cause the red asymmetry seen in the submillimeter transitions.
The dipole moment of CO is much smaller than HCO+ and is thus expected to trace a wider range of densities. CO is often seen tracing swept-up and outflowing material, whereas the HCO+ isotopes probe more of the denser, centrally condensed gas. Indeed the broad wings of emission seen for the CO J=32 spectra in Figure 1 imply that CO is tracing outflows in both sources. Curiously, the central line profiles of CO also show the “classic” blue asymmetry already discussed. The CO spectra show deep self absorption in the line core and very broad wings of emission that extend beyond km s-1 from the systemic velocity. The self-absorption dip and blue asymmetry profile of the 13CO J=32 support the notion that this isotope is optically thick as well. The rarer isotope C17O has a gaussian line profile which peaks at the vLSR of VLA 1623, as expected for an optically thin line.
In the presence of infall, the line emission from the rarer isotope is expected to be red-shifted with respect to that from the main isotope (Narayanan et al., 1998, 2002). In the cases of VLA 1623 and SM1N, all of the centroid velocities of the rarer isotopic spectra are red-shifted with respect to their main lines (see Table 2). If infall were the only source of motion, both the emergent line intensity and optical depth profile must be asymmetric, with the line profile showing blue asymmetry, and the optical depth profile showing red asymmetry (Narayanan et al., 1998). In the presence of pure expansion (outflow), the converse would be true: the line profile would be red asymmetric, and the optical depth profile would be blue asymmetric.
We performed an optical depth analysis using the CSO HCO+ and H13CO+ J=43 observations. In Figure 2, we present the optical depth profiles for VLA 1623 and SM1N. The optical depth calculations were performed only over the FWHM of the isotopic lines. The opacities were estimated from the observed line profile ratios of HCO+/H13CO+. The opacity, of the more abundant isotope was estimated using I(Main)I(Iso), where is the ratio of main to isotopic abundances, and I(Main) and I(Iso) are the line intensities of the main and isotopic lines respectively. An isotopic abundance ratio of [HCO+]:[H13CO+] 45:1 was used. This technique assumes that the excitation temperature is the same for the main and isotopic species.
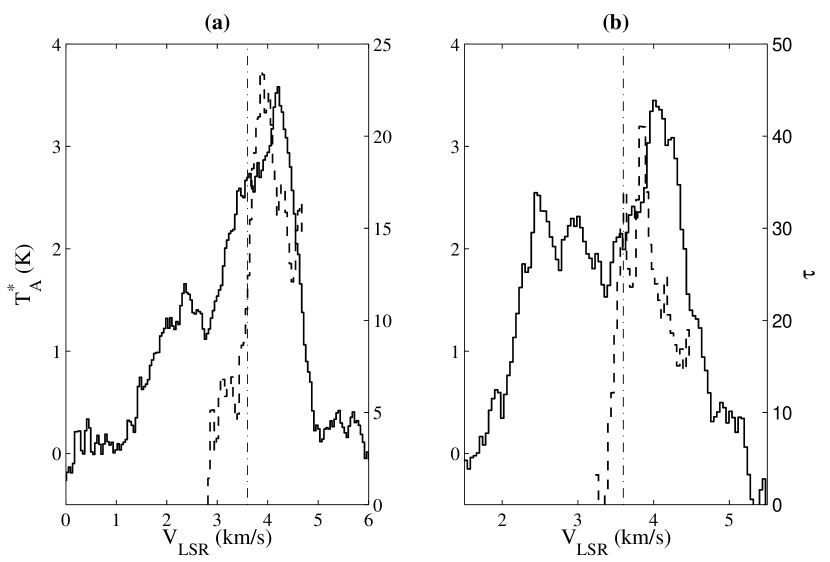
From Figure 2, we see that not only are the main line profiles red asymmetric towards both VLA 1623 and SM1N, but the optical depth profiles also exhibit a red asymmetry. The red-shifted line profiles are consistent with expansion or outflow but the red-shifted opacity profiles are consistent with tracing infall. The main isotope HCO+ J=43 must be tracing a significant part of the outflow for its line profile to show an expansion signature. However, the opacity profile which is principally determined by the more optically thin isotope seems to be more consistent with tracing infall. The optically thin isotope is likely tracing material further towards the center of the cloud cores, whereas the main line is likely being contaminated by the expanding (dense) shells of the outflow. This indicates the importance of using both isotopes in the interpretation, and that the submillimeter transitions of HCO+ and its isotope are tracing both outflowing material and the material that is participating in gravitational collapse near the cores towards both VLA 1623 and SM1N.
3.2. Molecular Line Maps
3.2.1 Outflows
Outflows play an important role in the early phases of stellar evolution. In fact, bipolar outflows in Class 0 sources, like VLA 1623, indicate that outflows arise in star formation at a very early stage. The collimated outflow observed toward VLA 1623 has been studied extensively since its discovery by André et al. (1990).
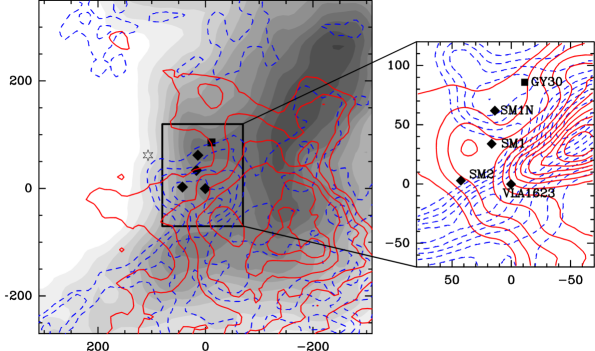
Figure 3 presents the newly obtained millimeter and submillimeter CO maps towards the Oph A region. The left panel shows the FCRAO CO maps in the J=10 transition. Curiously, the grey-scale 13CO image shows a ridge of emission that peaks about 3′ west of the submillimeter continuum sources, SM1, SM1N, VLA 1623 and SM2. The 13CO map also shows a well-defined edge of emission to the east close to the location of the nearby B star S1. It has been suggested that the SM1N, SM1 and SM2 cores form an arc of filamentary structures centered on the B star S1, possibly indicating a link between these submillimeter clumps and star S1 (MAN98, Di Francesco et al. (2004)). The left panel of Figure 3 also shows the red-shifted and blue-shifted line wing emission in 12CO J=10 emission. Centered on VLA 1623, we can see the outflow, especially the more collimated blue-shifted lobe of the outflow. The red-shifted line wing emission appears more diffuse throughout the region without a clear signature representing bipolarity of the outflow. A second blue-shifted component is seen east and north of VLA 1623.
The submillimeter CSO CO J=32 data have higher angular resolution and in this higher transition, excitation conditions are more favorable for picking up the strong line wing emission from outflows. The right panel of Figure 3 shows the integrated intensity maps from the CO J=32 line wing emission over a smaller region in Oph A. Indeed, in this transition the highly collimated outflow of VLA 1623 is readily seen extending across the map from the northwest to the southeast. The superposition of the red and blue-shifted emission indicates the VLA 1623 flow is located almost in the plane of the sky. Also, the differing angles (°) of the northwest red and blue outflow lobes is consistent with the CO J=21 observations from André et al. (1990) and André et al. (1993). The north-west blue-shifted high velocity lobe attributed to VLA 1623 may be a combination of an outflow from VLA 1623 more in line with the VLA 1623 red-shifted outflow lobe and a separate blue-shifted outflow originating from some source north and east of VLA 1623. North of the VLA 1623 flow, we see two well-separated red-shifted and blue-shifted lobes. The midpoint of the line joining the peaks of red-shifted and blue-shifted emission of this flow north of VLA 1623 falls very close to SM1N. We suggest that we have detected a new bipolar outflow centered on the source SM1N.
A second outflow was reported to have been discovered north of the VLA 1623 flow at approximately the position reported here, based on smaller angular extent millimeter interferometric measurements (Kamazaki et al., 2001, hereafter KSHK), and JCMT CO J=32 observations (Kamazaki et al., 2003, hereafter KSHUK). However, both of these studies covered a region only 1′ centered on SM1N in right ascension. Our maps cover 2.5′ around SM1N in RA. As a result of the smaller scale of their observations, KSHK and KSHUK claim the detection of a new northern flow (which they dubbed “AN outflow”) with a driving source that is a near-infrared star called GY30 (which is ″ from SM1N). They also conclude that the AN outflow has a blue-shifted lobe in the east, and a red-shifted lobe in the west, which is the same as the orientation of the VLA 1623 flow. A comparison of Figure 2 of KSHUK with Figure 3 of this paper indicates that their blue-shifted lobe coincides with the northern blue-shifted lobe seen in our work. But KSHUK do not observe the region where the eastern red-shifted lobe is seen. As a result, they have misidentified the source and orientation of the AN outflow. It appears from our present work that a new bipolar outflow is present north of VLA 1623, with a driving source, which is most likely SM1N, and whose orientation of blue and red-shifted lobes in the sky is opposite to that of VLA 1623.
We have estimated the physical parameters of the newly discovered outflow towards SM1N using the CSO CO J=32 data (see Table 3). The outflow from VLA 1623 is not fully mapped here, so we do not attempt to repeat the estimates of physical parameters of the VLA 1623 outflow (see for e.g. André et al., 1990, 1993). In order to estimate the masses of the outflowing gas, local thermodynamic equilibrium (LTE) conditions are assumed with an excitation temperature of T K (André et al., 1990). The total 12CO gas column density towards each lobe of the SM1N outflow is estimated by using the integrated brightness temperature under the line for velocities of to km s-1 and to km s-1 respectively for the blue and red-shifted lobes, and assuming that the 12CO emission is optically thin. A fractional abundance of (12CO) = and a distance of 160 pc to Oph are used.
We then estimated dynamical timescale, momentum, kinetic energy, and mechanical luminosity of the flow. The dynamical timescale, was estimated from outflow length and velocity that was assumed to be constant. The differences between the systemic velocity and the central velocities of blueshifted (redshifted) maps were used as the outflow velocities of blueshifted (redshifted) components. The calculated values of the momentum , kinetic energy , and mechanical luminosity are summarized in Table 3. These quantities are not corrected for a possible inclination angle of the outflow.
| Parameter | Blue | Red |
|---|---|---|
| Velocity (km s-1) | 6 | 5.5 |
| Length ( AU) | 1.2 | 1.1 |
| Mass ( M⊙) | 5.5 | 3.5 |
| Dynamical Timescale ( yrs) | 9.2 | 10 |
| Momentum ( M⊙km s-1) | 3.3 | 1.9 |
| Kinetic Energy ( ergs) | 2.0 | 1.0 |
| Mechanical Luminosity ( L⊙) | 1.7 | 0.8 |
This new discovery of the SM1N outflow may indicate either this protostar is more evolved than previously believed or the onset of outflows occur almost simultaneously with the first indication of infall.
3.2.2 Impact of Outflows
With detected outflows in both sources, we can determine the extent to which the HCO+ line profiles are affected by the molecular outflows mapped in CO. To do this, we made integrated intensity maps of the blue-shifted, line-core, and red-shifted emission of HCO+ J=43. Figure 4 shows the HCO+ J=43 integrated emission around VLA 1623 and SM1N, where the line core integrated intensity is shown in grayscale, blue-shifted emission in dashed contours, and the red-shifted emission is shown in solid contours. The line-core emission is expected to trace the denser, infalling material, while the line-wing maps may show contamination due to material swept-up by the outflows.
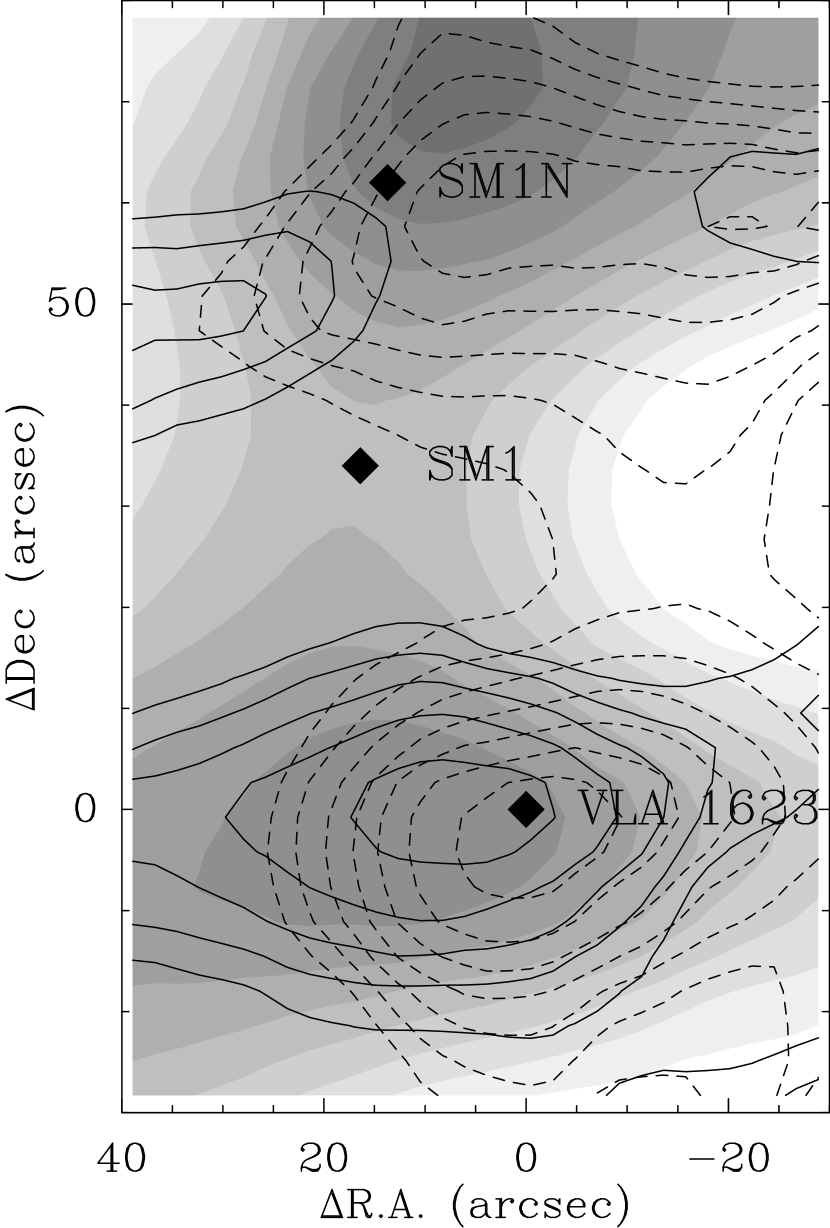
Figure 4 shows a complex morphology of both the line-core and line-wing emissions. The line-core emission displays two orthogonal components, one elongated along the direction of the outflows and one perpendicular. This effect is readily seen in the VLA 1623 region and to a lesser extent in the region around SM1N. The overall structure of the line-core emission is consistent with the continuum map of the cloud core region in André et al. (1993), Figure 1.
The line-wing emission around SM1N is collimated and consistent with the high velocity CO map in Figure 3. The line-wing emission of HCO+ confirms the detection of the outflow seen in CO J=32 emission. There are clear indications that the line-wing emission is elongated along the outflow direction.
The HCO+ line-wing integrated intensity about VLA 1623 is more complex. There is a definite elongation of red and blue-shifted emission along the well known outflow driven by VLA 1623. Although there is a slight deviation at the edges of the map, the line-core, blue-shifted, and red-shifted emission are spatially coincident along the outflow. In addition to the outflow elongation, the red-shifted and blue-shifted emission has a small component perpendicular to the outflow. The red-shifted emission is predominately toward the north-north-east and the blue-shifted emission is stronger in the south-south-west direction. This emission perpendicular to the outflow direction may be tracing the overall rotation of the molecular cloud about VLA 1623.
3.2.3 Centroid Velocity Maps
Given a velocity range, the centroid velocity is defined as that velocity at which the integrated intensity is equal on both sides. It has been shown that in the presence of complicated velocity fields, centroid velocity maps provide a better indication of the underlying velocity fields than integrated intensity maps (Adelson & Leung, 1988; Walker et al., 1994; Narayanan & Walker, 1998; Narayanan et al., 2002). In the model isovelocity maps of Narayanan & Walker (1998) which considered a rotating infalling protostellar core, the rotational velocity field imposes a gradient of blue-shifted to red-shifted velocities, with the sense of the gradient being orthogonal to the rotational axis. When infall dominates in the central regions, the line profiles in the central region become blue asymmetric, and hence there is a preponderance of blue-shifted velocities in the central regions of the isovelocity maps, giving rise to the so-called “blue-bulge” signature. Here, we make centroid velocity maps from our data to see if such an infall signature can be detected towards VLA 1623 and SM1N.
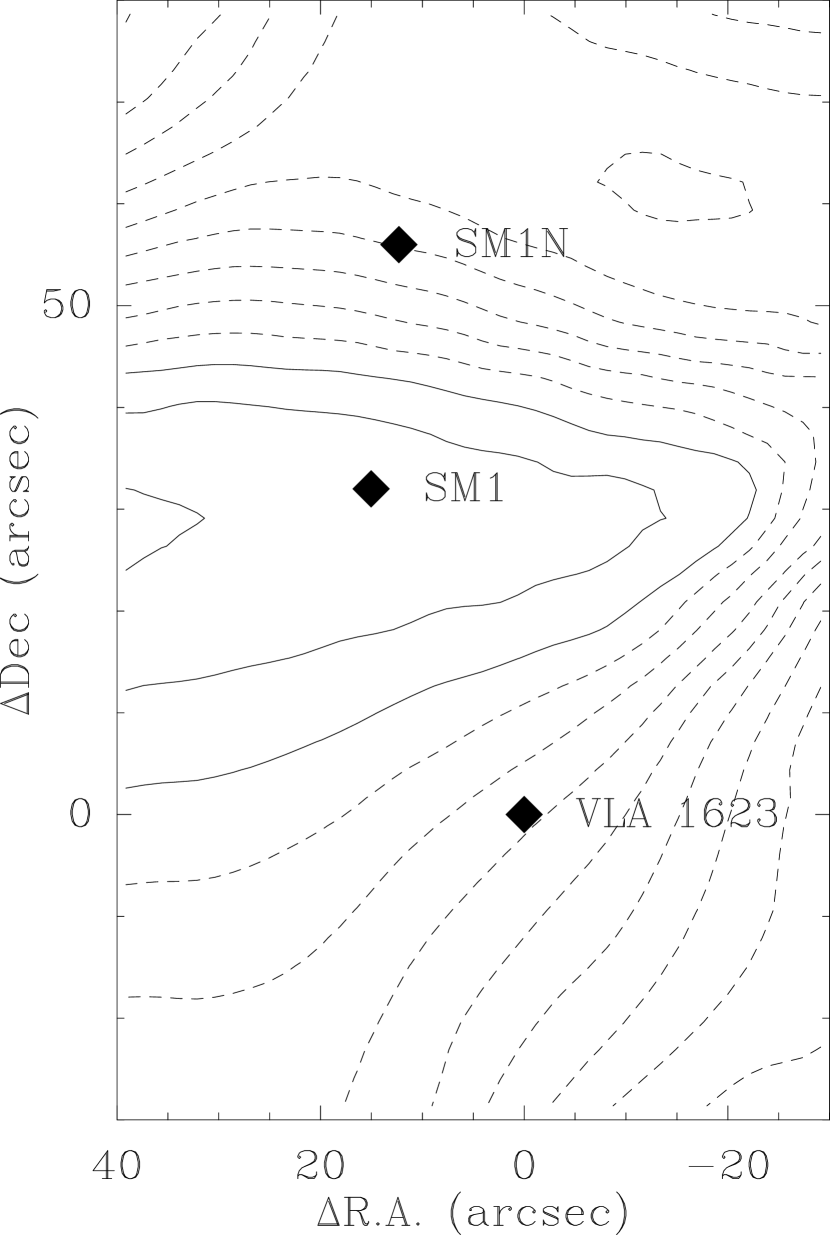
We present the HCO+ J=43 centroid velocity map of the VLA 1623 and SM1N region in Figure 5. Blue-Shifted and red-shifted emission are shown with dashed and solid isovelocity contours respectively. It has been shown in §3.2.2 that outflows show more of an impact on the line-wings of HCO+ emission. In an effort to lessen the impact of outflows on the centroid velocity map, the centroid velocities are computed only over the line core emission (2 – 6 km s-1).
The isovelocity contours around VLA 1623 are parallel to the direction of the outflow axis and show a gradient from the north-east to the south-west. The resulting gradient could be interpreted as a general rotation of the gas around VLA 1623 with the south-western gas rotating toward the observer and the north-eastern gas rotating away from the observer. Some evidence for this direction of rotation is also seen in the HCO+ integrated intensity map of Figure 4. The blue-shifted contours in VLA 1623 are even seen to extend north-east of the axis of rotation. The encroachment of the blue-shifted contours across the rotation axis displays the predicted “blue-bulge” infall signature.
The region around SM1N shows a more complex morphology in the centroid velocity map. If the gradient in isovelocity contours towards SM1N is interpreted solely as that produced by rotation, one major feature is that the sense of rotation is counter to that of VLA 1623 with the blue-shifted gas north of the source and the red-shifted emission toward the south. Another interesting feature is that unlike in VLA 1623 the isovelocity contours do not lie parallel to the outflow axis in SM1N. Toward the eastern edge of the map, the contours curve to the expected orientation if the contours were to align with the rotation axis. However, in the central regions, the gradient appears to be in a north-north-west to south-south-east direction. Such a direction for the gradient in HCO+ emission might result if even its line-core in SM1N is tracing both outflow and infall, in which case the resultant velocity gradient would be oriented at an angle intermediate between the outflow direction and rotational gradient direction. Although certainly less defined than the blue bulge found toward VLA 1623, SM1N’s blue bulge is evident from the blue shifted shifted isovelocity contours extending from the north-west through the source to the south-east.
4. Discussion
4.1. Infall Modelling
To constrain the infall parameters in both sources, we modeled our sources using a semi-analytic infall model based on the Terebey, Shu, and Casen (TSC) collapse treatment (Terebey et al., 1984). For a more complete explanation of the model used, see Narayanan (1997); Narayanan et al. (1998, 2002).


The TSC model requires the use of three parameters: the sound speed , the rate of cloud rotation , and the infall time (or infall radius ). After the model protostar has been generated, values for the temperature, density, and velocity along the prescribed lines of sight (LOSs) are generated for any given viewing angle. The LOSs are defined by two geometric angles: , the angle out of the plane of the sky, and , the angle in the plane of the sky. After the program generates all LOSs, a separate radiative transfer code calculates molecular and continuum emission along all LOSs using the assumption of local thermal equilibrium (LTE). Many model runs were made varying the infall and geometric parameters each time. The synthetic observations were then convolved to the resolution of the telescopes used in the observations. The best fit models were determined by eye by constraining the model spectra to the observed HCO+ and H13CO+ spectra.

The TSC model does not include outflows, while VLA 1623 and SM1N both have vigorous young outflow systems. However, as has been discussed in §3.2.2, while the line-wing emission of HCO+ seems to trace the outflows, the line-core emission itself seems to be less affected by the presence of outflows. Indeed, for VLA 1623, the centroid velocity map shown in Figure 5 shows predominantly the impact of rotation and infall, both of which are well-treated by the TSC formalism. In our infall modeling, we only use the line-core HCO+ to constrain the infall parameters. Even in this light, the infall parameters derived here should be used with some caution, as the models are for single isolated protostars, and not for clusters of protostars, and hence not rigorously applicable to the observations.
The comparison between the observed spectra and the simulated spectra of the best-fit model towards VLA 1623 is shown in Figure 7. While the spectral shapes are reasonably well-fit (at least in the central regions), the best fit TSC model does not do a good job of matching the observed centroid velocity map observed in HCO+ J=43 (see Figure 6). Given the caveats discussed above of applying the TSC model for this study, this latter result is not surprising. Similar model plots were made for SM1N, but are not shown here.
Since there is some evidence that even the line-core emission of HCO+ in SM1N is being impacted by the observed outflow (see § 3.2.3 and Figure 5), it was expected that it would be harder to fit the SM1N observations to the TSC model. The velocity gradient in Figure 5 seems to imply a more or less east-west rotational axis if the gradient is purely interpreted as due to that of rotation. In view of the possible contamination from the outflow, in our modeling, we forced the rotational axis for SM1N to be parallel to that of VLA 1623. Because of this, the model centroid velocity map for SM1N cannot reproduce the direction of the gradients seen in the observed map of Figure 5. However, the general appearance and width of the line profiles are well modeled even in the region towards SM1N.
When the effects of outflows are separable from the observations of density-sensitive molecules such as HCO+ and CS, the TSC model can be used reasonably effectively to derive infall parameters (see the case of IRAS 16293 and SMM4 in Narayanan et al. (1998) and Narayanan et al. (2002)). The results of the TSC models clearly indicate the difficulty in modeling complex regions that consist of both infalling and outflowing motions. In fact, the inability to adequately account for the presence of outflows, severely handicaps the modelling of spectra and centroid velocity maps along the axes of the outflows. Despite this shortcoming and the complexity of the region, our models are robust enough to deduce key properties of the regions around VLA 1623 and SM1N. The TSC models confirm VLA 1623’s outflow is within the plane of the sky to as initially proposed by André et al. (1990). Second, our modelling of VLA 1623 could not reproduce the observations unless a temperature gradient was applied to the TSC code. The best fit temperature gradient decreases at an angle of 32° west of south. The nearby B3 star, S1, provides the best physical explanation for this temperature gradient. Our best model parameters are summarized in Table 4.
| Source | rinf | a | tinf | vturb | |||
|---|---|---|---|---|---|---|---|
| (pc) | (km s-1) | (yr) | (s-1) | (o) | (o) | (km s-1) | |
| VLA 1623 | 0.01 | 0.33 | 3.0 x 10⁴ | 3 x 10-14 | 0 | -60 | 0.5 |
| SM1N | 0.006 | 0.58 | 1.0 x 10⁴ | 7 x 10-14 | 0 | -60 | 0.6 |
4.2. Timescales
One of the more difficult challenges in star formation is the determination of age. This difficulty arises from the lack of a definitive definition for the age of a protostar and inability to accurately measure key time dependent observables such as mass infall rate and velocity dispersion. One of the first estimates for the age of VLA 1623 was derived by André et al. (1990) by examining the dynamical timescale for VLA 1623’s molecular outflow. Their conclusion, a dynamical age of 3000 yr, is similar to the age derived by AWB93 (6000 yr) using the mass infall rate.
Using our submillimeter CO J=32 data, the dynamical age of VLA 1623 is found to be 4000 yr, in agreement with André et al. (1990). However, our modelling of VLA 1623 suggests an older age for the time since infall by approximately 10 times (see Table 4). Given errors in the calculations of both the dynamical and modelled age estimates, the similarity of the infall and dynamical timescales leads to the conclusion that large outflows develop almost from the onset of collapse.
5. Conclusions
We have observed two cores in the Oph A molecular cloud to investigate the kinematic signatures of star formation. We obtained isotopic and main line CO J=32, J=10, and HCO+ J=43, J=10 data of a known Class 0 source, VLA 1623, and a core that was previously identified as a pre-protostellar core, SM1N. Using more spatially extended and sensitive CO maps than those of KSHK and KSHUK, we confirm the detection of the second molecular outflow north of VLA 1623. This second outflow is most likely generated by the protostar SM1N, and not by the near-infrared star GY30 as suggested by KSHK and KSHUK. SM1N appears to be in a more progressed evolutionary stage of star formation than previously thought.
Millimeter observations toward the source positions show the expected blue asymmetry. However, the submillimeter transitions of HCO+ J=43 display a line profile signature of expanding rather than infalling gas. Most likely, in VLA 1623 and SM1N, the higher density, centrally condensed gas kinematics are greatly affected by the outflows emanating from both sources. Examination of the opacity profiles, however, provides support that, despite outflowing material, the core is still undergoing gravitational collapse.
We performed centroid analysis of VLA 1623 and SM1N to confirm the existence of the “blue bulge” signature found in other star forming regions. The “blue bulge” found around VLA 1623 is very well aligned with the axis of rotation and is strong, confirming that VLA 1623 is a true protostar. The centroid velocity map near SM1N also exhibits “blue bulge” signature but it is not as well aligned about a rotation axis as seen in VLA 1623.
The detection of infall and outflow motions towards SM1N suggests that both kinematic motions occur simultaneously from the earliest stages of star-formation.
References
- Adelson & Leung (1988) Adelson, L. M., & Leung, C. M., 1988, MNRAS, 235, 349
- André et al. (1990) André, P., Martin-Pintado, J., Despois, D., & Montmerle, T., 1990, A&A, 236, 180
- André et al. (1993) André, P., Ward-Thompson, D., & Barsony, M., 1993, ApJ, 406, 122 (AWB93)
- Barsony (1994) Barsony, M. 1994, ASP Conf. Ser. 65, Cluds, Cores, and Low Mass Stars, D. P. Clemens and R. Barvainis (San Francisco: ASP), 197
- Benson et al. (1998) Benson, P. J., Caselli, P., & Myers, P. C. 1998, ApJ, 506, 743
- Bergin et al. (2002) Bergin, E. A., Alves, J., Huard, T., & Lada, C. J. 2002, ApJ, 570, L101
- Caselli et al. (1995) Caselli, P., Myers, P. C., & Thaddeus, P. 1995, ApJ, 455, L77
- Di Francesco et al. (2004) Di Francesco, J., André, P., & Myers, P. C. 2004, ApJ, 617, 425
- Ellison et al. (1989) Ellison, B. N., Schaffer, P. L., Schaal, W., Miller, R. E., and Vail, D., 1989, Int. J. Infrared Millimeter Waves, 10, 937
- Erickson et al. (1999) Erickson, N. R., Grosslein, R. M., and Erickson, R. B., 1999, to appear in IEEE Trans. on Microwave Theory & Techniques.
- Gregersen et al. (1997) Gregersen, E. M., Evans, N. J., Zhou, S., & Choi, M., 1997, ApJ, 484, 256
- Heyer et al. (2004) Heyer, M. H., Narayanan, G., and Brewer, M., 2004, “OTFTOOL: FCRAO On-the-Fly Data Reduction Package”
- Kamazaki et al. (2001) Kamazaki, T., Saito, M., Hirano, N., and Kawabe, R., 2001, ApJ, 548,278 (KSHK)
- Kamazaki et al. (2003) Kamazaki, T., Saito, M., Hirano, N., Umemoto, T., & Kawabe, R. 2003, ApJ, 584, 357 (KSHUK)
- Motte et al. (1998) Motte, F., Andre, P., & Neri, R. 1998, A&A, 336, 150 (MAN98)
- Narayanan (1997) Narayanan, G., 1997, Ph.D. thesis, Univ. of Arizona
- Narayanan & Walker (1998) Narayanan, G., & Walker, C. K., 1998, ApJ, 508, 780
- Narayanan et al. (1998) Narayanan, G., Walker, C. K., & Buckley, H. D., 1998, ApJ, 496, 292
- Narayanan et al. (2002) Narayanan, G., Moriarty-Schieven, G., Walker, C. K., & Butner, H. M. 2002, ApJ, 565, 319
- Tafalla et al. (1998) Tafalla, M., Mardones, D., Myers, P. C., Caselli, P., Bachiller, R., & Benson, P. J. 1998, ApJ, 504, 900
- Terebey et al. (1984) Terebey, B. E., Shu, F. H., and Cassen, P., 1984, ApJ, 286, 529
- Walker et al. (1994) Walker, C. K., Narayanan, G., & Boss, A. P., 1994, ApJ, 431, 767
- Ward-Thompson et al. (1994) Ward-Thompson, D., Scott, P. F., Hills, R. E., & Andre, P. 1994, MNRAS, 268, 276
- Wilking & Lada (1983) Wilking, B. A. & Lada, C. J. 1983, ApJ, 274, 698