The non-constant slope of the C iv Baldwin effect in NGC 4151
Abstract
Context. The relationship between the emission-line equivalent width and the continuum luminosity, called the Baldwin effect, is important for studies of the physics of the broad-line region of AGNs. Some recent studies have revealed the non-constant slope of the intrinsic Baldwin effect for several Seyfert 1 galaxies.
Aims. Using the archived ultraviolet spectra obtained by IUE, HST, and HUT in 1978–2002, we investigated the intrinsic C iv Baldwin effect of the well-studied Seyfert 1 galaxy NGC 4151. Both its continuum flux and C iv emission-line flux varied about two orders of magnitude in more than two decades, making it one of the best targets for studying the slope variations caused by the Baldwin effect.
Methods. We fitted the C iv line profile of the 490 archived UV spectra of NGC 4151 with a similar model consisting of a few Gaussian components and derived the slope in the log-log plot for the total flux of C iv emission line against the UV continuum flux in different observation epochs.
Results. We found that the slope is not constant for NGC 4151, as it varies from 0.58 in the highest flux epoch to 0.83 in the lowest flux epoch. The slope evidently decreases as the continuum flux increases, which reinforces the previous findings of the non-constant slope in the Hβ Baldwin effect of NGC 5548 and the C iv Baldwin effect of Fairall 9.
Conclusions. Our result suggests that such a non-constant slope may not be unusual for AGNs. Its physical origin is probably related to the different non-linear responses of the emission line to the variable ionizing continuum caused by the different accretion modes at different luminosity levels. We briefly discuss the effects of various absorption components in the C iv line profile of NGC 4151 and argue that the slope variation is not driven mainly by the absorption effect. Intensive, long-term, and high-resolution spectral observations of strongly variable AGNs are needed in the future to confirm our result.
Key Words.:
galaxies: active – galaxies: individual (NGC 4151) – galaxies: nuclei – galaxies: Seyfert – ultraviolet: galaxies1 Introduction
The relation between the continuum and emission-line luminosities is important for our understanding of AGN physics. Such a relationship, known as the Baldwin effect, states that the broad emission-line equivalent width (EW) decreases as the continuum luminosity increases (Baldwin 1977; for a review see Osmer & Shields 1999). The Baldwin effect was first discovered for the C iv 1549 line (Baldwin 1977) and was confirmed later for most of the other strong UV emission lines (Kinney, Rivolo & Koratkar 1990), as well for the optical hydrogen Balmer lines (Gilbert & Peterson 2003; Goad, Korista & Knigge 2004).
The physical origin of the Baldwin effect is still unclear, but is probably related to the luminosity-dependent continuum variations. According to a theoretical work by Korista, Baldwin & Ferland (1998), the ionizing continuum shape is softened if the luminosity increases. The reduction in the ionizing photons at a given UV/optical luminosity leads to smaller equivalent widths of the broad emission lines. Indeed, some accretion disk models can also explain the continuum softening naturally in the case of increasing luminosity (Netzer, Laor & Gondhalekar 1992). However, other factors, such as the selection effect, variability, and light travel-time effects, may also account for some parts of or the scatters of the Baldwin effects (Jones & Jones 1980; Murdoch 1983; Krolik et al. 1991; Pogge & Peterson 1992; Peterson et al. 2002). Recent studies, including Baskin & Laor (2004) and Bachev et al. (2004), have revealed the possible correlations between the C iv EW and some parameters defining the Eigenvector 1 of AGNs (Boroson & Green 1992). Shang et al. (2003) also show that the Eigenvector 1 can contribute to the scatters of the Baldwin effect.
The Baldwin effect can be expressed by the simple formula , where is the continuum luminosity, or alternatively by , where is the emission line luminosity (evidently ). There are two kinds of Baldwin effects treated in the literature. One is the global Baldwin effect, which is obtained from the single-epoch observations for an ensemble of AGNs. The other is the intrinsic Baldwin effect, which represents the line-continuum relation in a single variable AGN. For the global Baldwin effect, the value was found to be and for C iv and Ly lines, respectively (Kinney et al. 1990; Pogge & Peterson 1992). Some studies also indicate steeper slopes of the global Baldwin effect for the relatively high ionization lines than those found for the low ionization ones (Wu et al. 1983; Kinney et al. 1987, 1990; Baldwin et al. 1989; Zheng et al. 1997). The flattening of the slope of the global Baldwin effect at lower continuum luminosities was mentioned previously by Osmer & Shields (1999) as a second-order effect, and was also noticed recently by Baskin & Laor (2004) from a study of 81 BQS quasars.
The intrinsic Baldwin effect (usually expressed as , where and are the emission line and continuum fluxes, respectively), has been studied only for several strongly variable AGNs. The derived value varies from 0.1 to 0.6 for different AGNs, with a mean value around 0.4 (Kinney et al. 1990; Pogge & Peterson 1992). Recently, Gilbert & Peterson (2003) and Goad et al. (2004) studied the intrinsic Baldwin effect for the best-studied Seyfert 1 galaxy NGC 5548 using the data of 13-year-observations and found that the value for the H line varies in a range from 0.4 to 1. Goad et al. (2004) find that the value decreases as the continuum flux increases, suggesting the slope of the intrinsic Baldwin effect is not constant. Wamsteker & Colina (1986) and Osmer & Shields (1999) also notice the slope change of the intrinsic C iv Baldwin effect for another Seyfert 1 galaxy, Fairall 9, which clearly shows the flattening of the EW value as the continuum flux decreases. Interestingly, the trend of the slope change in the intrinsic Baldwin effect seems consistent with that of the global Baldwin effect. However, this may not indicate that the physics behind them is totally the same. For example, either the different metallicity or black-hole mass has been invoked as possible origin of at least part of the global Baldwin effect (Warner, Hamann & Dietrich 2004), but this is clearly not relevant to the intrinsic Baldwin effect of a single AGN where these parameters are fixed.
To further test the non-constant slope of the intrinsic Baldwin effect, in this paper we investigate the relationship between the C iv emission line flux and the UV continuum flux for another well-known nearby Seyfert 1 galaxy NGC 4151 that has been extensively observed in the UV band by the International Ultraviolet Explorer (IUE), Hubble Space Telescope (HST), and Hopkins Ultraviolet Telescope (HUT) in the past three decades (Boksenberg et al. 1978; Clavel et al. 1987, 1990; Ulrich et al. 1991; Crenshaw et al. 1996, 2000; Kriss et al. 1992, 1995; Weymann et al. 1997; Kraemer et al. 2001; see Ulrich 2000 for a detailed review). Both the UV emission-line flux and continuum flux of NGC 4151 varied about two orders of magnitude in this long observation period, making it one of the best targets for studying the variation in the slope of the Baldwin effect.
In Sect. 2 we present the data analysis of the UV spectra from IUE, HST, & HUT. In Sect. 3 we show our result for the varying slope of the intrinsic C iv Baldwin effect. Finally we give our conclusions and briefly discuss our result in Sect. 4.
2 Data analysis of the archived UV spectra
To investigate the slope variation of the intrinsic C iv Baldwin effect in NGC 4151, we measured the flux of the C iv emission-line and the flux of UV continuum observed in a long period.
2.1 The data set
As a nearby () bright Seyfert 1 galaxy, NGC 4151 has been extensively observed by IUE (Boksenberg et al. 1978; Clavel et al. 1987, 1990; Ulrich 1996; Ulrich et al. 1991; Crenshaw et al. 1996; Edelson et al. 1996). However, different results have been found for the correlation between the UV continuum and the emission-line flux variations. For example, from the observations in the 1993 IUE campaign Crenshaw et al. (1996) found that the emission-line light curve does not correlate well with the continuum variation over the short duration of observations. But from the long-term light curves over two decades, the response of the emission-line flux with the continuum variation was clearly observed (Ulrich et al. 1991; Ulrich 2000). In this paper, we re-investigate this correlation using the 468 archived low-resolution large-aperture spectra of IUE/SWP from 1978 to 1996 (JD 2443722.59 to JD 2450243.40) where the C iv emission line was clearly detected.
Furthermore, NGC 4151 was observed by HUT at a resolution of 3 Å in December 1990 and March 1995 (Kriss et al. 1992, 1995), and the 8 archived HUT spectra are available. These observation were done in a time period that partly overlapped with that of the IUE observations. Therefore, the HUT spectra can be used to test the measurement accuracy of the IUE data.
NGC 4151 has also been frequently observed by HST. The 15 HST/STIS archived spectra in 1998–2002 are available and used in our study. However, the archived HST/GHRS spectra were skipped because they do not cover the whole red part of the C iv line profile (Weymann et al. 1997). In all of the 15 HST/STIS spectra, the whole C iv line profile is shown clearly.
In total, we collected 490 archived UV spectra of NGC 4151 with a wavelength range from about 1300 Å to 1800 Å observed by IUE, HUT, & HST in the period of 1978–2002.
2.2 The continuum and C iv emission-line flux determinations
Low-resolution spectra of NGC 4151 taken with IUE and HUT clearly show broad emission and remarkable central absorption in the C iv line profile. However, high-resolution spectra from HST have revealed many more other subtle emission and absorption features (Weymann et al. 1997; Crenshaw et al. 2000; Kraemer et al. 2001). Therefore, the C iv line profile of NGC 4151 is very complex and needs to be treated with caution. Because 468 of the 490 archived spectra in our study were obtained by IUE, the lower resolution of IUE spectra does not allow a more accurate fitting of the subtle emission and absorption features. In order to avoid the systematic uncertainties caused by different fitting models, in this study we simply adopt the same spectral-fitting model for the HST and HUT spectra as for the IUE spectra.
The accurate measurement of the continuum flux is important. Usually, the local continuum fitting with a power-law or a straight line can produce reasonable measurement if the fitting is made with caution. Here we use a straight line to fit the local continuum in the selected continuum windows, namely 1260–1290 Å, 1420–1460 Å, and 1805–1835 Å. The results are satisfactory. In fitting the continuum, we find that the C ii 1334 Å line has relatively strong effects on the continuum flux measurement at 1350 Å. Therefore, we adopt the continuum flux at 1440 Å for our study of the line-continuum relation of NGC 4151 because the lines around 1440 Å, like O iv] 1402 Å and N iv] 1486 Å, are relatively weak. The continuum flux at 1440 Å was taken as the weighted mean over the wavelength range 1420-1460 Å, and the flux uncertainty is estimated from its standard deviation. No correction is made for the extinction, as it is negligible for NGC 4151 (Kriss et al. 1992).
In the IUE spectra of NGC 4151, the C iv 1548.2, 1550.8 lines are blended with a few variable components covering a wavelength range from 1480 Å to 1700 Å (see Clavel et al. 1987 for the details). To reduce the contamination from other lines, we fit the continuum-subtracted spectra within the wavelength range from 1450 Å to 1720 Å simultaneously with ten individual Gaussian components. Five lines like N iv] 1486 Å, L1 1518 Å, L′2 1576 Å, L2 1594 Å, O iii] 1663 Å are fitted with a single Gaussian component. The C iv line is fitted with three Gaussian components: a broad emission component, a narrow emission component, and a narrow absorption component. The H ii 1640 Å emission line is fitted with two Gaussian components including a narrow one and a broad one. Two narrow and variable satellite emission lines (L1 and L2) were first noticed by Ulrich et al. (1985) when NGC 4151 was at a low continuum state. Using the high-resolution HST/STIS spectra of NGC 4151, Crenshaw et al. (2000) indicate that these satellite emission lines (L1, L′2, and L2) shown in the IUE spectra are not in fact separate lines, but rather the residual emission that appears isolated due to the low-ionization absorption lines (primarily Si ii 1526.7 Å, Si ii1533.4 Å, and Fe ii multiples) overlaying the large part of wings of C iv. Assuming them to be the satellite emission lines can slightly underestimate the total emission line flux of C iv in the low-continuum case. The effects of such a simplification on our result will be addressed in Sect. 3.
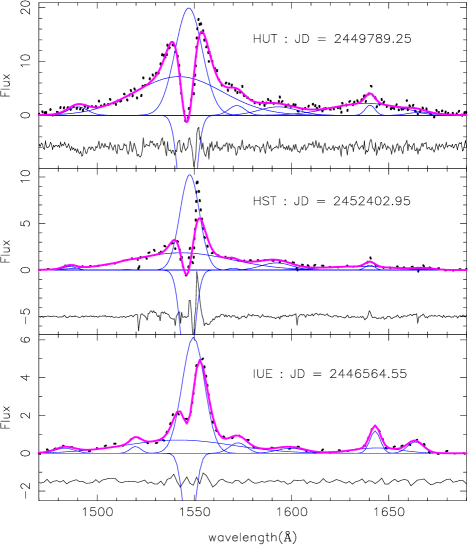
The nonlinear least-square Levenberg-Marquart minimization method is used in our spectral fitting. Unlike Clavel et al. (1987) who fixed the line widths of some Gaussian components, we allow the fitting parameters for all components, such as the line central wavelength, velocity dispersion, and the area under a line, to vary at certain ranges. The uncertainties of these parameters are obtained using a method similar to the one adopted in Clavel et al. (1991). Three examples of our multi-component fitting of the spectra taken at the low, moderate, and high flux states with IUE, HST, & HUT, respectively are shown in Fig. 1. The fittings are satisfactory in general. However, sometimes the red peak around 1540–1560 Å is too sharp to be fitted perfectly, especially for the spectra taken by HST. This leads to a slight underestimation of the total C iv emission line flux but will not affect our result significantly.

In Fig. 2, we show the light curves of the continuum flux at 1440 Å, the total C iv line flux (the sum of the modeled broad emission, narrow emission, and absorption components), and the broad emission-line component flux from the IUE, HUT, & HST observations in 1978–2002. A huge broad peak in 1991–1998 and several sub-peaks are clearly shown in all three light curves. The overall response of the C iv emission line with the continuum variation is clear in these long-term light curves. This also confirms that the emission-line response with the continuum cannot be revealed by the short duration observations (Crenshaw et al. 1996) but can be clearly detected by the long-term spectral monitorings.
3 The intrinsic Baldwin effect of NGC 4151
Using the measured flux data for both C iv emission line and UV continuum, we can study the slope variation in the C iv Baldwin effect.

3.1 The non-constant slope
The Baldwin effect represents the dependence of the equivalent width (EW) of C iv emission line on the UV continuum flux. Figure 3 shows the total C iv emission-line flux and the line EW against the UV continuum flux at 1440 Å for NGC 4151. The data from HUT & HST are fully consistent with those from IUE, clearly suggesting a non-constant slope in the log-log plots. We notice that the trend of the curvature in the upper panel of Fig. 3 is similar to that found for the intrinsic H Baldwin effect of NGC 5548 (see Fig. 4 of Goad et al. 2004) and Fairall 9 (see Fig. 2 of Wamsteker & Colina 1986), which also show the steepening of the slope at the lower flux state and the flattening of the slope at the higher flux state. In the EW-continuum plot (the lower panel of Fig. 3), the flattening of the slope in the low continuum state is also consistent with the trend noticed by Osmer & Shields (1999) for Fairall 9. This suggests that the non-constant slope of the Baldwin relationship may be usual for AGNs.
To demonstrate the non-constant slope of the Baldwin effect for NGC 4151 more clearly, we divide the observations into 4 epochs. Epoch 1 (JD2443722–JD2445654) covers the IUE observations in 1978–1983, which shows at least two sub-peaks in the light curve. Epoch 2 (JD2445766–JD2447631) covers the IUE observations in 1984–1989, which represents the lowest flux state in all the UV observations. Epoch 3 (JD2447948–JD2450243) covers the IUE observations in 1990–1996 and the HUT observations in 1990 and 1995. The number of spectra in this epoch is significantly larger than others since it includes 203 spectra obtained in a one-month intensive IUE campaign in 1993, which covers the highest flux state of NGC 4151. Epoch 4 covers the HST observations in 1998–2002. Although only 15 HST/STIS spectra are available, we can still clearly see that both the continuum flux and C iv emission line flux fade away in this epoch from the major peak. The numbers of spectra, the average UV continuum flux, and the estimated slope of the Baldwin effect in these 4 epochs are listed in Table 1. The variation in the slope with the UV continuum flux is shown clearly in Fig. 4. The slope varies from 0.58 in epoch 3 (the highest flux case) to 0.83 in epoch 2 (the lowest flux case). The result from the HST observations ( in epoch 4) confirms the trend obtained from the IUE and HUT observations in the other 3 epochs. A smaller slope value (0.17) in epoch 3 is consistent with the almost constant EW value at the lower flux state noticed for Fairall 9 by Wamsteker & Colina (1986) and Osmer & Shields (1999). The slope values for NGC 4151 are also well within the range for the broad Hβ line of NGC 5548 found by Goad et al. (2004), who indicated that the slope varies from 0.4 to 1 in the 13-year observations of NGC 5548.


3.2 The effects of absorption features
The non-constant slope of the intrinsic Baldwin effect has been found so far for NGC 4151 (this paper), Fairall 9 (Wamsteker & Colina 1986; Osmer & Shields 1999), and NGC 5548 (Goad et al. 2004). However, unlike Fairall 9 and NGC 5548, which show no absorptions and weak ones in their UV spectra, respectively (Crenshaw et al. 1999), NGC 4151 shows much more remarkable absorption features, especially in the C iv line profile (Boksenberg et al. 1978; see also Fig. 1). These absorption components also vary with the UV continuum. From Fig. 1 we see that the central absorption is stronger when the continuum flux is higher. This absorption feature has been found to actually combine various absorption lines with different ionization potentials (Kriss et al. 1992; Weymann et al. 1997; Crenshaw et al. 2000; Kraemer et al. 2005). Considering the absorption feature, a natural question then arises: is the non-constant slope of the C iv Baldwin effect in NGC 4151 due to the variation in absorption at different continuum flux levels? To answer this question, we investigated the variations in the broad emission, narrow emission, and absorption components of C iv line. Figure 5 shows the variations in these components with the UV continuum flux. We can see that the flux values of all these three components decrease when the continuum flux decreases. The variation in the absorption component is very similar to that of the narrow emission-line component. Moreover, we noticed that in the higher continuum flux state, the broad-line component always dominates the total C iv flux. In the lower continuum flux state, however, the narrow emission-line component becomes dominant. Both the broad-line component and the central absorption components become relatively weak. If we consider the Baldwin effect of the broad emission-line component alone, we also can obtain a non-constant slope with varying from 0.740.02 in the highest flux epoch to 1.330.12 in the lowest flux epoch, which clearly indicates that the non-constant slope may not be dominated by the absorptions.
As mentioned in Sect. 2, besides the remarkable central absorption component, there are also many subtle absorption features in the wings of C iv profile of NGC 4151, as revealed by the high-resolution HST spectra (Weymann et al. 1997; Crenshaw et al. 2000; Kraemer et al. 2001). These complex features make it more difficult to extract the information of the unabsorbed C iv flux. In our spectral fitting, we only use a Gaussian component to represent the central absorption of C iv and treat the absorption-induced ‘emission’ features in the wings of C iv as satellite emission lines (L1, L′2, and L2). As these features are in fact caused by the low-ionization absorption lines overlaying the large part of wings of C iv, our simplification would underestimate the total flux of C iv. As indicated by Crenshaw et al. (2000), these low-ionization absorption features are weak in the high-flux state and become prominent when the UV continuum drops to a low state. Therefore, the simplification of our spectral fitting is fine when NGC 4151 is bright (e.g. the continuum flux larger than , as in epochs 1 and 3). Even from the result obtained in these two epochs when NGC 4151 is relatively bright, the slope variation of the Baldwin effect is still evident (see Fig. 4). Using the HST/STIS spectra, we also investigate the difference in the spectral fitting with our model and the model consisting of three Gaussian components to represent three low-ionization absorption lines at around 1526 Å, 1533 Å, and 1577 Å, respectively. The difference is about 2% when the UV continuum flux is larger ( on JD2450855) and about 13% when the UV continuum flux is smaller ( on JD2451334). Although the equivalent widths of these low-ionization absorption lines become greater when the source is fainter, we see that the simplification of our spectral fitting does not lead to significant underestimation of the total C iv flux even in the faint state of NGC 4151. Together with the similar trend in the Baldwin effect found for Fairall 9, which does not show absorptions in C iv, and for NGC 5548, which does show some narrow absorption features in C iv but not in Hβ, we believe that the non-constant slope of the C iv Baldwin effect in NGC 4151 should not be driven mainly by the absorption effect. However, more quantitative studies of the effects of complex absorption features on the Baldwin effect of NGC 4151 are still needed.
4 Conclusion and discussion
With the long-term UV spectral data of IUE, HUT, & HST, we found the non-constant slope in the intrinsic C iv Baldwin effect of Seyfert 1 galaxy NGC 4151. The trend of the slope change with the UV continuum flux variation is similar to those found for two other Seyfert 1s, Fairall 9 and NGC 5548, suggesting that the non-constant slope may be usual for AGNs. The physical origin of such a non-constant slope is probably related to the different response of the broad-line emission to the continuum variations at different luminosity levels (Korista et al. 1998).
From the theoretical point of view, an accretion disk at different luminosity levels (corresponding to different accretion rates) should have different accretion modes. Probably the AGNs accrete in a radiatively inefficient accretion flow (see Narayan, Mahadevan & Quataert 1998 for a review) at a lower accretion rate and in a standard optically thick disk (Shakura & Sunyaev 1973) or a slim disk (Abramowicz et al. 1988) at a higher accretion rate. Different accretion modes radiate differently, producing a relatively hard spectrum at a lower accretion rate and a soft spectrum at a higher accretion rate. Because the ionizing continuum of AGNs mainly comes from the radiation of the accretion disk, the difference in the disk-emitting spectrum may lead to the different response of the emission line to the ionizing continuum through the photoionization process. For NGC 4151, the lowest and highest continuum fluxes at 1440 Å in the 1978–2002 observational period are about and , which correspond to luminosities at 1440 Å of and , respectively. If we adopt the black-hole mass for NGC 4151 as (Peterson et al. 2004) and assume in the UV/optical band and for deriving the bolometric luminosity (Kaspi et al. 2000), we can estimate the Eddington ratio (, usually taken as a measure of the dimensionless accretion rate) in the lowest and highest flux states of NGC 4151 as 0.001 and 0.2, respectively. Clearly, the dimensionless accretion rate of NGC 4151 varies more than two orders of magnitude. Because the critical dimensionless accretion rate between a radiatively efficient accretion flow and a radiatively inefficient one is about 0.01 (Narayan et al. 1998), most probably NGC 4151 accretes in a radiatively inefficient accretion flow at the lower flux state but in a radiatively efficient one at the higher flux state. Such a change of accretion modes can not only produce different spectral energy distributions in the ionizing continuum, but can also produce different non-linear responses of the C iv emission line and then lead to the non-constant slope of the Baldwin effect in the different luminosity levels.
Previous studies have revealed the importance of the light-travel time effect on the Baldwin effect (Krolik et al. 1991; Pogge & Peterson 1992; Peterson et al. 2002). Correction of such an effect can substantially reduce the scatters of the intrinsic Baldwin effect. However, the time lag for NGC 4151 between the C iv emission line and the UV continuum flux is not well-determined. Clavel et al. (1990) obtained a delay of days using the two-month data with a mean interval of 3.4 days of the IUE campaign in 1988–1989 when NGC 4151 was relatively faint. Crenshaw et al. (1996) failed to detect any correlation between the C iv line and UV continuum flux from a short but intensive IUE campaign in December 1993 when NGC 4151 was relatively bright. We also used the whole IUE data set in 1978–1996 and estimated the time lag between the total C iv line flux and the continuum flux at 1440 Å with an interpolation cross-correlation function (ICCF) method developed by Gaskell & Sparke (1986), Gaskell & Peterson (1987), and White & Peterson (1994). We found that the time lag is about 1.9 days. We tried to use such a time lag to correct the light-travel time effect for NGC 4151 and found that our result does not change. This is mainly because the mean interval of the whole UV data set in 1978–2002 is about 15 days, which is significantly longer than the estimated time lag.
In conclusion, we find the non-constant slope of the intrinsic Baldwin effect in NGC 4151 and suggest that such a non-constant slope may not be unusual for AGNs. Obviously, more studies on more AGNs are needed to confirm our result. This will require intensive, long-term, and high-resolution UV spectral monitoring with the current and future space UV observatories on some strongly variable AGNs. We expect that these future studies will help us to extract more accurate emission-line and continuum fluxes and establish a more reliable line-continuum relation for AGNs.
Acknowledgements.
We are grateful to Prof. Brad Peterson for kindly providing an ICCF program to calculate the time lag, to the anonymous referee for his/her constructive comments which help to improve the paper significantly, and to Mr. Lei Qian and Mr. Bingxiao Xu for many helpful discussions. The authors are supported by the National Natural Science Foundation of China (Grants No. 10473001, No. 10525313, and No. 10521001), the RFDP Grant (No. 20050001026), and the Key Grant Project of Chinese Ministry of Education (No. 305001).References
- (1) Abramowicz, M. A., Czerny, B., Lasota, J. P., & Szuszkiewicz, E. 1988, ApJ, 332, 646
- (2) Bachev, R., Marziani, P., Sulentic, J. W., Zamanov, R., Calvani, M., & Dultzin-Hacyan, D. 2004, ApJ, 617, 171
- (3) Baldwin, J. A. 1977, ApJ, 214, 679
- (4) Baldwin, J. A., Wampler, E. J., & Gaskell, C. M. 1989, ApJ, 338, 630
- (5) Baskin, A., & Laor, A. 2004, MNRAS, 350, 31
- (6) Boksenberg, A., Snijders, M. A. J., Wilson, R., et al. 1978, Nature, 275, 404
- Boroson & Green (1992) Boroson, T. A., & Green, R. F. 1992, ApJS, 80, 109
- (8) Clavel, J., Altamore, A., Boksenberg, A., et al. 1987, ApJ, 321, 251
- (9) Clavel, J., Boksenberg, A., Bromage, G. E., et al. 1990, MNRAS, 246, 668
- (10) Clavel, J., Reichert, G. A., Alloin, D., et al. 1991, ApJ, 366, 64
- (11) Crenshaw, D. M., Kraemer, S. B., Boggess, A., Maran, S. P., Mushotzky, R. F., & Wu, C.-C. 1999, ApJ, 516, 750
- (12) Crenshaw, D. M., Kraemer, S. B., Hutchings, J. B., et al. 2000, ApJ, 545, 27
- (13) Crenshaw, D. M., Rodriguez-Pascual, P. M., Penton, S. V., et al. 1996, ApJ, 470, 322
- (14) Edelson, R. A., Alexander, T., Crenshaw, D. M., et al. 1996, ApJ, 470, 364
- (15) Gaskell, C. M. & Peterson, B. M. 1987, ApJS, 65, 1
- (16) Gaskell, C. M. & Sparke, L. S. 1986, ApJ, 305, 175
- (17) Gilbert, K. M., & Peterson, B. M. 2003, ApJ, 587, 123
- (18) Goad, M. R., Korista, K. T., & Knigge, C. 2004, MNRAS, 352, 277
- (19) Jones, B. J. T., & Jones, J. E. 1980, MNRAS, 193, 537
- Kaspi et al. (2000) Kaspi, S., Smith, P. S., Netzer, H., Maoz, D., Jannuzi, B. T., & Giveon, U. 2000, ApJ, 533, 631
- (21) Kinney, A. L., Huggins, P. J., Glassgold, A. E., & Bregman, J. N. 1987, ApJ, 314, 145
- (22) Kinney, A. L., Rivolo, A. R., & Koratkar, A. P. 1990, ApJ, 357, 338
- (23) Korista, K., Baldwin, J., & Ferland, G. 1998, ApJ, 507, 24
- (24) Kraemer, S. B., Crenshaw, D. M., Hutchings, J. B., et al. 2001, ApJ, 551, 671
- (25) Kraemer, S. B., George, I. M., Crenshaw, D. M., et al. 2005, ApJ, 633, 693
- (26) Kriss, G. A., Davidsen, A. F., Blair, W. P., et al. 1992, ApJ, 392, 485
- (27) Kriss, G. A., Davidsen, A. F., Zheng, W., Kruk, J. W., & Espey, B. R. 1995, ApJ, 454, 7
- (28) Krolik, J. H., Horne, K., Kallman, T. R., Malkan, M. A., Edelson, R. A., & Kriss, G. A. 1991, ApJ, 371, 541
- (29) Murdoch, H. S. 1983, MNRAS, 202, 987
- Narayan, Mahadevan & Quataert (1998) Narayan, R., Mahadevan, R., & Quataert, E., 1998, In Theory of Black Hole Accretion Disks, eds M. A. Abramowicz, G. Bjornsson, & J. Pringle, Cambridge University Press, p.148
- (31) Netzer, H., Laor, A., & Gondhalekar, P. M. 1992, MNRAS, 254, 15
- (32) Osmer, P. S., & Shields, J. C. 1999, ASPC, 162, 235
- (33) Peterson, B. M., Berlind, P., Bertram, R., et al. 2002, ApJ, 581, 197
- (34) Peterson, B. M., Ferrarese, L., Gilbert, K. M., et al. 2004, ApJ, 613, 682
- (35) Pogge, R. W., & Peterson, B. M. 1992, AJ, 103, 108
- Shakura & Sunyaev (1973) Shakura, N. I., & Sunyaev, R. A. 1973, A&A, 24, 337
- (37) Shang, Z.-H., Wills, B. J., Robinson, E. L., et al. 2003, ApJ, 586, 52
- (38) Ulrich, M.-H. 1996, MNRAS, 281, 907
- (39) Ulrich, M.-H. 2000, A&ARv, 10, 135
- (40) Ulrich, M. H., Altamore, A., Perola, G. C., et al. 1985, Nature, 313, 747
- (41) Ulrich, M.-H., Boksenberg, A., Penston, M. V., et al. 1991, ApJ, 382, 483
- (42) Wamsteker, W., & Colina, L. 1986, ApJ, 311, 617
- (43) Warner, C., Hamann, F., & Dietrich, M. 2004, ApJ, 608, 136
- (44) Weymann, R. J., Morris, S. L., Gray, M. E., & Hutchings, J. B. 1997, ApJ, 483, 717
- (45) White, R. J., & Peterson, B. M. 1994, PASP, 106, 879
- (46) Wu, C.-C., Boggess, A., & Gull, T. R. 1983, ApJ, 266, 28
- (47) Zheng, W., Kriss, G. A., Telfer, R. C., Grimes, J. P., & Davidsen, A. F. 1997, ApJ, 475, 469