Energy-dependent variability and the origin of the soft X-ray excess in AGN
Abstract
The origin of the soft excess seen in many AGN below 1 keV is still an unsolved problem. It is unlikely to represent a true continuum component as its characteristic ‘temperature’ shows a remarkable constancy over a wide range of AGN luminosity and black hole mass. This instead favours an association with atomic processes, in particular with the increase in opacity between 0.7–2 keV associated with partially ionized O and Fe. The opacity jump can give rise to a soft excess either through reflection or transmission, and both scenarios can fit the spectra equally well as long as there is strong velocity shear to smear out the characteristic narrow atomic features. Here we use orthogonal constraints from the energy-dependent variability. The rms spectra seen in XMM-Newton AGN data often show a broad peak between 0.7–2 keV. We show that the absorption model can explain the data well if the ionization state of the smeared absorption responds to luminosity changes in the continuum.
keywords:
accretion, accretion discs – atomic processes – galaxies: active – X-rays: galaxies.1 Introduction
One of the most interesting problems in AGN astrophysics is the origin of the soft X-ray excess in Seyfert 1s and radio-quiet quasars. The soft X-ray spectra of these objects often show extra emission below 1 keV with respect to the extrapolated power law observed at higher energies. This was originally interpreted as thermal emission from the (Comptonized) accretion disc (Turner & Pounds 1988; Magdziarz et al. 1998). However, the temperature of this component is remarkably constant around 0.1–0.2 keV regardless of central object luminosity and mass, in conflict with disc models (Czerny et al 2003; Gierliński & Done 2004, hereafter GD04; Crummy et al. 2006).
The constant temperature of the soft excess is very difficult to reconcile within any model of continuum emission. It is much easier to explain if it has an origin in atomic processes, as these have characteristic energies. In particular, there is a strong jump in opacity at 0.7 keV from partially ionized material, where O vii/O viii and the Fe M shell unresolved transition array (UTA) combine to produce much more absorption above this energy than below. However, the soft excess is very smooth, with no discernable line and edge features expected from atomic processes. Thus if this is the origin of the soft excess, the partially ionized material must have strong velocity gradients so that Doppler shifts smear these out.
Two alternative scenarios have been proposed using this underlying physics. The first is that the partially ionized, velocity smeared material is seen in reflection (e.g. Fabian et al. 2002a, 2004, 2005; Crummy et al. 2006), the other that it is seen in absorption (GD04; Chevallier et al. 2006; Schurch & Done in press). The reflection geometry sets a limit on the size of the soft X-ray excess to only a factor 2–3 above the extrapolation of the higher energy spectrum (assuming an isotropic source above a smooth disc surface), as the maximum reflected flux is set by the level of the illuminating flux. However, some sources are observed to have soft excesses which are much stronger than this, leading to the additional requirement of anisotropic illumination, perhaps from gravitational light bending, and/or a corrugated disc surface which hides most of the intrinsic flux from sight (Fabian et al. 2002a; Miniutti et al. 2003; Miniutti & Fabian 2004). The alternative geometry, where the partially ionized, velocity smeared material is seen in absorption, removes this requirement as it has no corresponding limit on the size of the soft excess. Instead, it requires fast moving ionized material in the line of sight (e.g. Sobolewska & Done in preparation, hereafter SD06).
These two models represent rather different physical geometries, and give rather different spectral deconvolutions of the data. However, they are indistinguishable in terms of statistical fit quality even with excellent spectral data constraining the shape of the soft excess from XMM-Newton (Chevallier et al. 2006; SD06). This is especially important as the interpretation of the soft excess impacts on the inferred properties of the spacetime. A reflection dominated approach leads to inferred high-to-maximal black hole spin, and perhaps also to an emissivity which is enhanced by extraction of the spin energy of the black hole (Wilms et al. 2001). This is seen both in terms of the iron line smearing, and in the size of the soft excess assuming that light bending is the origin of the anisotropic illumination of the disc (Fabian et al. 2004; Crummy et al. 2006). By contrast, with the absorption approach, SD06 and Schurch & Done (in press) show that this continuum curvature removes the requirement for an extreme red wing to the iron line in PG 1211+143. There is still a reflection component from the X-ray illuminated disc, but this does not dominate the spectrum and the amount of relativistic smearing is compatible with any black hole spin.
The idea that the extremely broad residual between 3 and 6 keV seen, e.g., in MCG–6-30-15 could be an artifact of absorption induced continuum curvature was originally proposed by Inoue & Matsumoto (2003) and Kinkhabwala (2003). They showed that absorption can indeed match the shape of the broad residual seen in moderate resolution ASCA data. However, Young et al. (2005) pointed out that this model also predicts strong, narrow iron line absorption in the 6.45–6.5 keV range, which is not seen in high resolution Chandra grating data. The model of GD04 differs from this in that the absorption is smeared due to a large (relativistic) range of velocities, so there are no narrow absorption features, consistent with the Chandra limits.
Thus distinguishing between the absorption and reflection geometries is very important in terms of understanding the spacetime of the black hole as well as understanding the nature of the accretion flow. Since the spectral approach is currently unable to discriminate between these two models, we here investigate their variability properties in the hope that this would give orthogonal constraints. Inoue & Matsumoto (2003) showed that the ASCA variability spectrum of MCG–6-30-15 is consistent with a varying power law and varying warm absorbers. Here, we study in details the energy-dependent variability of an ionized absorber due changes in the luminosity of the continuum and show that this can match the observed variability spectra of three AGN.
2 Energy-dependent variability
2.1 Models
The standard approach to investigate the energy dependence of the variability is to plot the fractional root mean square (rms) variability amplitude, , as a function of energy. The techniques for calculating such spectra are described in Edelson et al. (2002), Markowitz, Edelson & Vaughan (2003) and Vaughan et al. (2003), but in outline the method consists of extracting a background subtracted light curve in each energy band, then calculating the fractional rms variability in the light curve, and then correcting this for the additional variance imposed by the measurement errors. These techniques have been applied to data from several instruments covering a range of energies: RXTE (3–20 keV), ASCA (0.7–10 keV) and XMM-Newton (0.3–10 keV).
The rms spectrum from a given object need not to be unique. It depends on the time-scales on which the data are measured, as these probe different size-scales. RXTE monitored various AGN on all time-scales between days and years (Markowitz et al. 2003), while ASCA and XMM-Newton observed over much shorter time-scales (hundreds of seconds to days). AGN variability can be also non-stationary (Green, McHardy & Done 1999), so the rms spectra can change in time. This was demonstrated by Gallo et al. (2004c) who obtained dramatically different rms spectra depending on whether a strong flare in the light curve was included or not.
Typically the rms spectra are consistent with a broad peak in the variability amplitude between 0.8–2 keV, decreasing to higher and lower energies, reaching a minimum around the Fe K line, and then increasing slightly above this energy (Fabian et al. 2002b; Inoue & Matsumoto 2003; Markowitz et al. 2003; Gallo et al. 2004a, b; Ponti et al. 2004, 2006). This alone is enough to strongly support atomic models for the origin of the soft excess, as it is very hard to imagine the variability of any true soft continuum component producing such energy dependance.

A successful model should simultaneously be able to explain both the spectrum and the energy-dependent variability. However, in general, the X-ray spectra of AGN are complex and consist of many components, e.g. cold absorption, warm absorbers, continuum and reflection (see, e.g., Fabian & Miniutti in press). Here we first examined the variability produced by the smeared absorption model of GD04. This is built around the absorption calculated from the sophisticated photoionization code, xstar (Bautista & Kallman 2001), and then smeared using a Gaussian kernel. This approximates the behaviour of a large velocity shear in the absorber, and has the effect of removing the characteristic narrow absorption features, so as to produce a smooth soft excess.
Three basic types of variability can be produced from such a model. Firstly, the ionization state of the absorber, , (where , and are the luminosity, density and distance of the cloud from the ionizing source, respectively) could change, in response to the illuminating continuum variability. Secondly, its column density, , could change as a result of clouds moving in and out of the line of sight. Finally, the velocity shear, parameterized by the width of the smearing Gaussian, , could change. The most physically plausible seems to be changes in ionization, especially as it is clear that the continuum does vary (regardless whether it is due to accretion rate change, or, e.g., light bending effects; Miniutti et al. 2003). Hence, we first examined the effect of changing .
We employed a Monte Carlo approach to quantify the spectral variability. We simulated 3000 model spectra where 111We denote 1 erg cm s-1), for the sake of clarity. was varied randomly with Gaussian distribution of standard deviation [or fractional rms, ] around a given mean, . All other parameters were fixed. These model spectra were used to calculate the standard deviation at each energy channel, and thus to produce the rms spectrum (Gierliński & Zdziarski 2005).
We started from parameters of the smeared absorber which are close to those which fit the spectrum of PG 1211+143 (GD04; SD06; Schurch & Done in press): cm-2, and . The continuum was a power law with the photon spectral index = 2.3. Such a soft intrinsic index is the effect of the absorber hardening the apparent spectrum above 1 keV. For example, SD06 show that the spectral index of the underlying continuum in 1H 0707–495 is 2.5 in the smeared absorber model, while the apparent 2–10 keV index is 1.8. We point out, that the exact value of the spectral index has little effect on our results.
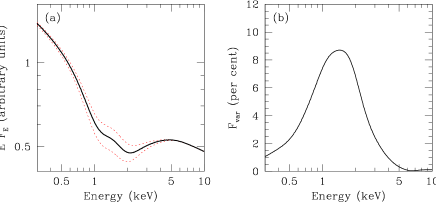
Fig. 1 shows the effect of varying by 3 per cent of its mean value, i.e. = 0.03. Panel (a) shows the spectral effect of this broad absorption. The two major sources of opacity are at 0.9 keV (predominantly from O vii/O viii lines and edges, together with the Fe UTA) and at 1.2–2 keV (predominantly from Fe L lines and edges). At lower ionization the absorption becomes more prominent, while at higher ionization the medium becomes more transparent, but since there is little opacity below 0.5 keV and above 5 keV, the variability spectrum (shown in Fig.1b) results in a broad peak between these energies, as is typically seen from AGN rms spectra (Fabian et al. 2002b; Markowitz et al. 2003; Gallo et al. 2004a, b; Ponti et al. 2004, 2006).
We explored the range of variability spectra produced by different columns and mean ionization parameters. The rms spectra shown in Fig. 2 were calculated from 3 per cent variability in , i.e. corresponding to changes of 20 per cent in . The intrinsic spectral index of the continuum was 2.3. All these show the characteristic peak in the rms at 1–2 keV, but with very different normalization. This is because the depth of the absorption trough in the spectrum is a highly non-linear function of the ionization state. A small decrease in leads to much larger increase in opacity for than for , so giving much higher amplitude of variability for the same column at lower mean ionization states. The behaviour with column is somewhat simpler as it is not a function of ionization state. At lower columns the absorption has a smaller effect on the spectrum, so the changes in ionization give rise to less dramatic variability.
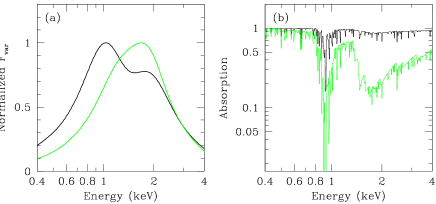
There are also some detailed changes in the shape of the rms spectra. We illustrate this by rescaling two of the rms spectra shown in Fig. 2(b) to their peak value and plotting them on a linear scale in Fig. 3(a). The shape changes from being dominated by a peak at 1 keV (lowest column) to being dominated by a peak at 2 keV (highest column) with intermediate columns showing both peaks in varying ratios. This is due to differential variability of the two major absorption systems at 0.9 keV and 1.2–2 keV. The former is produced predominantly by lines while the latter is predominantly edges (Fig. 3b). The lines easily become optically thick at high columns, so their effect on the spectrum saturates, and the rms spectra depend more on the opacity of the edges. High ionization iron L edges dominate for = 3.0, giving rise to the peak at 2 keV. At = 2.6 lower ionization iron ions dominate, so the peak at high column is at 1.2 keV (Fig. 2a). The point at which the resonance lines become optically thick (and hence insensitive to changes in ionization) depends on the turbulent velocity assumed for the absorption models. We assumed 100 km s-1 but the velocity shear required for the smearing of 0.2–0.3 may be a more realistic estimate for this. This would lead to double peaked rms spectra over a wider range of parameters.
We also explored the effect of an alternative variability pattern, driven by changes in rather than ionization. The effect of this (with constant ionization) is generally to change the depth of all the absorption features together. Thus the rms spectra produced by this variability mode are generally single-peaked.
2.2 Application to the data
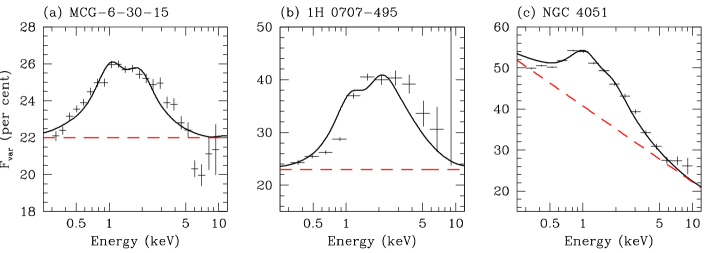
Encouraged by these results we have attempted to apply the models presented in Sec. 2.1 to observations of AGN. We have calculated variability spectra from XMM-Newton data of NGC 4051 (2001 May 16/17 observation), MCG–6-30-15 (2001 August 2/3) and 1H 0707–495 (2002 October 13/14). We used background subtracted light curves with 256-s resolution, accumulated from all available instruments (PN only for NGC 4051, both MOS and PN for MCG–6-30-15 and 1H 0707–495). We show these spectra as crosses in Fig. 4.
The rms spectra have rather broad peaks, indicating that models with contributions from both absorption systems may be favoured by the data. Accordingly, we have used the models where the variability is produced just from changes in the ionization parameter, as in Figs. 1 and 2. We assumed that this was driven by the power-law continuum variability (with spectral index of = 2.3), which produced an additional contribution to the rms. Normalization changes of the power law produce an energy-independent term (i.e. constant rms) to the variability spectrum (Gierliński & Zdziarski 2005). When adding power law and absorber variabilities, we assumed that they were correlated and therefore the total standard deviation was the sum of component standard deviations. We have not performed formal spectral fits, but only roughly matched the model to the data.
Such a composite model of the variability can describe the rms spectra seen from MCG–6-30-15 and 1H 0707–495, as shown by solid curves in Figs. 4(a) and (b). The dashed lines correspond to the energy-independent component due to varying power law. However, the variability spectra from NGC 4051 could not be described in this way. The spectrum shown in Fig. 4(c) appears to have the broad peak between 0.8–2 keV superimposed not on a constant rms background but on one which has more variability at lower energies. This background rms can be modelled by a power law which varies in both normalization and spectral index. We found that a power law pivoting about an energy of 160 keV (see also Uttley et al. 2004) added to the smeared absorber variability matches the data well (Fig. 4c). Such continuum variability has been seen in Galactic black holes in the low/hard spectral state (Gierliński & Zdziarski 2005).
Clearly, such a simple model can only be an approximation. The energy spectra of AGN are complex and require multiple additional components. For example, 1H 0707–495 shows a large drop in the energy spectrum above 7 keV (e.g. Fabian et al. 2004), which cannot be explained by a highly ionized () absorber in our model. This feature requires a more complex model of the velocity structure than the simple Gaussian smearing assumed here, if it arises from the absorber. Additional spectral components can also respond in some way to the changing X-ray illumination and add to the rms spectra. This may account for the features in the rms spectra not covered by our model. In particular, there is a dip in the rms around 7 keV in MCG–6-30-15, not covered by our model. This could be due to a reflected component which remains constant while the power law continuum varies (e.g. Vaughan & Fabian 2004). Similarly, a few rms spectra in the literature do not show the characteristic broad peak between 1–2 keV e.g. NGC 4051 (November 2002 observation; Ponti et al. 2006), NGC 4151 (Schurch & Warwick 2002) and I Zw 1 (Gallo et al. 2004c) show quite different rms spectra, with a sudden drop in rms below 2–3 keV. This kind of a variability spectrum cannot be reproduced by our simple variability model.
If ionization variability is driven by changes in the central source luminosity, then we expect the fractional variability amplitudes of ionization and luminosity to be similar. However, this only holds to within a factor 3. From the best-matching logarithm ionization variability, , we can find the corresponding ionization rms amplitude, = 25, 60 and 76 per cent, for MCG–6-30-15, 1H 0707–495 and NGC 4051, respectively. Our best estimate for the power-law variability (including the pivoting of the spectral index in NGC 4051) yields only about 22, 23 and 27 per cent variability in luminosity, respectively. It is difficult to quantify the statistical uncertainties in these numbers, but if the level of variability of the ionization and continuum are significantly different then this could indicate that the model rms spectra are somewhat distorted due to the assumed turbulent velocity (see Section 2.1). Another possibility is that there are other components (which are known to be present in the spectrum) contributing (or suppressing) the continuum variability.
The aim of this Letter is to demonstrate that the model in which changes in the smeared absorption driven be the changing continuum can match well typical energy-dependent variability. It neither can describe all the variability seen, nor it can account for all the components required in spectral fitting. Modelling the effect of these is beyond the scope of this short Letter, but we plan to include this in later work.
2.3 Properties of the smeared absorber
The smeared warm absorber model for the soft excess requires substantial columns (few to few tens of cm-2) with = 3.0–3.5 and substantial velocity shear (0.3 ) in order to fit typical AGN spectra (GD04; Chevallier et al. 2006; Schurch & Done in press; SD06). Here we have shown that similar parameters can also give an excellent description of the typical rms variability spectra seen from these objects. However, these parameters are quite extreme, so we examine the physical requirements in more detail.
Chevallier et al. (2006) show from the observed and that if the material is a wind then it must have very small volume filling factor, i.e. must consist of small dense clumps. Schurch & Done (in press) invert this argument to show instead that if the material has large filling factor then it is not a wind. Instead they suggest that it has a turbulent velocity structure where the material circulates (a failed wind) rather than escaping to infinity. Either of these situations might arise in the complex, high velocity accretion flow structures close to the central engine and base of the jet (e.g. Hawley & Krolik 2006). Assuming that the material is a few tens of Schwarzschild radii from a black hole of mass , accreting at half Eddington, the observed ionization parameter of erg cm s-1 requires that the density is of order M) cm-3 = cm-3 for a black hole of mass M⊙, respectively. Such high densities mean that the ionization state of the material will change very rapidly in response to changes in the continuum flux. There are no light travel time delays as the absorption is along the line of sight, so the ionization response to continuum changes occur on the recombination timescales of the absorber, (cm-3/) s for oviii (e.g. McHardy et al. 1995). The shortest continuum variability time-scales in these sources are all 1000–2000 s (comparable with the dynamical time scales in the innermost part of the disc) while the recombination timescale is only a fraction of a second.
Hence, the model requirement that the ionization state can change in response to the rapid continuum changes is consistent with the properties of the material already inferred from the spectral fits. Ionization changes are a necessary outcome of changing the illumination of such material. Partially ionized absorption with a large velocity shear can give a self-consistent explanation of both the energy spectra and rms variability spectra.
3 Conclusions
A crucial property of the soft X-ray excess in AGN is constancy of its temperature when modelled by a thermal component (Czerny et al. 2003; GD04; Crummy et al. 2005), which can be naturally explained if the excess originates from atomic processes. One particular scenario involves ionized smeared reflection (Crummy et al. 2006) from the accretion disc, which can successfully fit the X-ray spectra (e.g. Fabian et al. 2002b; Fabian et al. 2005). It has been shown recently that the same model can match the rms spectra as well (Ponti et al. 2006). An alternative solution requires relativistically smeared, partially ionized absorption (GD04). This model gives comparably good fits to the X-ray spectra (SD06). In this paper we show for the first time that the absorption model gives a very good description of the shape of the 0.3–10 keV rms spectra, assuming that the continuum variability drives correlated changes in the ionization parameter of the smeared absorption.
Acknowledgements
We thank Tim Kallman for help with xstar. MG and CD acknowledge support through a UK Particle Physics and Astronomy Research Council (PPARC) Postdoctoral Research Fellowship and Senior Fellowship, respectively.
References
- [\citeauthoryearBautista & Kallman2001] Bautista M. A., Kallman T. R., 2001, ApJS, 134, 139
- [\citeauthoryearChevallier et al.2006] Chevallier L., Collin S., Dumont A.-M., Czerny B., Mouchet M., Gonçalves A. C., Goosmann R., 2006, A&A, 449, 493
- [\citeauthoryearCrummy et al.2006] Crummy J., Fabian A. C., Gallo L., Ross R. R., 2006, MNRAS, 365, 1067
- [\citeauthoryearCzerny et al.2003] Czerny B., Nikołajuk M., Różańska A., Dumont A.-M., Loska Z., Zycki P. T., 2003, A&A, 412, 317
- [\citeauthoryearEdelson et al.2002] Edelson R., Turner T. J., Pounds K., Vaughan S., Markowitz A., Marshall H., Dobbie P., Warwick R., 2002, ApJ, 568, 610
- [\citeauthoryearFabian & Miniutti2005] Fabian A. C., Miniutti G., in Wiltshire D. L., Visser M., Scott S. M., eds, Kerr Spacetime: Rotating Black Holes in General Relativity. Cambridge Univ. Press, Cambridge, in press (astro-ph/0507409)
- [\citeauthoryearFabian et al.2002a] Fabian A. C., Ballantyne D. R., Merloni A., Vaughan S., Iwasawa K., Boller T., 2002a, MNRAS, 331, L35
- [\citeauthoryearFabian et al.2002b] Fabian A. C., et al., 2002b, MNRAS, 335, L1
- [\citeauthoryearFabian et al.2004] Fabian A. C., Miniutti G., Gallo L., Boller T., Tanaka Y., Vaughan S., Ross R. R., 2004, MNRAS, 353, 1071
- [\citeauthoryearFabian et al.2005] Fabian A. C., Miniutti G., Iwasawa K., Ross R. R., 2005, MNRAS, 361, 795
- [\citeauthoryearGallo et al.2004] Gallo L. C., Boller T., Tanaka Y., Fabian A. C., Brandt W. N., Welsh W. F., Anabuki N., Haba Y., 2004a, MNRAS, 347, 269
- [\citeauthoryearGallo et al.2004] Gallo L. C., Tanaka Y., Boller T., Fabian A. C., Vaughan S., Brandt W. N., 2004b, MNRAS, 353, 1064
- [\citeauthoryearGallo et al.2004] Gallo L. C., Boller T., Brandt W. N., Fabian A. C., Vaughan S., 2004c, A&A, 417, 29
- [\citeauthoryearGierliński & Done2004] Gierliński M., Done C., 2004, MNRAS, 349, L7 (GD04)
- [\citeauthoryearGierliński & Zdziarski2005] Gierliński M., Zdziarski A. A., 2005, MNRAS, 363, 1349
- [\citeauthoryearGreen, McHardy, & Done1999] Green A. R., McHardy I. M., Done C., 1999, MNRAS, 305, 309
- [\citeauthoryearGrupe et al.2004] Grupe D., Wills B. J., Leighly K. M., Meusinger H., 2004, AJ, 127, 156
- [\citeauthoryearHawley & Krolik2006] Hawley J. F., Krolik J. H., 2006, ApJ, 641, 103
- [\citeauthoryearInoue & Matsumoto2003] Inoue H., Matsumoto C., 2003, PASJ, 55, 625
- [\citeauthoryearKinkhabwala2003] Kinkhabwala A. A., 2003, PhDT
- [\citeauthoryearMcHardy et al.1995] McHardy I. M., Green A. R., Done C., Puchnarewicz E. M., Mason K. O., Branduardi-Raymont G., Jones M. H., 1995, MNRAS, 273, 549
- [\citeauthoryearMagdziarz et al.1998] Magdziarz P., Blaes O. M., Zdziarski A. A., Johnson W. N., Smith D. A., 1998, MNRAS, 301, 179
- [\citeauthoryearMarkowitz, Edelson, & Vaughan2003] Markowitz A., Edelson R., Vaughan S., 2003, ApJ, 598, 935
- [\citeauthoryearMiniutti & Fabian2004] Miniutti G., Fabian A. C., 2004, MNRAS, 349, 1435
- [\citeauthoryearMiniutti et al.2003] Miniutti G., Fabian A. C., Goyder R., Lasenby A. N., 2003, MNRAS, 344, L22
- [\citeauthoryearPonti et al.2004] Ponti G., Cappi M., Dadina M., Malaguti G., 2004, A&A, 417, 451
- [\citeauthoryearPonti et al.2006] Ponti G., Miniutti G., Cappi M., Maraschi L., Fabian A. C., Iwasawa K., 2006, MNRAS, 368, 903
- [\citeauthoryearSchurch & Warwick2002] Schurch N. J., Warwick R. S., 2002, MNRAS, 334, 811
- [] Schurch N. J., Done C., MNRAS, in press
- [\citeauthoryearTurner & Pounds1988] Turner T. J., Pounds K. A., 1988, MNRAS, 232, 463
- [\citeauthoryearUttley et al.2004] Uttley P., Taylor R. D., McHardy I. M., Page M. J., Mason K. O., Lamer G., Fruscione A., 2004, MNRAS, 347, 1345
- [\citeauthoryearVaughan & Fabian2004] Vaughan S., Fabian A. C., 2004, MNRAS, 348, 1415
- [\citeauthoryearVaughan et al.2003] Vaughan S., Edelson R., Warwick R. S., Uttley P., 2003, MNRAS, 345, 1271
- [\citeauthoryearWilms et al.2001] Wilms J., Reynolds C. S., Begelman M. C., Reeves J., Molendi S., Staubert R., Kendziorra E., 2001, MNRAS, 328, L27
- [\citeauthoryearYoung et al.2005] Young A. J., Lee J. C., Fabian A. C., Reynolds C. S., Gibson R. R., Canizares C. R., 2005, ApJ, 631, 733