Near-Infrared Adaptive Optics Imaging of QSO Host Galaxies
Abstract
We report near-infrared (primarily -band) adaptive optics (AO) imaging with the Gemini-N and Subaru Telescopes, of a representative sample of 32 nearby () QSOs selected from the Palomar-Green (PG) Bright Quasar Survey (BQS), in order to investigate the properties of the host galaxies. Two-dimensional modeling and visual inspection of the images shows that 36% of the hosts are ellipticals, 39% contain a prominent disk component, and 25% are of undetermined type. Thirty percent show obvious signs of disturbance. The mean (2.1 ), with a range 23.5 to 26.5 (0.63 to 10 ). At , all hosts have a dominant disk component, while at 2 most are ellipticals. “Disturbed” hosts are found at all , while “strongly disturbed” hosts appear to favor the more luminous hosts. Hosts with prominent disks have less luminous QSOs, while the most luminous QSOs are almost exclusively in ellipticals or in mergers (which presumably shortly will be ellipticals). At , where our sample is complete at -band, we find no clear correlation between and . However, at , the more luminous QSOs (), and 4/5 of the radio-loud QSOs, have the most luminous -band hosts (), most of which are ellipticals. Finally, we find a strong correlation between the “infrared-excess”, , of QSOs with host type and degree of disturbance. Disturbed and strongly disturbed hosts and hosts with dominant disks have twice that of non-disturbed and elliptical hosts, respectively. QSOs with “disturbed” and “strongly-disturbed” hosts are also found to have morphologies and mid/far-infrared colors that are similar to what is found for “warm” ultraluminous infrared galaxies, providing further evidence for a possible evolutionary connection between both classes of objects.
1 Introduction
It is now widely accepted that quasi-stellar objects (QSOs) are powered by accretion onto a massive black hole (MBH) within a galaxy. While MBHs are commonly found in galaxies, QSOs require the central black hole to be fed by a steady supply of matter. Characterization of the host galaxies of QSOs can provide important clues to understand both the formation mechanisms and the evolution of QSOs.
Observations of low-z QSOs offer the obvious advantage of increased resolution and sensitivity for accurately measuring host properties, and relatively large samples are required to both adequately probe the full range of host properties and to explore possible relationships between host type and properties of the QSO nucleus. The pioneering optical surveys of low-z QSOs in the mid 1980’s, using 4m-class telescopes (Hutchings, Crampton, & Campbell, 1984; Smith et al., 1986), produced several common themes, as well as enigmatic problems that still remain today. QSOs were found typically to live in luminous () hosts, with a mixture of host types (spirals, barred-spirals, ellipticals), including a significant fraction of disturbed and/or strongly-interacting systems. There was also some hint of a trend in host type with host luminosity, with spirals and luminous ellipticals favored at the low and high end, respectively, of the range of QSO luminosities. However, it often proved difficult to distinguish reliably between different host types, often due to poor sensitivity or angular resolution or both; in addition, the mixture of objects being observed was abnormally weighted toward radio-loud and/or X-ray selected objects despite these objects being only a small fraction of the predominant radio-quiet population. Optical QSO surveys with HST/WFPC2 (Bahcall et al., 1997; Boyce, Disney, & Bleaken, 1999; McLure et al., 1999; Hamilton et al., 2002; Dunlop et al., 2003) offered dramatically improved resolution, but for the most part contained similar biases toward radio-loud objects, resulting in a preponderance of ellipticals. In the end, results from the HST surveys did not significantly modify earlier conclusions based on the ground-based surveys.
More recent surveys of QSO hosts have favored the near-infrared, where the fraction of the observed light due to the underlying host galaxy is largest, and ground-based seeing can rival that from HST. Important large near-infrared QSO surveys include those from the ground with 2/4m-class telescopes (Dunlop et al., 1993; McLeod & Rieke, 1994a, b; Taylor et al., 1996; Percival et al., 2001) and, more recently, those exploiting adaptive optics (AO) (Márquez et al., 2001; Surace, Sanders, & Evans, 2001), and, finally, those using HST/NICMOS (McLeod & McLeod, 2001; Veilleux et al., 2005). Of most relevance to our own current work are the near-infrared observations by McLeod and co-workers who have imaged the host galaxies for a large volume-limited sample of optically-selected QSOs from the PGBQS similar to the sample and selection criteria we have used. Other near-infrared surveys of QSOs include studies with nearly equal mixtures of radio-quiet and radio-loud QSOs (e.g., Dunlop et al., 1993; Taylor et al., 1996; Márquez et al., 2001; Percival et al., 2001), and studies of “far-infrared-excess” QSOs (e.g. Surace, Sanders, & Evans, 2001; Veilleux et al., 2005). All of the near-infrared surveys generally agree with previous optical surveys in finding that QSOs typically reside in luminous (i.e., ) hosts, and that spirals represent an increasing fraction of hosts at lower QSO luminosities. However, the near-infrared surveys still emphasize the overall diversity of host types, and they are still plagued by difficulties with the accurate determination of radial profiles due to a combination of problems including bad seeing, unstable PSF, and ultimately the faintness of the hosts at large radii.
Finally, it has now become clear that optically-selected QSOs may be rivaled in their numbers by newly discovered populations of near-infrared selected (Cutri et al., 2002), and far-infrared selected (Low et al., 1988; Sanders et al., 1988) QSOs. It is extremely intriguing that a very high fraction (%) of the former show evidence of tidal interactions (Hutchings et al., 2003), and nearly all of the latter are found to be major mergers of large gas-rich galaxies (e.g., Sanders & Mirabel 1996). These new findings raise the obvious questions of possible evolutionary connections between these different classes of objects, all of which seem to be capable of producing luminous QSOs. It thus became clear to us that it might prove extremely useful to revisit the properties of optically-selected QSO hosts and to search for trends in host type with other properties such as far-infrared luminosity and color, which might then prove useful in future studies designed to explore possible connections between the familiar optically-selected QSO population and the various types of infrared-selected QSOs.
The availability of AO systems on 8–10 m class telescopes provides a potentially important new capability for accurately measuring the distribution of light in the host galaxy of QSOs. In particular, our access to relatively large amounts of observing time using the new University of Hawaii near-infrared AO system, Hokupa‘a, on Mauna Kea, allowed us to carefully design a sensitive and relatively uniform survey, primarily at H-band, of a large representative sample of low-z QSOs randomly selected from the optical (B-band) PGBQS. The sample was made large enough to include a representative sub-sample of the minority population of radio-loud objects, as well as to allow for adequate sampling of a wide range of QSO luminosities, but was otherwise unbiased. An additional bonus for our new observations was the existence by 2003 of relatively complete and accurate spectral-energy-distributions (SEDs) from radio-to-Xray wavelengths (Sanders et al., 1989; Elvis et al., 1994), including most importantly, new far-infrared fluxes for most of our targets, which were recently determined from reprocessed IRAS and ISO data (Haas et al., 2000, 2003).
In this paper we present the first near-infrared imaging study of a large number of QSOs (32 objects) made with AO systems on the Gemini 8.2m and Subaru 8.1m telescopes on Mauna Kea. We first describe, in §2 how our sample was selected. The observations and data reduction techniques are detailed in §3. The QSO host galaxies are characterized through 2-D fits and visual analysis of the images in §4. Section 4.4 presents our adopted classification scheme, including descriptions of the individual objects and comparisons to the host types derived from previous imaging studies, and summarizes the host fit parameters. Section 5 discusses how host type depends on other properties of the QSO (e.g. degree of disturbance, radio loudness, the near-infrared absolute luminosity of the host, and the total far-infrared luminosity), and compares our results with previous studies. Our main conclusions are summarized in §6.
As background to our current work, good brief reviews of previous problems and subtleties associated with interpreting the host types of low-z QSOs can be found in McLeod & Rieke (1994a) and Márquez et al. (2001). In addition, a more thorough review of the wide range of QSO host studies – their consensus and differences – including theories as to the origin and evolution of QSOs and their possible relation to other types of extragalactic objects, can be found in the proceedings of three recent workshops specifically devoted to the study of QSO hosts (Clements & Pérez-Fournon, 1997; Márquez et al., 2001; Barthel & Sanders, 2006).
2 Sample selection
The performance of AO systems is a strong function of the photon flux seen by the wavefront sensor (WFS). Although the Hokupa‘a (the Institute for Astronomy AO system (Graves et al., 1998) in use on the Gemini North Telescope from mid-2000 to mid-2002) and Subaru AO (Takami et al., 2004) systems can “lock” onto objects as faint as under good seeing, only very partial wavefront correction can be achieved for such faint objects. To ensure reasonably good image quality (FWHM), our sample was limited to bright QSOs (approximately ). This observational constraint would result in a strong bias towards intrinsically highly luminous QSOs if the sample were not redshift-limited. Moreover, observation of higher redshift QSOs is made more difficult for the purpose of this work by the decrease in spatial resolution, and especially surface brightness, with increasing distance. Our sample is hence limited to .
The ideal sample for our current observations proved to be the Palomar-Green Bright Quasar Sample (BQS: Schmidt & Green, 1983). Although there are more recent and larger QSO surveys, the BQS still contains the majority of the nearest and brightest optically-selected, UV-excess QSOs for study from the northern sky, and its magnitude limit was close to our desired brightness limit for good AO performance. There are also extensive multi-wavelength observations in the literature for the BQS sample, which potentially allows us to further explore the relationship of the QSO host properties to other properties of the QSO.
The BQS contains 92 QSOs with (in the cosmology used in Schmidt & Green, 1983), in the 10,714 deg2 surveyed region of the sky at and . Forty-seven of these QSOs met our final redshift and brightness selection criteria (, ), of which we were eventually able to observe 58% (28/47) during our two year observing campaign on Mauna Kea. These 28 QSOs from the BQS were essentially selected at random from the complete sub-sample of 47, depending only of the RA range observable during each observing run.
Four additional objects were eventually added to the list of 28, bringing the total number of observed targets to 32. Two objects from the BQS with (PG1119+120 and PG 1126-041) were successfully observed during one of the earliest observing runs, while we were still defining the scope of the overall AO campaign. Rather than discard the data, we decided to include these objects here for two reasons. First they allow us to further explore the low luminosity end of the QSO sample, and second, we noted early on that the uncertainties in the -band magnitudes listed in the original BQS are large enough such that these two objects might have properly been in our sample. Two additional objects were added to our observing list in the latter half of our overall campaign, when it was realized that we had only two “bona-fide” radio-loud QSOs (RLQs) in our list of observed objects. One of these RLQs, 4C31.63 (), was at the time it was added, the highest redshift object observed, but still within our planned redshift limit for the survey, and its -band magnitude was above the average overall threshold for the BQS. The second RLQ, PG2251+113 (), was above our stated redshift cutoff, but satisfied our -band limit and was the only RLQ from the BQS that could be observed at the RA range available for observations during 2001, September. The addition of these two RLQs allowed us to bring the total fraction of RLQs in our observed sample () up to the ratios more typically found (i.e., 15%) in large QSO surveys.
The complete list of our 32 observed targets is given in Table 1 (Vega magnitudes are used in this table and throughout this paper). The listed -band magnitudes have been updated where possible with newer more accurate values than originally given in Schmidt & Green (1983). The absolute magnitudes are also updated to an , cosmology: the QSO criteria used by Schmidt & Green (1983) now corresponds to . We note that the updated -band magnitudes resulted in three additional objects, PG0838+770, PG0844+349 and PG1229+204, falling below the absolute magnitude cutoff, bringing the total number of lower luminosity objects to five.
3 Observations and data reduction
3.1 Instruments
Both the Hokupa‘a AO system, built by the University of Hawaii and used on the Gemini North telescope, and the Subaru Telescope AO system, were used for this project. For both systems, a 36-element curvature sensor is used with a 36-element bimorph mirror. Curvature AO systems are traditionally very efficient on faint targets, partly thanks to the use of photon-counting devices (Avalanche Photo Diodes) with no readout noise. This allows these systems to guide on sources and to routinely provide good correction (better than 02) on point sources, which makes them well suited for QSO host galaxy imaging. The AO-corrected beam was fed to QUIRC for Gemini and to IRCS for Subaru. Both cameras use detectors for near-IR imaging.
3.2 Choice of filter and target
The contrast between the QSO and a typical host galaxy is better (lower) at about 1 m (in the rest frame) than either in the visible or the longer infrared wavelengths. This is largely due to a local minimum near 1 m in the rest-frame radio-to-Xray spectral energy distributions (SEDs) of nearly all QSOs, both RLQs and RQQs, except for the strongly beamed Blazars—e.g., Fig. 2 of Sanders et al. (1989), and also Fig. 1 of McLeod & Rieke (1995). Moreover, the performance of AO systems is optimal in the near infrared: at shorter wavelengths, the number of actuators is too small to sample the wavefront properly. At longer wavelengths, the high thermal background precludes the observation of low-surface-brightness sources, and the diffraction limit of the telescope restricts the achievable angular resolution. Observations in the near-IR are therefore well-suited for QSO host studies from the ground.
The seeing was constantly estimated during the observations by image quality monitoring and monitoring of the control signals of the AO system. Most of the observations were made using the filter, which provides the optimal resolution under good seeing conditions. When the seeing was bad (corrected FWHM in band larger than 02), the filter was preferred to the filter, and usually allowed high resolution imaging (FWHM) even under worse than average seeing, but at the expense of a stronger thermal background. A few observations were done in the band on exceptionally good nights. Fainter QSOs were preferentially observed under good seeing conditions, to avoid running out of bright targets when the seeing was average or worse than average. These precautions resulted in a surprisingly homogeneous set of images (angular resolution about 015) considering the wide range of seeing conditions and QSO magnitudes of the sample.
Table 2 gives the complete summary of our observing log for all of the data that are presented in this paper, including filter, exposure times, seeing (FWHM), and telescope used. Twenty-six objects were eventually observed at , and 8 of these 26 were also observed at either or , or both. Four objects were observed at only, one at only, and one at both and . Twenty-eight objects were observed at Gemini, and four objects were observed at the end of our campaign (Feb, 2003) using Subaru.
3.3 Reference PSF observations
For each target, a list of about six PSF candidates, all within a few arcminutes of the quasar, was prepared prior to observations. Each of those was briefly observed (without closing the AO loop) to test if it could, with the help of the WFS neutral density filter set, reproduce the WFS photon counts generated by the quasar. This allowed us to match the photon counts of the quasar to within 10% for most of the objects in our sample. The AO loop parameters (membrane stroke and loop gain) were not modified between observations of the target and the PSF.
For most of the targets, the PSF total integration time was much smaller than the QSO total integration time. Because of the variability of the PSF presented in §3.4, the residuals of the PSF subtraction are limited by effects that do not average well with time, and there is little gain in observing the PSF star for longer than a few minutes. However, long exposure times are required to record the faint structure of the host galaxy that are outside the central part of the PSF, where PSF subtraction is not essential (where the PSF wings are fainter than the host galaxy). When possible, the PSF star was observed with the same frame integration time as the QSO to use the PSF frames for sky extraction.
3.4 PSF stability—lessons learned
In this section, we characterize the PSFs delivered by Gemini+Hokupa‘a and the Subaru AO system and investigate their variability. This preliminary work is essential for attempting the characterization of the QSO hosts in our data.
The PSF delivered by an AO system is a function of :
-
•
1. Guide star V magnitude and color of the object imaged. The brightness of the star, as seen by the WFS, strongly affects the performance of the AO system. Due to the wavelength-dependence of the seeing (and the optics of the camera), PSFs are also expected to be color-dependant.
-
•
2. Atmospheric seeing. Under poor seeing conditions, the FWHM of the corrected PSF is larger. In addition, the brightness of the large halo surrounding the PSF core increases with the turbulence.
-
•
3. Instrumental variables. Wind-powered telescope shake, change in the optical path, and the primary and secondary mirror wavefront all modify the PSF.
-
•
4. AO loop parameters. Loop gain and membrane stroke (for curvature systems) set the speed of the AO loop and the optical gain of the WFS respectively, and therefore affect the PSF.
Despite efforts to match the brightness (as seen by the WFS) of the reference PSF and the QSO, small discrepancies in the two flux levels are unavoidable. More importantly, we found that the variations in seeing always limit the accuracy of the PSF subtraction when the flux of the PSF and the QSO are matched to better than 10%. Figure 1 shows how the radial profile of the PSF can change rapidly (timescale of about a minute) due to seeing variations. The far wings of the PSF (1″ to 2″ in Fig. 1) show how much light is scattered by small-scale turbulence (high spatial frequencies of the seeing), which is not corrected by the AO system. In this figure, it can be seen that these wings are much higher for PSF1 than for PSF2. Consequently, because the turbulence was stronger during the acquisition of PSF1, the AO correction is poorer and, inward of about 02 (dotted vertical line), the surface brightness of the PSF is lower. The “crossing point,” for which the loss of surface brightness due to the poor AO correction exactly equals the gain of surface brightness due to the increased scattering by small-scale turbulence, is set by the number of actuators of the AO system. The surface brightness at this crossing point is insensitive to seeing variations. Figure 1 also shows how the brightness of the PSF affects its radial profile: for brighter PSFs, the AO correction is better and flux is taken from an “intermediate” annulus between 01 and 03 and put into the central diffraction core of the PSF. The far wings of the PSF are left unchanged because of the limited number of actuators of the AO system. During real observation, a combination of PSF variations due to changing seeing and different source brightness will affect the radial profile.
Although the observer has no control over the seeing, it is possible to reduce PSF variations by avoiding any change in the instrument during observations. For example, the AO loop parameters should be kept constant. During this observing program, it was discovered that the PSF stability could be significantly improved by turning off the Cassegrain rotator of the Telescope. At the Gemini and Subaru telescopes, which have alt-azimuth mounts, the Cassegrain units carrying the AO systems are usually rotated to preserve the field orientation on the detector. The primary and secondary mirror create static wavefront aberrations. If these static aberrations are rotating in front of the AO system, which has preferential directions due to the geometry of the actuators and also introduces some higher order aberrations, the resulting rotational shear between the incoming wavefront and the aberrations of the AO system changes the structure of the PSF. This very complex PSF variation is difficult to predict since the individual sources of aberrations are poorly known. Figure 2 illustrates this effect through the comparison of two differenced PSFs, one for which the Cassegrain rotator angle was kept unchanged between the two exposures, and the other for which a 15∘ rotation occurred between the two exposures. Because some of the aberrations come from the primary and secondary mirror and some come from the AO system and the camera, a PSF obtained after rotation of the Cassegrain rotator cannot be reproduced by a rotation of a PSF obtained at a different Cassegrain rotator angle.
3.5 Decoupling of the PSF and the host galaxy
We have seen above that turning off the Cassegrain rotator makes the PSF more stable and therefore, improves the accuracy of the PSF subtraction. There is a second advantage to this technique: the PSF and the image of the host galaxy can be decoupled through differential rotation.
When attempting to detect faint structures very close to the QSO, we are usually very sensitive to small variations in the PSF structure, such as “flares” of the PSF. These “flares” are more frequent when observing faint targets such as QSOs, because the limited number of incoming photons doesn’t allow fast recovery from events such as a wind-induced telescope shake. It is possible to encounter such a flare on the object and not on the reference PSF, leading to the false detection of a structure in the host galaxy. Careful visual examination of individual frames can help detecting these artifacts but is not fully reliable. When observing with the Cassegrain rotator off, the PSF has a constant orientation on the detector while the object rotates, which unambiguously decouples the object from the PSF variations. For a “flare” to be misidentified as a structure in the host galaxy, it would need to rotate in the PSF at a speed reproducing the field rotation. Because we observed most objects continuously for more than an hour, the total rotation during the observation is usually sufficient to efficiently decouple the object from the PSF.
Because of the improved PSF stability when observing without the field derotator, most of our observations were done with the Cassegrain rotator turned off. The geographical coordinates of the telescope, the UT time of the exposure, the coordinates of the target and the angle of the Cassegrain rotator are required, for each exposure, to recover the field orientation.
This observing mode requires the exposure time to be short enough to avoid rotational smearing of the image. The limit we set on the rotational smearing corresponds to half a full width at half maximum (FWHM) at the edge of the detector when the target is at the center. This limit allows exposure times of 20 s to 30 s on most of the sky.
For some objects, detector saturation was reached in a few seconds. Because of the relatively long readout time of the camera (10 s) on Gemini/Hokupa‘a, we chose to obtain a series of short unsaturated exposures and a series of longer exposures which were essential to reach a good flux sensitivity. We were careful to obtain the longer exposures when the field rotation was slow.
3.6 Host galaxy characterization with AO images
AO PSFs are time-variable and have relatively strong and extended wings compared with Hubble Space Telescope (HST) PSFs, but the image of the underlying host is made sharp, which allows accurate retrieval of the radial profile in regions where the wings of the central PSF are not significantly brighter than the host galaxy. Depending on the objects of our sample, we find that it is possible to accurately recover the host radial profile outward of about 02 (for hosts which account for a large fraction of the total flux) to 2″ (for hosts which are much fainter than the central point source) with classical PSF subtraction techniques. This corresponds to about 0.5 kpc to 2 kpc for most of the objects in the sample. Thanks to the large collecting area of 8 m class telescopes, the host radial profile can usually be recovered to up to 5″ to 10″. Beyond this angular separation, the error due to imperfect sky subtraction becomes larger than the host: due to the small field of view of the images, the sky level cannot be accurately decoupled from the faint outer part of the host galaxy.
The good angular resolution (01 to 02, which is comparable to or better than that of HST at the same wavelength) and depth of QSO images obtained on a 8 m class telescope equipped with an AO system makes it possible to image small and faint structures in the host. This is very important for this project, which relies on the ability to characterize the morphology of the host beyond the disk vs. elliptical galaxy classification.
3.7 Image coaddition and PSF synthesis
For each target, the frames were processed and coadded by a data reduction pipeline written in C. Flat field and bad pixel maps were created from a set of dome flat exposures with increasing exposure time. The sky frame was obtained from the dithered QSO and nearby PSF exposures.
The persistence effect of the detector was corrected for by ignoring the pixels that have been recently strongly exposed to light. An empirical formula was used to select such pixels from the pixel value and the time of the exposure of the 10 preceding frames.
The first steps described above (flat fielding, bad pixel identification and sky subtraction) were applied to both the PSF and the QSO frames. For each QSO, a coadded image was generated by derotating each QSO frame before coaddition. As shown in Fig. 3, because of the combination of dithers, rotations and bad pixels masking (or pixels ignored due to the persistence of the detector), the total exposure time varies across the final image.
A reference PSF frame is obtained through coaddition of individual PSF frames, but without field derotation. To avoid increasing the noise of the PSF-subtracted image, the far wings of the PSF were replaced by synthetic PSF wings generated from a fit of the wings radial profile. The PSF image matching the coadded QSO image was obtained by coadding multiple copies of the reference PSF frame with the proper rotation angles and relative exposure times.
4 Analysis and Results
4.1 Images
Images are shown in figure LABEL:fig:qsoimages1 for each object of our sample. The flux in the raw images (left) is dominated by the bright central nucleus, although the host galaxy is usually visible without PSF subtraction, thanks to the good contrast and high angular resolution delivered by AO. The PSF-subtracted images (middle) reveal more host galaxy details, especially in the central part of the image.
The quality of the PSF subtraction is highly variable through the sample, and depends upon many factors (see §3.4). In some cases, the reference PSF used for subtraction is less peaked (and, therefore, has a comparatively brighter “halo” component) than the actual PSF during observation. If the host galaxy vs central nucleus luminosity ratio is low, the residual of the PSF subtraction is then negative in an annulus surrounding the positive residual at the center of the image (see §4.3 for a description of the 2-D analysis algorithm used to subtract the PSF): this effect can be seen on PG0026+129, PG0838+770, PG1411+442. PSF subtraction errors due to poor stability of the AO control also occur when the source is faint, the atmospheric turbulence is strong and/or clouds vary the source brightness during the observation. These effects are responsible for the poor PSF subtraction of PG0050+124, PG1116+215 and PG1302102. During the observation of PG1617+175, an avalanche photodiode of the AO wavefront sensor burned out, suddenly creating a bright extension in the PSF delivered by the system, as can be seen in the PSF subtracted image.
Many of the images also show artefacts due to sky subtraction residuals. These features are usually faint and beyond 5″ from the QSO. They are most visible in the images of PG0804+761 (curved feature 4″ North-West of the QSO and compact artefacts 10″ due East, North, West and South of the QSO), PG0838+770 (about 5″ to 7″ South of the QSO), PG0844+349 (straight edge and extended feature 6″ East of the QSO), PG0923+201 (straight feature running North-South about 5″ East of the QSO), PG1001+054 (faint extended fringes 5″ to 10″ South of the QSO), PG1119+120 (faint extended fringes mostly in 10″ South-West of the QSO), PG1307+085 (4 faint features in a 10″ square pattern centered on the QSO), PG1626+554 (wide 5″-radius arc centered in the QSO, mostly visible in the northern half of the image) and PG2214+139 (faint broad features in a 8″ square pattern centered on the QSO).
4.2 Photometry
The flux within a 55 diameter circular aperture centered on the QSO was measured for each object, with an accuracy of about 5% at the 1 confidence level. This aperture size allows easy comparison with previous measurements by Neugebauer et al. (1979) and Neugebauer et al. (1987). For the objects observed in non-photometric conditions, only a lower limit for this flux could be determined.
Table 3 compares our photometry with other measurements from the literature and from the 2MASS archive. No correction was applied to account for differences between the 2MASS and Mauna Kea photometric systems, as these two filters are very similar (Tokunaga et al., 2002).
The values shown in Table 3 are consistent with previous findings that show that many of the QSOs observed in this sample appear to show some variability in the near-infrared. The amplitude of variability shown in this table is in good agreement with Neugebauer et al. (1989): both sets of data identify PG1001+054, PG1426+015, PG1613+658, PG1617+175 and PG2130+099 as the most variable QSOs of our sample. Since the observations made under non-photometric conditions need to be calibrated with other photometric measurements of the same object, the variability of QSOs can cause errors in the estimate of the host galaxy luminosity. In order to minimize such errors, the time difference between our observations and the photometric measurement should be kept small. 2MASS measurements, rather than older measurements from Neugebauer et al. (1979) or Neugebauer et al. (1987), were therefore used for photometric calibration of objects for which no reliable photometry could be derived with our observations. In one case (PG1116+215), the lower limit obtained with our data is higher than the 2MASS measurement: this lower limit was then adopted for photometric calibration. We note that PG0050+124 was observed under very poor conditions: poor seeing and large absorption by clouds resulting in highly variable adaptive optics performance. We did not attempt to perform radial profile or analysis for this object, which explains why no photometry was adopted in Table 3.
4.3 Two-dimensional analysis of the hosts
The 2-D analysis relies on a least-square fitting of the image according the the following equation:
| (1) |
Pixels too close to (distance less than 1″ to 2″ depending on the QSOs), or too far from (more than 8″ to 10″) the center were excluded from the fit because PSF calibration errors dominate the host’s signal in the inner region of the image, and sky calibration is unreliable in the outer parts of the image (due to the small field of view of the detector). Rejecting the central part of the image in the fitting algorithm could allow solutions where the total flux of the image is not preserved: the PSF contribution could be increased to a point where its total flux exceeds the total flux in the raw image to fit the host galaxy beyond the inner edge of the fitting region. To avoid this effect, the total flux of the PSF component was not allowed to exceed the total flux in the raw image.
Bright companions, when present, were also excluded from the fit. The value of was directly measured on the image. This 2-D fit can have up to 9 free parameters: 1 for the intensity of the central source, 4 for the bulge component (modeled in this work as a single de-Vaucouleurs profile) and 4 for the disk component (modeled as an exponential profile). A simulated annealing minimization routine was used to find the absolute minimum.
The minimization routine was first run with the full 9 free parameters to yield , the minimum value of for a exponential + de Vaucouleurs profile host model. Then, ( host only) and (exp host only) were computed, with 5 free parameters in each case. The resulting reduced values for each of these three cases are listed in Table 4 for all of our targets. It is worth noting here that the noise component in equation 1 is often poorly characterized, due to the difficulty of estimating the temporal variations of the PSF wings. Thus the reduced values listed in Table 4 cannot be reliably compared between targets, but different fits obtained from the same image can still be compared to classify the host galaxies.
For each object, the 1-D radial profiles extracted from the 2-D image and the corresponding 2-D fit models (point nucleus + host model convolved by the PSF) are shown in Fig. 5 to LABEL:fig:qsofits11. The 1-D profile of the residual error, which is also shown in the same figures for the 3 fits, tends to become large at small angular distance from the center because of errors in the PSF subtraction. The domain within which the fit was performed is shown by 2 vertical red lines.
Due to the limited field of view of the instrument (20″), estimations of sky background level and the PSF are prone to errors beyond 8″ radius. This explains the peculiar behavior of some profiles beyond 8″ (for example, the abrupt drop at 10″ in the PSF profile for PG1440+356), and justifies our choice to exclude the outer part of the profile for host galaxy characterization.
4.4 Adopted host classifications
4.4.1 Classification scheme
In deciding which of the three -model fits listed in Table 4 best characterizes the host galaxy, the following criteria were used. Unless the 2-D fit strongly favors a 2-components bulge+disk host (i.e. if and no more than 70% of the total host flux is allocated to either the bulge or disk in this bulge+disk fit), the smallest of the and is adopted as the result of the 2-D fit. The adopted fits for each object and each filter used are listed in columns 2–4 of table 5.
However, in a number of cases, the difference in the values for the exponential vs. the de Vaucouleurs profile were small enough to render the choice of a particular host model somewhat meaningless. In the cases where , we consider the result of the fit to to favor one model, but with very low confidence (noted in parentheses in table 5). And in those cases where , or in the case of bad PSF subtraction, we consider the fit to be inconclusive (a question mark in table 5).
Since the overall QSO host classification scheme used in this work takes into account both the results of the 2-D -model analysis and morphological information visually extracted from the images, table 5 also lists information obtained from visual inspection of the host images, including the presence or absence of “Bars,” (spiral) ”Arms,” and the overall degree of “Dist(urbance),” respectively. Additional visual information is given in the Notes.
Each host was finally classified using a combination of information which included the best-fit -model “type” and the visual appearance. The final “Adopted Type” listed in col. 8 of table 5 was either “Dp” = Disk present, “E” = Elliptical, or “B+D” = Bulge+Disk, except for those objects with insufficient and/or ambiguous information from the -model fits, or objects with “strongly disturbed” disks, where a “?” was listed. We note here that since the 2-D fitting analysis does not include the central part of the image (due to PSF variability), the type “Disk present” does not exclude the presence of a bulge (which would be hidden in the central part of the image), and the “Disk present”/’“Bulge+Disk” distinction is therefore unclear. “Elliptical” and “Bulge” (in the Bulge+Disk type) refer to a for all 2-D fits performed in this work. Strongly disturbed hosts were not classified according to host type, since such a classification would be difficult and unreliable.
While the degree of disturbance is estimated purely from visual inspection of the images, the rules adopted for the host “adopted type” classification were as follows:
-
•
If a bar or spiral arms are obvious in the image, the host is classified as a “Disk present”, or a “Bulge+Disk” (the decision between “Disk present” and “Bulge+Disk” is made using the 2-D fitting analysis results).
-
•
If no spiral structure or bar is visible in the image, the host classification is given by the 2-D -model fitting analysis. If the host has been imaged in several spectral bands, and the corresponding 2-D -model fitting analysis do not agree, the fitting result obtained for the spectral band with the best PSF subtraction is adopted.
It is worth restating here that we have chosen to give priority to the features visible in the images rather than the results of the 2-D -model fits, primarily because the 2-D -model fits are prone to errors. It can be seen from the 1-D profiles in Fig. 5 to LABEL:fig:qsofits11 that for many objects, the 2-D fit does not produce a reliable results - we found that changing the fit domain often changes the result of the fit. Thus, it was reasoned that, for example, in several objects where a bar or spiral arms were clearly visible in the host images, the host should not be classified as an elliptical, even if the 2-D fit suggests so. It also should be noted that not all objects gave ambiguous results. Some objects are quite easy to classify, as the -model fit results are clear and agree with the images. But overall, the images show that the -model fits often give misleading results, and in 19% of the objects (6/32) the hosts are so disturbed that a -model fit is of little relevance.
4.4.2 Notes on individual objects
Before presenting the final fit parameters corresponding to the host “adopted type” listed in column 8 of Table 5, it is worth comparing our -model fit results and observed visual features with results from previous published studies of these objects. Each object is discussed separately in the paragraphs below, including comparisons with previous analyses by different authors and their published “host types,” and including remarks about the various difficulties encountered in our own analysis, which often led to ambiguities in the final choice of host type.
-
•
PG 0026+129 (catalog )
The image shows an obvious host, slightly elongated east-west, with no apparent structure. The radial profile analysis fails to identify clearly the galaxy type, but gives host magnitudes ranging from (bulge+disk fit) to (disk fit), and nucleus magnitudes ranging from to . Although our image does not allow classification of this host, the HST/NICMOS observations of McLeod & McLeod (2001) suggest that it has an -law profile. A non-stellar apparent companion is visible 4.8″ from the central nucleus (, ). -
•
PG 0050+124 (catalog )
This object is also known as I Zw 1 and is often classified as a Seyfert galaxy, particularly since the host shows clear spiral arms (Bothun et al., 1984; Surace et al., 1998; Zheng et al., 1999; Canalizo & Stockton, 2001). In our observations, the spiral arms are visible in the host galaxy across the field of the detector (20″). Although the observing conditions for this object were poor (making it impossible to perform an efficient PSF subtraction or photometry), the morphology is unambiguously that of a spiral host. Canalizo & Stockton (2001) have found spectroscopic evidence for continuing star formation in the disk as well as morphological evidence for weak interaction with the small companion to the west. Scoville et al. (2003) find a mass in molecular gas of M⊙, and recent observations with the BIMA interferometer (Staguhn et al., 2004) resolve individual giant molecular clouds in a ring structure from about 1.2 to 3.5 kpc from the nucleus. -
•
PG 0157+001 (catalog )
The host galaxy of PG 0157+001 (= MRK 1014) is large and bright, and it shows 2 prominent spiral-like features that extend from kpc to at least 28 kpc (limited by the edge of the detector, 10″ from the nucleus), as well as a bright bulge. This galaxy has been the subject of numerous ground-based and HST imaging studies (e.g., MacKenty & Stockton 1984; Stockton & MacKenty 1987; Hutchings & Crampton 1990; Surace et al. 1998; McLeod et al. 1999; Canalizo & Stockton 2000). The spiral features are clearly not conventional spiral arms (see Fig. 2 of Canalizo & Stockton 2000); instead, as many of the previous studies have emphasized, they are almost certainly tidal tails generated in a past major merger. These tails provide strong evidence that both of the merging galaxies themselves had cold stellar disks. The host galaxy is highly asymmetric, with the northern tail brighter than the southern tail. Several bright knots can be seen in the northern tail, which are also clearly seen in HST images (e.g., McLeod et al. 1999). A small, bright companion is visible to the south-west at a projected distance of about 25 kpc. The host is well fitted as a bulge+disk galaxy with a central nucleus, which is compatible with the structure seen in the image. Canalizo & Stockton (2000) confirm the presence of significant populations of young stars, particularly along the leading edge of the northern tail. -
•
PG 0804+761 (catalog )
This host is best described as a “bar” about 5 kpc in radius. An extended (kpc size) faint companion is visible to the East of the QSO, at a projected distance of 4 kpc from the QSO. The curved structure visible in the image about 8″ to the North-West of the QSO is a artifact from the camera. No reliable 2-D fit was found for this galaxy in , and the fit in suggests an elliptical galaxy. However, the bar indicates that this galaxy contains a prominent disk. The only previous published imaging study of this object is that of McLeod & Rieke (1994a), who found a profile consistent with a disk galaxy from their ground-based -band imaging. Scoville et al. (2003) detect molecular gas mass of about M⊙ in this galaxy. -
•
PG 0838+770 (catalog )
The central part of the host of PG0838+770 is a 9 kpc radius bar. A noticeable twist of this bar is seen in our image, and a 20 kpc long arm is starting from the East end of the bar. This arm seems to connect both ends of the bar, thus forming the northern half of a ring immediately surrounding the bar. Visible images (Surace, Sanders, & Evans, 2001) show both the bar and two spiral arms outside the ring. An extended (about 2.5 kpc diameter) apparent companion is also visible to the northwest at a projected distance of 12 kpc. Although the host is best fitted by a law, the bar and spiral arms show that a substantial disk is present. -
•
PG 0844+349 (catalog )
Two symmetric spiral arms are clearly visible, extending to about 9 kpc radius in our image. Hutchings & Crampton (1990) describe the host as a “barred spiral, with some complex outer structure.” Our 2-D fit, which suggests a dominant bulge, is uncertain because of poor PSF subtraction. -
•
PG 0923+201 (catalog )
Although some previous studies have listed this object as interacting (McLeod & Rieke, 1994b) or possibly interacting (Hutchings, Janson, & Neff, 1989), apparently because of the bright galaxy projected to the south, the host is unambiguously a very symmetric elliptical. It has an apparent extended companion at a projected distance of 7 kpc (22) almost due north. This host was also identified as an elliptical from HST/WFPC2 observations (McLeod et al., 1999). The 2-D fit shows that the host galaxy (, ) has a low ellipticity (about 0.1), and the central nucleus is about 1 magnitude brighter than the galaxy. -
•
PG 0953+414 (catalog )
This host was identified as a spiral from ground-based imaging by Hutchings, Janson, & Neff (1989); however, all subsequent imaging studies, including HST/WFPC2 observations of Bahcall et al. (1997) and McLeod et al. (1999), have found the host too faint to classify reliably. This is also true for our data. The brightest part of the host is visible as a faint extension to the south of the QSO in our image. McLeod et al. (1999) find marginal evidence favoring an elliptical profile, but they also claim a possible tidal arm to the southwest, which would indicate the presence of a disk. -
•
PG 1001+054 (catalog )
Our image shows a highly elongated host (long axis radius of 4 kpc) which is probably a bar but could also be a small inclined disk. The 2-D fit suggests an elliptical galaxy, but we choose to classify the host as a “disk present” from visual inspection of the image. Surace, Sanders, & Evans (2001) see only a small, uniform host from ground-based optical and near-IR imaging. -
•
PG 1004+130 (catalog )
The quasar, also known as 4C 13.41 and PKS 1004+13, is a powerful steep-spectrum radio source. The host galaxy is large, bright and smooth, and is shown to be an elliptical by the 2-D fit. Bahcall et al. (1997) also classify the host as a bright elliptical from HST/WFPC2 imaging. -
•
PG 1116+215 (catalog )
The PSF subtraction is poor for this object. Nevertheless, the host appears to be asymmetric, with several companions: a compact companion at a projected distance of about 4 kpc to the west, a faint extended (2 kpc diameter) companion at 5.5 kpc projected distance to the south, a compact companion (star?) at 12.7 kpc to the south-southwest, and an elongated bright galaxy at 33 kpc to the West (outside the field of view of the image shown in Fig. 5). The 2-D fit to the host suggests that it is a disk, although there is considerable uncertainty in the determination. Bahcall et al. (1997) list the host as “probably an elliptical.” -
•
PG 1119+120 (catalog )
The host is bright and smooth, with a north-south elongation. An elongated companion is visible 2.6 kpc (27) to the north, projected on the host galaxy. Optical images (Surace, Sanders, & Evans, 2001) show 2 faint extended rings on the east and west sides of the brightest part of the host. These features are too faint to be detected in our Near-IR images. Our 2-D fitting gives a bulge+disk decomposition and shows that the host galaxy is almost a magnitude brighter than the central nucleus. -
•
PG 1126041 (catalog )
Our image shows a bright and large host with spiral arms extending beyond 10 kpc. The 2-D fit suggests the presence of a bulge of luminosity comparable to the disk component. A bright apparent companion, at a projected distance of 6.6 kpc (57), is clearly resolved and shows a small elongation. -
•
PG 1211+143 (catalog )
This host is too faint to be classified in this work. Taylor et al. (1996) have concluded from their ground-based -band imaging that the host is dominated by a disk. -
•
PG 1229+204 (catalog )
This host was identified as a spiral from ground-based visible observations (Hutchings & Neff, 1992) and HST/WFPC2 observations (Hamilton et al., 2002). Our observations show a prominent bar (radius is 5 kpc), with faint spiral arms starting from their ends. The result of the 2-D fit is a bulge+disk model about one magnitude brighter than the central nucleus. We classify this host as a “disk present” because of the structures visible in our image. -
•
PG 1302102 (catalog )
The quasar is a strong flat-spectrum radio source. Two compact, but resolved, bright companions are within 10 kpc of the QSO. Although decoupling the closer companion and the host in the 2-D fitting analysis is difficult, visual inspection of the image suggests that the host of PG 1302-102 may be a somewhat asymmetrical elliptical galaxy. The 2-D fit favors a model about 1.5 magnitudes fainter than the central nucleus, which we adopt for the classification of this host. Bahcall et al. (1997) and Hamilton et al. (2002) (working from the same HST/WFPC2 image) both suggest an elliptical host. -
•
PG 1307+085 (catalog )
Our image shows a smooth symmetrical host with no apparent structure, and the 2-D fit shows that it is an elliptical galaxy with no detectable elongation. Analysis of HST/WFPC2 images gives a similar result (Bahcall et al., 1997; Hamilton et al., 2002). The four small ojects at the corners of a perfect 10″ by 10″ square centered on the QSO are sky subtraction artefacts. -
•
PG 1309+355 (catalog )
This host is smooth, symmetric and moderately elongated in the North-South direction. Although it has been described as an early-type spiral from HST/WFPC2 observations (Bahcall et al., 1997; Hamilton et al., 2002), our 2-D fit favors an elliptical host. HST observations also give a closely -law profile, but pick up weak but definite spiral features, which are not seen in our image probably because of the longer wavelength. Classification for this host is therefore somewhat uncertain, although we adopt the “Elliptical” classification for consistency with the criteria adopted for the rest of our sample. -
•
PG 1351+640 (catalog )
Our image shows a large smooth host, slightly elongated in the north-south axis. Ground-based observations in the visible show a smooth host, best fitted as an elliptical (Hutchings & Neff, 1992). Our 2-D analysis does not allow classification of this galaxy. Deep optical imaging (Surace, Sanders, & Evans, 2001) shows an faint extension of the host to the west. This feature is marginally detected in our image, and appears as a subtle light excess about 5″ west of the QSO. -
•
PG 1411+442 (catalog )
Highly disturbed host, with a bright elongated companion at a projected distance of 3.6 kpc (21). Three long tidal arms or loops are visible in our image. This host had previously been classified as a spiral (Hutchings & Neff, 1992). Deep optical images (Surace, Sanders, & Evans, 2001) show that the tidal features extend out to at least 30 kpc. Our 2-D fit does not allow classification of this host, and gives different answers in different bands. We therefore classify this object as highly disturbed. -
•
PG 1426+015 (catalog )
Strongly disturbed host, with a bright companion at a projected distance of 4.1 kpc (25). The host galaxy is asymmetrical: its south-west side is brighter and shows tidal features. Our 2-D fit favors an elliptical host, but the apparent tidal features lead us to classify this object as strongly disturbed. -
•
PG 1435067 (catalog )
Our image shows a smooth host galaxy. The northern half of the host is slightly brighter than the southern half at a radius of about 2 kpc. A companion is resolved (about 2 kpc diameter) at a projected distance of 10.8 kpc (48) to the west. Our 2-D fit suggests an elliptical, which we adopt for the host classification. -
•
PG 1440+356 (catalog )
Two symmetric spiral arms are visible in this host, without any obvious evidence of disturbance. The 2-D fit for this object is of poor quality, and its result (high surface brightness disk galaxy of small size) is probably driven by a mismatch in the PSF or the background sky level. Surace et al. (1998) classify the host as a spiral with a bar. -
•
PG 1613+658 (catalog )
This bright host galaxy shows a very complex structure, with prominent tidal arms and a bright resolved apparent companion projected 5.1 kpc (22) west of the QSO. This structure was first reported by Hutchings & Neff (1992). Similar structure is shown by an HST/NICMOS image (McLeod & McLeod, 2001). Deep optical images (Surace, Sanders, & Evans, 2001) show tidal arms extending out to 35″. -
•
PG 1617+175 (catalog )
The PSF subtraction is poor because of an APD failure in the AO system. Our image shows a smooth host and the apparent asymmetry in the image is most likely due to PSF subtraction residuals. An elliptical host is favored by the 2-D analysis, and adopted for host classification. Due to the poor quality of the PSF subtraction, this classification might not be reliable. -
•
PG 1626+554 (catalog )
Smooth host. The 2-D analysis suggests an elliptical host, but the reference PSF for this object is not very good, and the host classification might not be reliable. The rings visible in the residual wide-field image of Fig. LABEL:fig:qsoimages1g might be due to sky subtraction residuals. -
•
PG 1700+518 (catalog )
Highly disturbed host, with an interacting companion 7 kpc (16) north of the QSO. A tidal arc, especially bright in the north and west, is associated with the companion. Several bright knots are visible within this tidal feature. Fainter extended features to the south-west and south-east of the QSO are visible in our image. Despite the high quality of our data, no reliable classification is obtained by our 2-D fit for this highly disturbed object. Stockton, Canalizo, & Close (1998) obtained imaging with an earlier version of the Hokupa‘a AO system at the Canada-France-Hawaii telescope, detecting the companion and its arc. They also found spectroscopic evidence for a young (85 Myr) stellar population in the companion. Hines et al. (1999), from their HST/NICMOS imaging of this object, suggest that the companion is a ring galaxy, produced by a small-impact-parameter collision. -
•
PG 2130+099 (catalog )
This spiral host shows two symmetric, high-contrast spiral arms extending out to at least 65 from the QSO. A non-stellar apparent companion is visible 9″ to the east-southeast of the QSO. These features are also seen in ground-based and HST/WFPC2 optical imaging (Hutchings & Neff, 1992; Surace et al., 1998), which also show evidence for a central bulge. Strangely, Taylor et al. (1996) classify this object as an elliptical, although with marginal confidence. Despite the poor PSF subtraction in our image of this object, the 2-D fit correctly identifies this host contains a prominent disk. There is a good match between the fit parameters obtained in the and images, both indicating that the host is almost 2 magnitudes fainter (, ) than the central nucleus. -
•
4C 31.63 (catalog )
As the name indicates, this quasar is a strong radio source. The host is smooth and elongated, with 3 small apparent companions (projected distances are 11 kpc (25), 12 kpc (28) and 20 kpc (47)) within 5″ of the QSO. The companion 12 kpc to the South is of stellar appearance. Our image suggests that, in the central part of the host (at about 2″ from the QSO), the southeast side of the galaxy is brighter than the northwest side. However, the effect is subtle and may be due to a PSF artifact; we therefore have chosen to classify this host as undisturbed. The 2-D analysis suggests that the host is an elliptical. The classification by Taylor et al. (1996) is ambiguous, whereas Hamilton et al. (2002) classify the host as an elliptical from an HST/WFPC2 image. Spectroscopy of the host (Miller & Sheinis, 2002) also support classification as an elliptical galaxy. -
•
PG 2214+139 (catalog )
This host has a very peculiar radial profile, although the 2-D analysis suggests that it is an elliptical. Sharp concentric rings surround the the central QSO at radii ranging from 2.5 kpc to 5 kpc, and are especially obvious in the north-west part of the host. These shells are probably tidal debris from a recent merger. -
•
PG 2251+113 (catalog )
The quasar is a 4C and Parkes radio source. The smooth host is moderately elongated in the east-west direction, and it has a non-stellar apparent companion 43 to the North. The 2-D analysis shows a slight preference for a disk, but the classification is to be considered somewhat unreliable due to poor PSF subtraction. It would be quite unusual for a radio source of this power to have a host dominated by a disk, and Hutchings & Neff (1992) report an profile for it. -
•
PG 2349014 (catalog )
This highly disturbed host shows 3 tidal arms and a close companion at 5 kpc (17) projected distance. The small companion is composed of a bright compact nucleus and two fainter knots about 03 on either side of it, to the East and West. Spectroscopy (Miller & Sheinis, 2002) has confirmed that the companion and QSO redshifts match. This host was identified as a elliptical undergoing strong interaction from HST/WFPC2 observations (Bahcall et al., 1997), which is in agreement with our 2-D fit and our image. Due to the features visible in our image, we chose to classify this host as strongly disturbed. The quasar itself is a strong Parkes radio source.
4.4.3 Fit parameters for adopted host type
Table 6 lists the value of the -model fit parameters (for the “adopted host” type listed in col. 8 of table 5) according for the following host decomposition :
| (2) |
where
| (3) |
For all objects, we verified that the minimization algorithm gives results independent of the starting point, and that is smaller than and . For “E” and “Dp” types in col. 8 of table 5 only the first or second term, respectively, on the right-hand side of equation 2 is relevant, while for type “B+D” all 9 parameters are used in the fit. When the host classification is uncertain (“?” in col. 8 of table 5), the 9 parameters of the bulge+disk fit decompositions are listed in Table 6.
5 Discussion
The results presented in the previous section illustrate both the overall success of our survey in being able to detect the great majority of the host galaxies of nearby PGQSOs, as well as the difficulties encountered when attempting to fit model radial surface brightness profiles to individual hosts. The two year timeframe of the survey provided sufficient opportunity to revisit objects where the initial data had been compromised by poor seeing and/or problems with the stability of the PSF. In the end we were able to reliably detect the host galaxies in all but four of our targets (28/32), with sufficient signal-to-noise to allow fitting of the radial surface brightness profiles out to radii typically 10 kpc – a tribute in large part to the light gathering power of 8-m telescopes. However, despite extreme attention to detail, the stability of the PSF was still a limiting factor in preventing accurate subtraction of the central point source, thus compromising our ability to determine the host light profile a radii 1-3 kpc, thus making the fit result rather sensitive to the choice of inner radius limit. Our model fits also proved to be somewhat sensitive to the exact choice of outer radius limit, thus in the end our refusal to use -fits alone, and our attempt to give at least equal weight to visual inspection of the images, in the final determination of “host type”. Despite these caveats, there are still several important statistical results and trends that clearly emerge from the data.
5.1 Classification statistics—host types and absolute magnitudes
Twenty-eight of our 32 objects had detected hosts for which we attempted make a classification, and we discuss the distribution of “host type” and host absolute magnitude for these 28 objects below. The remaining 4 objects were not classified due either to having hosts which were too faint or having data which suffered from a bad PSF (see footnote to Table 7). Table 7 summarizes the number of objects and their mean H-band absolute magnitudes for each “host type” – “E”, “Dp”, “B+D” – as well as for those objects where a “host type” could not be reliably determined (i.e. “Unknown”), and also by “degree of disturbance” – “Non-disturbed”, “Disturbed”, “Strongly disturbed”. These classifications follow the category listings as used in column “Dist.” and column “Adopted type”, respectively of Table 5.
The percentage distributions of “host type” and the relationship between “degree of disturbance” and the “host type” can be seen from the graph in Fig. 6. It is immediately apparent that the hosts of the sample of PGQSOs in our survey are not characterized by a single dominant type. For the subsample of 19 objects with classified host type (“E”, “Dp”, “B+D” in table 5), there appears to be an almost equal split between objects with no detected disk component (“E”) and objects with detected disks (“Dp” and “B+D”). It is also apparent that a significant fraction, (9/28 = 30%), of the hosts of PGQSOs show clear signs of disturbance and/or are strongly disturbed. If we then make the reasonable assumption that the “disturbed”, and even more likely the “strongly disturbed”, hosts also have a disk component, then the percentage of objects with a detectable disk component could be as large as 57% (16/28) to 68% (19/28).
Table 7 also lists the median and average values, and the 1 uncertainty in the average for both the host and nucleus, for the total sample (28 objects) and for each “host type” subsample. These values have been computed directly from the adopted fits for each object as listed previously in Table 6. The median and mean host magnitudes typically differ by less than 0.3 mag, with no obvious systematic offset. In what follows we will use the mean values to characterize the properties of the total sample and the “host type” subsamples.
For our entire sample (28), the mean host absolute -band magnitude is , which is equivalent to [assuming 333Derived by adopting the mean observed value of for the hosts and an observed value of from Mobasher, Sharples & Ellis (1993), corrected for our assumed value of km s-1Mpc-1.]. Our value of for the mean host luminosity is almost identical to the values of and 2.3 found respectively by McLeod & Rieke (1994b), and Surace, Sanders, & Evans (2001) from their earlier ground-based observations of samples of QSOs selected from the same BQS sample of PGQSOs, and using the same redshift cutoff as our current sample. The latter study also finds a range of 0.5–7.5 for the host galaxies, very similar to our measured range of 0.63–10.0 .
Mean -band host magnitudes and luminosities for samples of PGQSOs at , and for quasars in general, are not that abundant in the literature, but the few reported measurements all seem to fall generally in the range 1–3 , with the lower value being found for low-luminosity QSOs and the higher value being found for more luminous QSOs (e.g., McLeod & Rieke 1994a, b; McLeod & McLeod 2001). It is interesting to note that this range of host is nearly identical to the range in the average found for our different “host type” sub-samples. Table 7 shows that the lowest mean value— ()—is found for hosts of type Dp, i.e., hosts which have a dominant disk component, while the mean value for the ellipticals (type E) in our sample is (). The similarity in range and mean H-band luminosities for different host type with previous mean values versus QSO luminosity could be explained, for example, if there were a clear correlation of host type with QSO luminosity, and indeed we do see such a correlation, as discussed below.
5.2 Host properties vs. QSO luminosity
A more complete representation of the range of properties of our sample of PGQSOs is given by the data shown in both Fig. 7 and Fig. 8. The color coding and shading of the symbols used to represent the individual objects is the same in each of the figure panels, and provides an aid to easily see the mean and range of host and nuclear properties for objects with different host type and degree of disturbance.
Figure 7 (top panel) clearly shows a distinct change in host type with increasing of the host. Hosts with dominant disk components (i.e. “Dp”) are preferentially clustered at the low end (i.e., sub- to ) of the observed range, whereas E-type hosts dominate at above-. Objects which have both a relatively large bulge component and a detectable disk (i.e “B+D”) are distributed more like E-type hosts, although the relatively small number (3) of “B+D” hosts limits our ability to say much more, other than that the they cluster near . In general, Fig. 7 (top panel), shows that disturbed and strongly disturbed hosts are found at all values of host , although there seems to be a tendency for the strongly disturbed hosts to be found at the upper end of our observed range of . Finally, we comment on the apparent bimodal distribution of host in figure 7, simply by noting that with just a relatively small shift in the computed host for a few objects, this could just as easily be a single distribution with a high luminosity tail.
Figure 7 (bottom panel) also shows a change in the distribution of host type with increasing of the QSO, similar to what is seen with increasing host (top panel)—E-type hosts dominate at while at hosts with prominent disks (“Dp” and “B+D”) appear to become an increasing dominant fraction of all objects with decreasing B-band luminosity of the QSO.
Several earlier imaging studies of low-redshift QSOs (i.e., ) have also commented on the fact that lower luminosity QSOs appear to have a larger fraction of hosts with a distinguishable disk component, while high luminosity QSOs seem to reside primarily in elliptical hosts. The collective series of papers by McLeod and coworkers (McLeod & Rieke, 1994a, b, 1995; McLeod & McLeod, 2001) used both ground-based and HST near-infrared imaging data of a PG sample that is most similar to ours to conclude that high luminosity QSOs seem to predominantly live in elliptical hosts while the host types of low-luminosity QSOs are more likely to show evidence for disks. Independently, Dunlop and coworkers (Taylor et al., 1996; McLure et al., 1999; Dunlop et al., 2003), using a combination of ground and space-based, near-infrared and optical imaging data for a mostly different sample of QSOs, reached generally similar conclusions when they emphasized the almost exclusive presence of elliptical hosts for the higher luminosity QSO in their sample, while also pointing out the increasing number of disks found in the hosts of the lower-luminosity, radio-quiet QSO in their sample. And recently, Hamilton et al. (2002) provided a comprehensive summary of their HST archival study of 71 QSO host galaxies with WFPC2 images in F606W or redder filters, which concluded that “elliptical hosts are typically twice as luminous as spiral hosts”, although they also noted that the luminosity distributions of elliptical and spiral hosts for the radio-quiet QSOs were “generally compatible”.
A more comprehensive presentation of our data is given in Fig. 8, which shows the relationship of the computed 2-D fit value of (column 5 of Table 6) and the observed (column 5 of Table 1) for each QSO, along with the symbol for host type, the measured redshift and an indicator for radio loudness (“RLQ”). In addition to showing the trends of host type versus and discussed above, Fig. 8 also shows how the ratio of these two quantities (which was summarized by host type in cols. 9-11 of Table 7) varies over the sample.
One interesting question is whether there is any evidence for a correlation between QSO luminosity and the luminosity of the host galaxy. The results shown in Fig. 8 suggest not, at least for hosts with (i.e. 0.6 - 4 (host)); if anything, the mean ratio versus (host), in this range of (host), seems to decrease with increasing (host), but this result is not significant because of small number statistics. However, we also note that that all of our objects with are at , and the stated -band limit () of the BQS (Schmidt & Green, 1983) implies that we should still be complete out to this redshift for QSOs with . For hosts with , Fig. 8 does seem to imply that they produce more luminous QSOs. However, this result is clearly compromised by incompleteness due to the -band limit of the BQS; all of the sources with lie at redshift , which excludes detection of QSOs with .
As was pointed out by the referee, what does seem to be significant from Fig. 8 is that even the most luminous galaxies with disks do not seem to harbor really luminous QSOs. It would seem that it may be necessary to have a merger violent enough to completely destroy the disks of the progenitor galaxies to produce the most luminous QSOs.
5.3 Radio-Loud vs. Radio Quiet hosts
The number of radio-loud quasars (RLQs) in our sample is relatively small (5/28 = 18%), but it is representative of the fraction found in previous studies of large samples of QSOs, which show that RLQs are only 15% of the total population of optically-selected QSOs. Although we did not specifically distinguish RLQs and RQQs when computing mean host -band luminosities for different “host types” in Table 7, the RLQ hosts are explicitly identified in Fig. 6–8. It is immediately obvious that RLQs live in the most luminous QSOs (i.e., ) with the most luminous hosts (i.e., corresponding to ). These facts, coupled with our previously discussed trends of host type with QSO -band and host -band luminosity, are consistent with previous published results which claim that RLQs are typically 1-2 mags more luminous than RQQs in the optical, and that RLQs are exclusively found in elliptical hosts, which in turn are usually much more luminous—typically 1-2 magnitudes, depending on whether the observations are in the optical or near-infrared, respectively—than the mean values found for the hosts of RQQs (e.g., Hutchings, Crampton, & Campbell 1984; Smith et al. 1986; McLure et al. 1999; Hamilton et al. 2002; Dunlop et al. 2003).
Although the origin of the observed dichotomy in the mean properties of RLQ and RQQ hosts is somewhat beyond the scope of our current study, it is nevertheless worth restating the obvious – that QSO surveys biased toward radio-selected objects will necessarily find more luminous, elliptical hosts when compared with pure optically selected samples of QSOs.
5.4 Degree of disturbance of host galaxy
One of the expected strengths of AO observations of QSOs using 8m telescopes was the ability to better characterize the “host type”, and in addition to detect faint extended structure in the host which may have escaped detection in previous imaging observations with smaller telescopes. Although the majority of our host classifications are in general agreement with previous results (see §4.4.2), our images were more likely to allow us to distinguish asymmetric features (e.g. putative tidal debris, central bars, etc.) from, for example, more symmetric spiral structure, and to better separate out compact, circumnuclear structures from the bright QSO nucleus. We note that since we rely on morphological features such as tidal arms to classify hosts as “not disturbed”, “disturbed” or “strongly disturbed”, this classification is relatively insensitive to usually very symmetrical PSF subtraction residuals. For example, the host type of PG 1626+554 and PG 2251+113 are unknown due to poor PSF subtraction, but the smooth host images obtained lead us to classify them as “not disturbed”.
According to our analysis, 30% (9/30) of the classified QSO hosts were categorized as being “disturbed” or “strongly disturbed” in Table 5. The 6 hosts classified as “strongly disturbed” show asymmetric features reminiscent of tidal structure, as might be due, for example, to the advanced merger of two spiral disks. Putative “tidal arms” are clearly seen in PG0157+001, PG 1411+442, PG 1613+658, PG 1700+518 and PG 2349014, while PG 1426+215 has a clearly asymmetric disk. The three additional objects listed as “disturbed” generally show fainter asymmetric features, (plausibly faint tidal debris) whose effect on the 1-D radial profile is small enough to still allow us to distinguish between different host types. The 4 “disturbed” hosts include two “Dp” and one “E”.
In addition to the 9 hosts classified as either “disturbed” or “strongly disturbed”, there are 3 hosts that were found to have a prominent well-defined bar, whose size in each case was 5 kpc radius. In two of these cases the bar actually dominated the integrated luminosity of the host. The hosts of two of these barred galaxies (PG0804+761, PG1001+054), were classified as having a dominant disk profile (“Dp”), while the third (PG1229+204), was classified as “B+D”. It is unclear whether these bars have any relation to the processes that produced the putative tidal features in the “disturbed” and “strongly disturbed” hosts, but if they do, then the percentage of such hosts rises to 40% (12/30).
Our finding of 30% for the fraction of “strongly disturbed” + “disturbed” hosts (40% if “well-defined bars” are included) is similar to the range of values, typically 25%-50%, quoted for “morphologically peculiar”, and/or “interacting” hosts in previous surveys of low-z QSOs (e.g., Hutchings, Crampton, & Campbell 1984; Smith et al. 1986; McLeod & Rieke 1994b; Márquez et al. 2001; Surace, Sanders, & Evans 2001). Although it is not easy to determine if the definitions used to define degree of disturbance in previous surveys are the same as used here, a comparison of those objects from our current survey which have been included in previous surveys suggests that we are in fact using similar criteria.
The breakdown by “host type” of “disturbed”, “strongly disturbed” and “well defined bar” systems is given in Fig. 6. Only one such object (PG 2214+139) with obvious “concentric shells” is classified as an elliptical. The remainder of the “disturbed” and “well defined bar” systems have obvious disks, as presumably do the “strongly disturbed” objects (see above). Taken together, 11 of these 17 systems (65%) have features which are interpreted as being indicative of obviously disturbed, non-axisymmetric structure. Such structure has in the past been seen as evidence for interaction/mergers as a possible trigger for producing the QSO.
The breakdown by (host) and (total) of “disturbed”, “strongly disturbed” and “well defined bar” systems is given in Fig. 7. In sum, there appears to be no clear evidence for a correlation with either (host) or (total) when these three classes are considered together. However, if we consider only the “strongly disturbed” systems, there is a clear preference for these to be found in the most luminous (i.e., ) hosts.
5.4.1 Close compact companions or super-star-cluster knots
In addition to asymmetric structures, we also found a small, bright knot in the inner disks of 9 hosts (see notes in Table 5). These knots were typically within a few kpc (projected distance) of the QSO. They are being discussed here since we believe that the evidence points to the knots being associated directly with the host galaxy, as opposed, for example, to being projected foreground or background objects at much larger distances from the QSO.
The terms “companion” or “close companion” have been widely used in the literature to describe a range of distance scales around QSOs where galaxies at the same redshift as the QSO are found. For example comparative studies of the environment around QSOs typically find that, at low redshifts, QSOs live in regions of moderate galaxy overdensity, typical of compact or small groups (e.g., Yee & Green 1984; Heckman et al. 1984). Closer in, typically within a projected nuclear separation of kpc between the companion and QSO nuclei, are numerous reports of close companion galaxies, clearly distinguishable as a separate galaxy, but often with reported evidence of a tidal interaction with the QSO host (e.g., Stockton 1982; Heckman et al. 1984; Hutchings, Crampton, & Campbell 1984; Bahcall et al. 1997; Boyce, Disney, & Bleaken 1999; Márquez et al. 2001). At the closest distances (typically nuclear separations kpc), where the putative close companion galaxy strongly overlaps the QSO host, as is the case in most of the strongly disturbed systems, including our own, the close companion is then plausibly the second object involved in an advanced merger with the QSO host. This last case is similar to what is meant here by the term “close companion”, except in our case we also clearly distinguish a relatively bright “compact knot” which could either be the nucleus of the companion galaxy, or possibly a super star-cluster, perhaps triggered by the merger.
We have referred to these objects (the ones within 10kpc projected separation) as “close compact companions” even though redshift is available for only one of the 9 “knots”, since it is likely that these “knots” are indeed at the same redshift as the QSO rather than simply being unrelated foreground or background objects. Five of the 9 QSO hosts with “close compact companions” are the same 5 hosts classified as being “strongly disturbed”, and one of the remaining four is classified as being “disturbed”. Several of the companions are also observed to be strongly elongated (e.g., in PG 1119+120, PG 1411+441, PG 1426+215, PG 2349014). These facts strongly suggest that the knots are directly related to a merger event.
However we remain somewhat agnostic whether these objects represent the second nucleus of a nearly merged galaxy pair, or, instead, a super star cluster perhaps triggered by the merger. Although, the “knots” appear to be too bright to be “normal” star-formation knots, and are therefore good candidates to be distinct galaxy nuclei, they are in fact similar in brightness to the putative “super star cluster” knots that have often been found in the circumnuclear regions of “infrared-excess QSOs” (e.g., Surace, Sanders, & Evans 2001) and that appear to be nearly ubiquitous in the inner disks of “warm ultraluminous infrared galaxies” (e.g. Surace & Sanders 1999). All but one of the “knots” seen in our current QSO sample have measured in the range to , and in each case this translates into an absolute -band luminosity in the range 3.5–5.5 mag fainter than the host galaxy, and the most luminous knot (), is still 3.3 mag fainter than its host (PG1302102), and is still within the upper range of luminosities observed for the star forming knots in “warm ULIGs”.
5.5 Mid/Far-infrared properties of QSO hosts
In addition to trying to better categorize the host types for our sample of QSOs, we were also interested in investigating their mid- and far-infrared emission properties, and in particular to see if a relationship exists between the infrared luminosity of the QSO and morphology of the host.
Interest in the infrared properties of QSOs has been fueled by suggestions of an evolutionary connection between QSOs and ultraluminous infrared galaxies (ULIRGs), where both types of objects represent different phases in the end stage of the merger of two relatively equal mass gas-rich spirals (see review by Sanders & Mirabel 1996). Key to such a connection has been the suggestion that those QSOs with the strongest mid/far-“infrared excess” emission seem to have “disturbed” hosts (e.g., Sanders & Mirabel 1996; Boyce et al. 1996; Canalizo & Stockton 2000; Clements 2000; Haas et al. 2000; Surace, Sanders, & Evans 2001), whose properties are somewhat similar to the hosts of “warm” ULIRGs. For the QSOs, “infrared-excess” has been defined using the mean radio-to-Xray spectral energy distributions (SEDs) of QSOs (Sanders et al., 1989; Elvis et al., 1994). The data have been interpreted as showing that the SED is dominated by two thermal emission “bumps”. In addition to the well-known “blue bump” (BB) of optical/UV emission at wavelengths m, thought to be associated with thermal emission from an accretion disk, there also exists an “infrared/submillimeter bump” at wavelengths m, which is interpreted as being primarily due to dust re-radiation of emission from either the accretion disk or from embedded circumnuclear star formation. The “infrared excess” is then defined to be the ratio of luminosities in the two “bumps”, .
The recent availability of reprocessed ISO observations of QSOs (Haas et al., 2000; Polletta et al., 2000; Haas et al., 2003), plus the release of the IRAS Faint Source Catalog (Moshir et al., 1992), have now made it possible to more accurately estimate the strength as well as the color temperature of the “infrared/submillimeter bump” for the BQS QSOs. In particular, we have been able for the first time to compile fluxes in four wavebands (12m, 25m, 60m and 100m) for the majority (18/32) of our BQS sources, and in 2-3 of these wavebands for an additional 10 sources. Three sources have only one flux measurement, but with sensitive upper limits in the remaining 3 wavebands. Only one source has just upper limits in all four wavebands. These measurements are listed here in Table 8 where they have been used to compute an infrared luminosity, m, and the luminosity ratio, , for each source following the definitions and prescriptions found in Table 1 of Sanders & Mirabel (1996).
Using the data in Table 8, we compare the infrared/optical ratio, , of the QSO hosts versus host type in Fig. 9, and tabulate the mean and median values of and median , for different host type and degree of disturbance in Table 9. Figure 9 suggests a fairly strong correlation between and host type, with nearly all ellipticals (“E”) having the lowest observed values of . Table 9 shows that Es have median values of slightly less than half that of hosts with detectable disks (“Dp” + “B+D”). The previously observed correlation between non-disturbed hosts and E host type then implies (as shown in Table 9) that the median ratio for “disturbed” and “strongly disturbed” hosts is also approximately twice the median ratio for “non-disturbed” hosts.
A strong correlation between IR luminosity and host morphology had previously been suggested by Clements (2000), although a close comparison between his “quiet/disturbed” classification and the images presented here shows that the images he used lacked the angular resolution and/or depth to reliably classify the host galaxies: for example, PG1411+442 and PG1700+518, two of the most disturbed objects in our sample, were classified as “quiet”, while PG0923+201 and PG0844+349 were classified as disturbed.
Another method of characterizing the mid/far-infrared emission of QSOs has been to use the mid/far-infrared color temperature (e.g., Lipari 1994; Canalizo & Stockton 2001). The color-color plot shown in Fig. 10 adopts the same definitions used in Canalizo & Stockton (2001), who first pointed out that nearly all (8/9) of the “transition QSO” they studied—i.e., objects with an “intermediate position” in the far-infrared color-color diagram, in-between the empirical location of optically-selected QSOs and far-infrared-selected ULIRGs—were undergoing strong tidal interactions indicative of major mergers. Our new results are similar, in that all 8 of our “disturbed” and “strongly disturbed” QSOs for which we could reliably compute far-infrared colors, fall in the “transition region” between the two limits marked by the lines denoting “power-law” and “black-body” emission. Additionally, we find only objects we classified as “non-disturbed” above the “power-law” continuum line. We interpret this as additional evidence for a positive correlation between fading evidence of tidal structure (i.e., increasing age of the merger), and decreasing , since the latter is correlated with increasing far-infrared color temperature.
6 Conclusions
We have used AO imaging on the 8.1m Gemini-North and 8.2m Subaru telescopes to acquire near-infrared (mostly -band) images of an unbiased sample of 32 nearby () optically selected QSOs from the PGBQS in order to investigate the luminosity and morphology of the host galaxies, and to compare the properties of the host with properties of the QSO. The -band absolute magnitudes of our QSO targets span a factor of 23, from (the minimum threshold for “bona-fide QSOs” according to the definition given by Schmidt & Green 1983) to . Three sources have absolute luminosities slightly below the minimum threshold and are traditionally classified as “Seyfert 1 nuclei”. Given that this threshold is somewhat arbitrary, we have included these three objects in the current study. Following the definitions of Kellermann et al. (1994), twenty-seven of our sources were radio-quiet and 5 were radio-loud.
Our imaging campaign in general was quite successful, given that we were able to detect and characterize the host type for 28 of our sources. Our basic results can be summarized as follows:
-
1.
The mean -band magnitude (and corresponding ) of the host galaxies for our sample of QSOs was (), with a range of to ().
-
2.
For the sample of 28 classified hosts, the distribution of “best-fit” host types was 10 (36%) ellipticals (“E”), 3 (11%) bulge+disk (“B+D”), 8 (29%) disk dominated (“Dp”), and 7 (25%) of indeterminate type.
-
3.
There appears to be a strong correlation between host type and the -band absolute magnitude of the host. Sub- hosts all have a dominant (“Dp”) or strong disk component (“B+D”); hosts appear to be equally divided between ellipticals (“E”) and disks (“Dp” or “B+D”); hosts are mostly ellipticals (“E”). A similar, but somewhat weaker trend is found for the -band absolute magnitude of the QSO.
-
4.
Thirty percent (9/30) of our detected hosts were classified as either being “disturbed” (3) or “strongly disturbed” (6). An additional 3 objects were found to have strong well defined bars, bringing the total fraction of objects with obvious disturbed and/or non-axisymmetric structure up to 40% (12/30). In total, these objects are relatively equally distributed over all values of , and (total), although in detail, the “strongly disturbed” objects are much more likely to be found among the most luminous hosts (i.e. ), with “disturbed” and “well defined bars” more likely to be associated with less luminous hosts (i.e. ).
-
5.
For the subsample of 18 QSOs with redshifts , which is the redshift completeness limit corresponding to the limit of the PGBQS (Schmidt & Green, 1983), we find no obvious correlation between the absolute magnitude of the QSO, (total), and the absolute magnitude of the host galaxy, . However at , all 8 sources in our sample have the largest host luminosities, ( ), and the largest QSO luminosities, , suggesting that the most luminous QSOs are found among the most luminous hosts.
-
6.
The mean properties of the hosts of radio-loud quasars (RLQs) are clearly different from the mean properties of the hosts of radio-quiet QSOs (RQQs). All 5 of the RLQs are among the 10 sources in our sample at . All 5 RLQs are among the 10 most luminous QSOs (i.e. ), and for the 4 RLQs where we were able to reliable measure the host, all 4 are among the 5 most luminous hosts (i.e. ). Three of the 5 RLQ hosts are classified as ellipticals, one host suffers from a bad PSF but otherwise shows no visible sign of disk structure, and one is strongly disturbed and cannot be classified. These results are in keeping with the paradigm which suggest that RLQs are preferentially found in giant elliptical hosts with the most luminous QSOs.
-
7.
We find a strong correlation between the infrared excess, , of the QSO and its host type and host degree of disturbance. This ratio is twice as large, on average, in hosts with strong disk components as in elliptical hosts, and likewise is twice as large, on average, in “disturbed” + “strongly disturbed” hosts as in “non-disturbed” hosts. We also find that “disturbed” and “strongly disturbed” hosts have mid/far-infrared colors that place them in a region of the far-infrared color-color plane in between the power-law that is characteristic of the majority of QSOs, and the black-body that is characteristic of the majority of ULIRGs.
Our results concerning the mean and range of host luminosities, the general breakdown of host types, the fraction of objects with disturbed features, and the differences in the mean properties of the hosts of RLQs versus RQQs, are in general agreement with previous studies of the host properties of low-z QSOs. Our mean and range of -band host luminosities are almost identical to the values reported earlier by McLeod & Rieke (1994b) and Surace & Sanders (2000), respectively, in their studies of a similar sample of PGQSOs selected from the BQS (Schmidt & Green, 1983). One advantage of our AO observations with 8m-class telescopes is that we have perhaps been able to give more emphasis to trying to accurately characterize the host properties of individual sources, and to search for systematic trends in host type versus other properties of the QSO.
Perhaps the most interesting new results from our survey are those concerning the detailed distribution of disturbed hosts versus the luminosity of the host and the luminosity of the QSO, and the apparent correlation of infrared excess with host type. Our results suggest that the percentage of disturbed hosts is significant (15-30 %) across the range of observed host luminosities (), even though the main host type clearly changes from hosts with prominent disks to hosts which appear to be luminous ellipticals. Whether disturbed hosts represent a particular phase is the lifetime of virtually all QSOs or whether they represent an inherently separate class of QSOs is somewhat unclear. The answer to this question depends on the answers to two subsidiary questions: (1) What is the time scale for QSO activity relative to that for the persistence of recognizable signs of disturbance due to a strong interaction or merger? and (2) What is the true space density of QSOs with bolometric luminosities above some specific value and the fraction of these that show some level of disturbance indicating a recent merger? Our study has some bearing on this second question. However, it now seems likely that UV-selected optical QSO samples, such as the one studied here, may represent considerably less than half of the total QSO population at a comparable bolometric luminosity. In addition, recent work by Jester et al. (2005) comparing QSOs found in the Sloan Digital Sky Survey with the PG sample shows that the PG sample is seriously incomplete even in terms of its own specified selection criteria. This incompleteness suggests two imperatives for future work. First, it seems essential to develop a sample that is substantially complete to a specific bolometric QSO luminosity over some large volume. This effort will necessarily require complementary techniques covering wavelength regimes at least from X-rays to the far IR. Second, it will be necessary to carry out imaging studies similar to those we have done for the PGBQS on representative subsamples of QSOs identified by these other techniques, for it is quite likely that, for example, the fraction showing signs of mergers may vary for samples selected by different criteria. A recent step in this direction has been taken by Hutchings et al. (2003) for QSOs with found in the 2MASS survey, for which they find an extraordinarily high fraction (%) show disturbances indicating tidal interactions.
References
- Andreani et al. (1999) Andreani, P., Franceschini, A., & Granato, G. 1999, MNRAS, 306, 161
- Bahcall et al. (1997) Bahcall, J.N., Kirhakos, S., Saxe, D. H., & Schneider, D. P. 1997, ApJ, 479, 642
- Balzano & Weedman (1981) Balzano, V. A., & Weedman, D. W., ApJ, 243, 756
- Barthel & Sanders (2006) Barthel, P. B., & Sanders, D. B. eds., 2006, QSO Host Galaxies: Evolution and Environment, New A Rev., in press
- Bothun et al. (1984) Bothun, G. D., Romanishin, W., Strom, S. E., & Strom, K. M. 1984, AJ, 89, 1300
- Boyce, Disney, & Bleaken (1999) Boyce, P. J., Disney, M. J., & Bleaken, D. G. 1999, MNRAS, 302, L39
- Boyce et al. (1996) Boyce, P. J. et al. 1996, ApJ, 473, 760
- Canalizo & Stockton (2000) Canalizo, G., & Stockton, A. 2000, AJ, 120, 1750
- Canalizo & Stockton (2001) Canalizo, G., & Stockton, A. 2001, ApJ, 555, 719
- Clements (2000) Clements, D.L. 2000, MNRAS, 311, 833
- Clements & Pérez-Fournon (1997) Clements, D. L., & Pérez-Fournon, eds. 2001, Quasar Hosts, (Berlin: Springer), 336pp
- Cutri et al. (2002) Cutri, R. M., Nelson, B. O., Francis, P. J., & Smith, P. S. 2002, in AGN Surveys, eds. R. Green, E. Khachikian, D. Sanders, (San Francisco: ASP Conf. Ser.), 284, 127
- Disney et al. (1995) Disney, M. J., et al. 1995, Nature, 376, 150
- Dunlop et al. (1993) Dunlop, J. S., Taylor, G. L., Hughes, D. H., & Robson, E. I. 1993, MNRAS, 264, 455
- Dunlop et al. (2003) Dunlop, J. S., McLure, R. J., Kukula, M. J., Baum, S. A., O’Dea, C. P., & Hughes, D. H. 2003, MNRAS, 340, 1095
- Elvis et al. (1994) Elvis, M. et al. 1994, ApJS, 95, 1
- Giveon et al. (1999) Giveon, U., Maoz, D., Kaspi, S., Netzer, H., & Smith, P. S. 1999, MNRAS, 306, 637
- Graves et al. (1998) Graves, J. E., Northcott, M. J., Roddier, F. J., Roddier, C. A., Close, L. M. 1998, Proc. SPIE, 3353, 34
- Haas et al. (2000) Haas, M., Klaas, U., Coulson, I., Thommes, E., & Xu, C. 2000, A&A, 356, 83
- Haas et al. (2003) Haas, M., et al. 2003, A&A, 402, 87
- Hamilton et al. (2002) Hamilton, T. S., Casertano, S., & Turnshek, D. A. 2002, ApJ, 576, 61
- Heckman et al. (1984) Heckman, T. M., Bothun, G. D., Balick, B., & Smith, E. P. 1984, AJ, 89, 958
- Hines et al. (1999) Hines, D. C., Low, F. J., Thompson, R. I., Weymann, R. J., & Storrie-Lombardi, L. J. 1999, ApJ, 512, 140
- Hutchings, Crampton, & Campbell (1984) Hutchings, J. B., Crampton, D., & Campbell, B. 1984, ApJ, 280, 41
- Hutchings, Janson, & Neff (1989) Hutchings, J. B., Janson, T., & Neff, S. G. 1989, ApJ, 342, 660
- Hutchings & Crampton (1990) Hutchings, J. B., & Crampton, D. 1990, AJ, 99, 37
- Hutchings & Neff (1991) Hutchings, J. B., & Neff, S. G. 1991, AJ, 101, 434
- Hutchings & Neff (1992) Hutchings, J. B., & Neff, S. G. 1992, AJ, 104, 1
- Hutchings & Neff (1997) Hutchings, J. B., & Neff, S. G. 1996, AJ, 113, 550
- Hutchings et al. (2003) Hutchings, J. B., Maddox, S., Cutri, R. M., & Nelson, B. O. 2003, AJ, 126, 63
- Hyland & Allen (1982) Hyland, A. R., & Allen, D. A. 1982, MNRAS, 199, 943
- Jahnke & Wisotzki (2003) Jahnke, K., & Wisotzki, L. 2003, MNRAS, 346, 304
- Jester et al. (2005) Jester, S., et al. 2005, AJ, 130, 873
- Kellermann et al. (1994) Kellermann, K. I., Sramek, R. A., Schmidt, M., Green, R. F., & Shaffer, D. B. 1994, AJ, 108, 1163
- Lipari (1994) Lipari, S. 1994, ApJ, 436, 102
- Low et al. (1988) Low, F. J., Cutri, R. M., Huchra, J. P., & Kleinmann, S. G. 1988, ApJ, 327, L41
- MacKenty & Stockton (1984) MacKenty, J. W., & Stockton, A. 1984, ApJ, 283, 64
- Márquez et al. (2001) Márquez, I., Masegosa, J., del Olmo, A., Lara, L., García, E., & Molina, J. eds., 2001, QSO Hosts and Their Environments, (New York: Kluwer), 379pp
- Márquez et al. (2001) Márquez, I., Petitjean, P., Théodore, B., Bremer, M, Monnet, G., & Beuzit, J.-L., A&A, 371, 97
- McAlary et al. (1983) McAlary, C. W., McLaren, R. A., McGonegal, & R. J., Maza, J. 1983, ApJS, 52, 341
- McLeod & McLeod (2001) McLeod K. K., & McLeod B. A. 2001, ApJ, 546, 782
- McLeod & Rieke (1994a) McLeod, K. K., & Rieke, G. H. 1994a, ApJ, 420, 58
- McLeod & Rieke (1994b) McLeod, K. K., & Rieke, G. H. 1994b, ApJ, 431, 137
- McLeod & Rieke (1995) McLeod, K. K., & Rieke, G. H. 1995, ApJ, 454, L77
- McLeod et al. (1999) McLeod, K. K., Rieke, G. H., & Storrie-Lombardi, L. J. 1999, ApJ, 511, L67
- McLure et al. (1999) McLure, R. J., Kukula, M. J., Dunlop, J. S., Baum, S. A., O’Dea, C. P., & Hughes, D. H. 1999, MNRAS, 308, 377
- Miller & Sheinis (2002) Miller, J. S., & Sheinis, A. I. 2002 , ApJ, 588, L9
- Mobasher, Sharples & Ellis (1993) Mobasher, B., Sharples, R. M., & Ellis, R. S. 1993, MNRAS, 263, 560
- Moshir et al. (1992) Moshir, M., et al. 1992, Explanatory Supplement to the IRAS Faint Source Catalog, Version 2 (JPL D-10015) (Pasadena: JPL)
- Neugebauer et al. (1979) Neugebauer, G., Oke, J. B., Becklin, E. E., & Matthews, K. 1979, ApJ, 230, 79
- Neugebauer et al. (1987) Neugebauer, G., Green, R. F., Matthews, K., Schmidt, M., Soifer, B. T., & Bennett, J. 1987, ApJS, 63, 615
- Neugebauer et al. (1989) Neugebauer, G., Soifer, B. T., Matthews, K., & Elias, J.H. 1989, ApJ, 97, 957
- Percival et al. (2001) Percival, W. J., Miller, L., McLure, R. J., & Dunlop, J. S. 2001, MNRAS, 322, 843
- Polletta et al. (2000) Polletta, M., Courvoisier, T. J.-L., Hooper, E. J., & Wilkes, B. J. 2000, A&A, 362, 75
- Rudy et al. (1982) Rudy, R. J., Levan, P. D., & Rodriguez-Espinosa, J. M. 1982, AJ, 87, 598
- Sanders et al. (1988) Sanders, D. B., Soifer, B. T., Elias, J. H., Madore, B. F., Matthews, K., Neugebauer, G., & Scoville, N. Z. 1988, ApJ, 325, 74
- Sanders et al. (1989) Sanders, D. B., Phinney, E. S., Neugebauer, G., Soifer, B. T., & Matthews, K. 1989, ApJ, 347, 29
- Sanders & Mirabel (1996) Sanders, D. B., & Mirabel, I. F. 1996, ARA&A, 34, 749
- Schmidt & Green (1983) Schmidt, M., & Green, R. F. 1983, ApJ, 269, 352
- Scoville et al. (2003) Scoville, N. Z., Frayer, D. T., Schinnerer, E., & Christopher, M. 2003, ApJ, 585, L105
- Sitko et al. (1982) Sitko, M. L., Stein, W. A., Zhang, Y.-X., & Wisniewski, W. Z. 1982, ApJ, 259, 486
- Smith et al. (1986) Smith, E. P., Heckman, T. M., Bothun, G. D., Romanishin, W., & Balick, B. 1986, ApJ, 306, 64
- Staguhn et al. (2004) Staguhn, J. G., Schinnerer, E., Eckart, A., & Scharwächter, J. 2004, ApJ, 609, 85
- Stockton (1982) Stockton, A. 1982, ApJ, 257, 33
- Stockton, Canalizo, & Close (1998) Stockton, A., Canalizo, G., & Close, L. 1998, ApJ, 500, L121
- Stockton & MacKenty (1983) Stockton, A., & MacKenty, J. W. 1983, Nature, 305, 678
- Stockton & MacKenty (1987) Stockton, A., & MacKenty, J. W. 1987, ApJ, 316, 584
- Surace et al. (1998) Surace, J. A., Sanders, D. B., Vacca, W. D., Veilleux, S., & Mazzarella, J. M. 1998, ApJ, 492, 116
- Surace & Sanders (1999) Surace, J. A., & Sanders, D. B. 1999, ApJ, 512, 162
- Surace & Sanders (2000) Surace, J. A., & Sanders, D. B. 2000, AJ, 120, 604
- Surace, Sanders, & Evans (2001) Surace, J. A., Sanders, D. B., & Evans, A. S. 2001, AJ, 122, 2791
- Takami et al. (2004) Takami, H., et al. 2004, PASJ, 56, 225
- Taylor et al. (1996) Taylor, G. L., Dunlop, J. S., Hughes, D. H., & Robson, E. I. 1996, MNRAS, 283, 930
- Tokunaga et al. (2002) Tokunaga, A. T., Simons, D. A., & Vacca, W. D. 2002, PASP, 114, 180
- Veilleux et al. (2005) Veilleux, S., et al. 2005, ApJ, submitted
- Veron-Cetty & Woltjer (1990) Veron-Cetty, M.-P., & Woltjer, L. 1990, A&A, 236, 69
- Yee & Green (1984) Yee, H. K. C., & Green, R. F. 1984, ApJ, 280, 79
- Zheng et al. (1999) Zheng, Z., Wu, H., Mao, S., Xia, X.-Y., Deng, Z.-G., & Zou, Z.-L. 1999, A&A, 349, 735
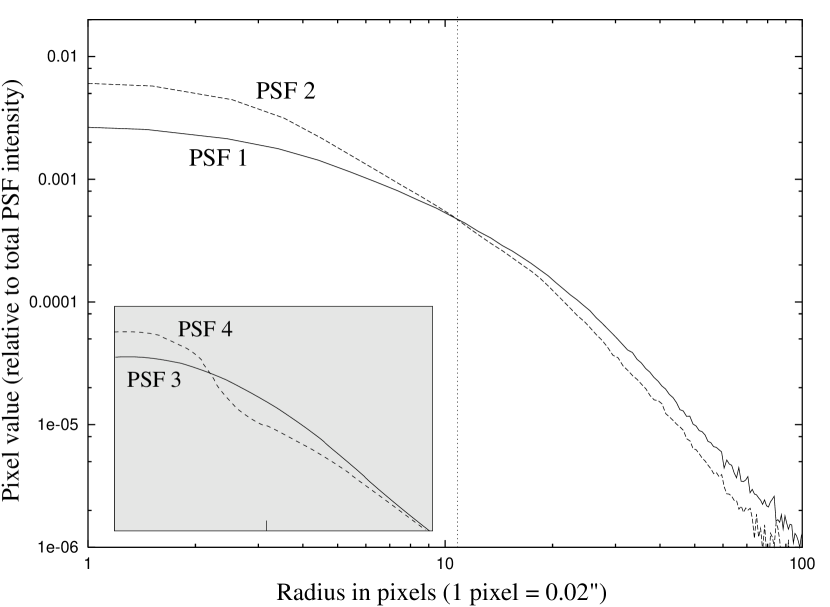
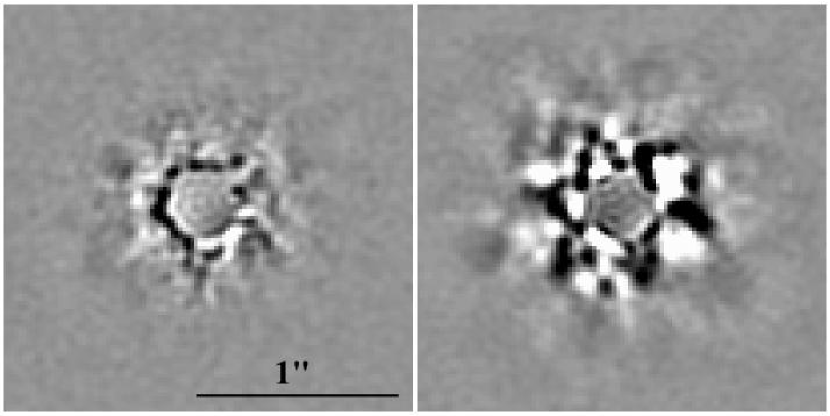
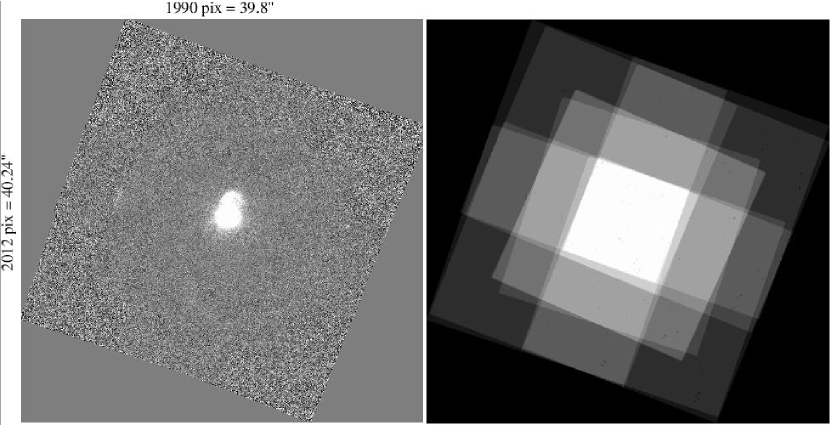
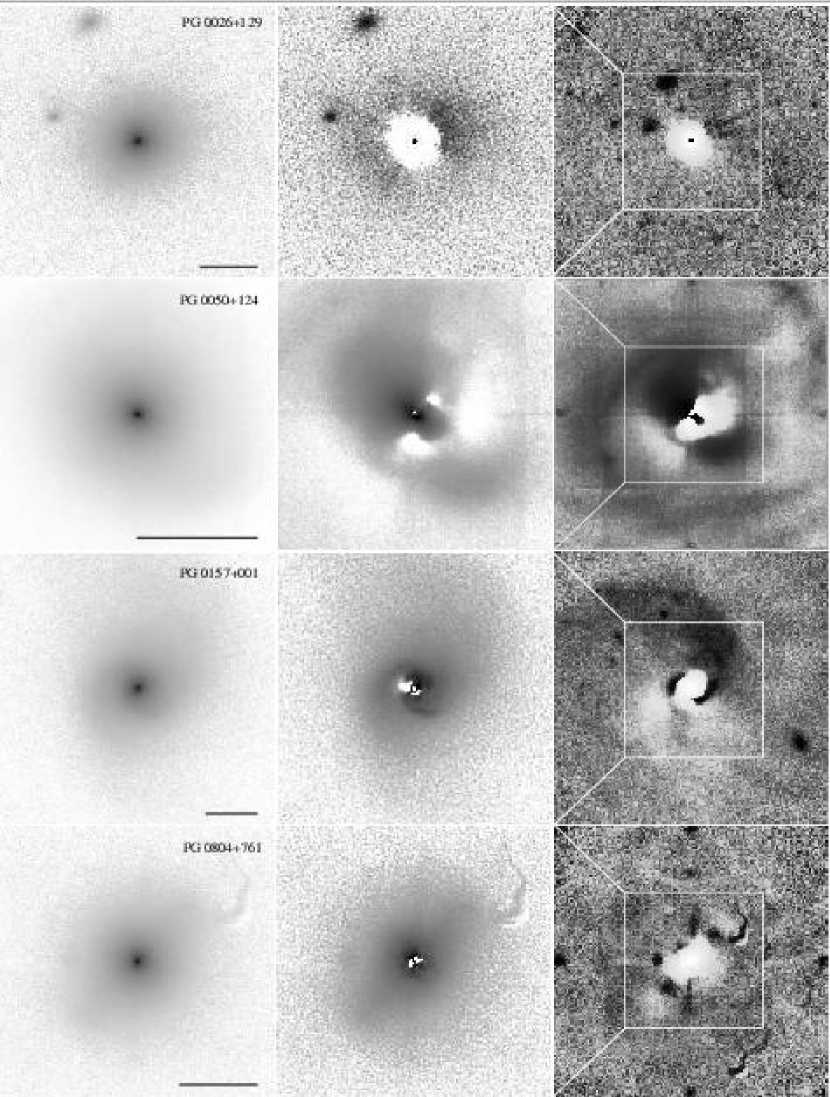
![[Uncaptioned image]](/html/astro-ph/0605079/assets/x5.png)
Fig. 4. — Continued.
![[Uncaptioned image]](/html/astro-ph/0605079/assets/x6.png)
Fig. 4. — Continued.
![[Uncaptioned image]](/html/astro-ph/0605079/assets/x7.png)
Fig. 4. — Continued.
![[Uncaptioned image]](/html/astro-ph/0605079/assets/x8.png)
Fig. 4. — Continued.
![[Uncaptioned image]](/html/astro-ph/0605079/assets/x9.png)
Fig. 4. — Continued.
![[Uncaptioned image]](/html/astro-ph/0605079/assets/x10.png)
Fig. 4. — Continued.
![[Uncaptioned image]](/html/astro-ph/0605079/assets/x11.png)
Fig. 4. — Continued.
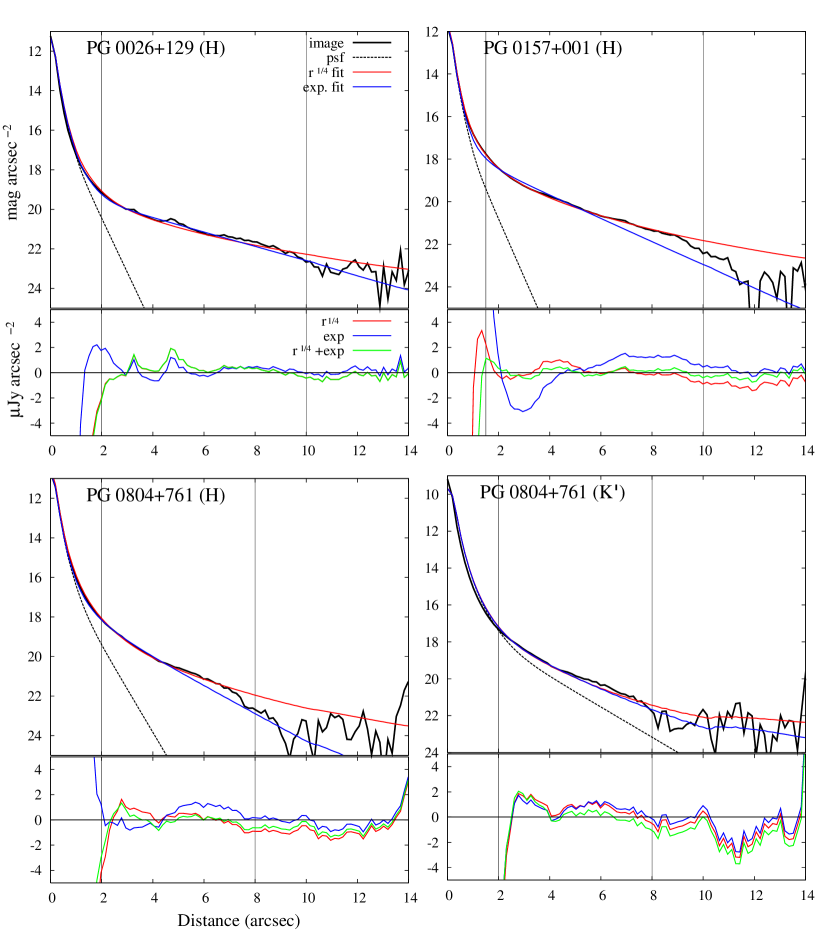
![[Uncaptioned image]](/html/astro-ph/0605079/assets/x13.png)
Fig. 5. — Continued.
![[Uncaptioned image]](/html/astro-ph/0605079/assets/x14.png)
Fig. 5. — Continued.
![[Uncaptioned image]](/html/astro-ph/0605079/assets/x15.png)
Fig. 5. — Continued.
![[Uncaptioned image]](/html/astro-ph/0605079/assets/x16.png)
Fig. 5. — Continued.
![[Uncaptioned image]](/html/astro-ph/0605079/assets/x17.png)
Fig. 5. — Continued.
![[Uncaptioned image]](/html/astro-ph/0605079/assets/x18.png)
Fig. 5. — Continued.
![[Uncaptioned image]](/html/astro-ph/0605079/assets/x19.png)
Fig. 5. — Continued.
![[Uncaptioned image]](/html/astro-ph/0605079/assets/x20.png)
Fig. 5. — Continued.
![[Uncaptioned image]](/html/astro-ph/0605079/assets/x21.png)
Fig. 5. — Continued.
![[Uncaptioned image]](/html/astro-ph/0605079/assets/x22.png)
Fig. 5. — Continued.
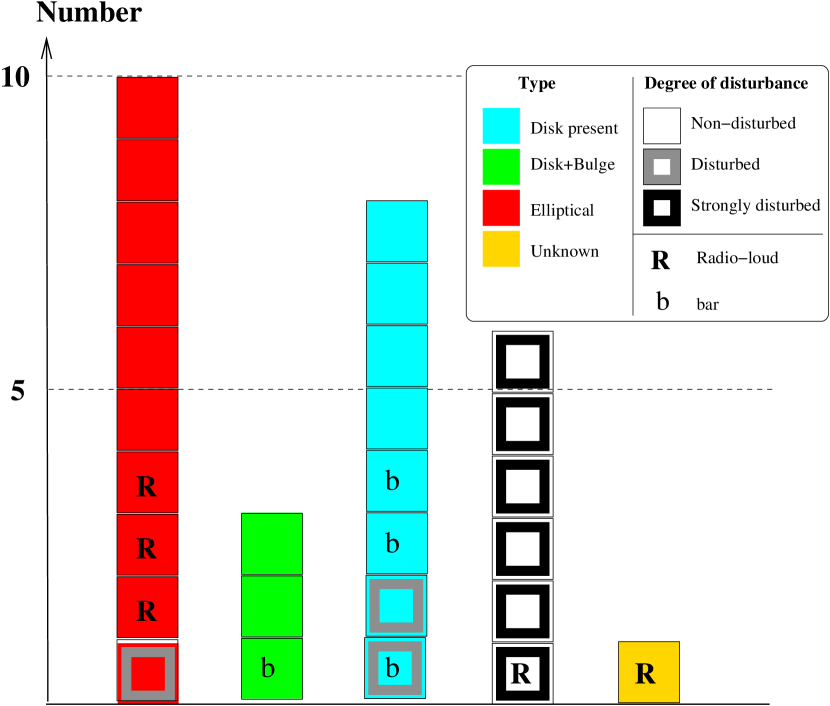
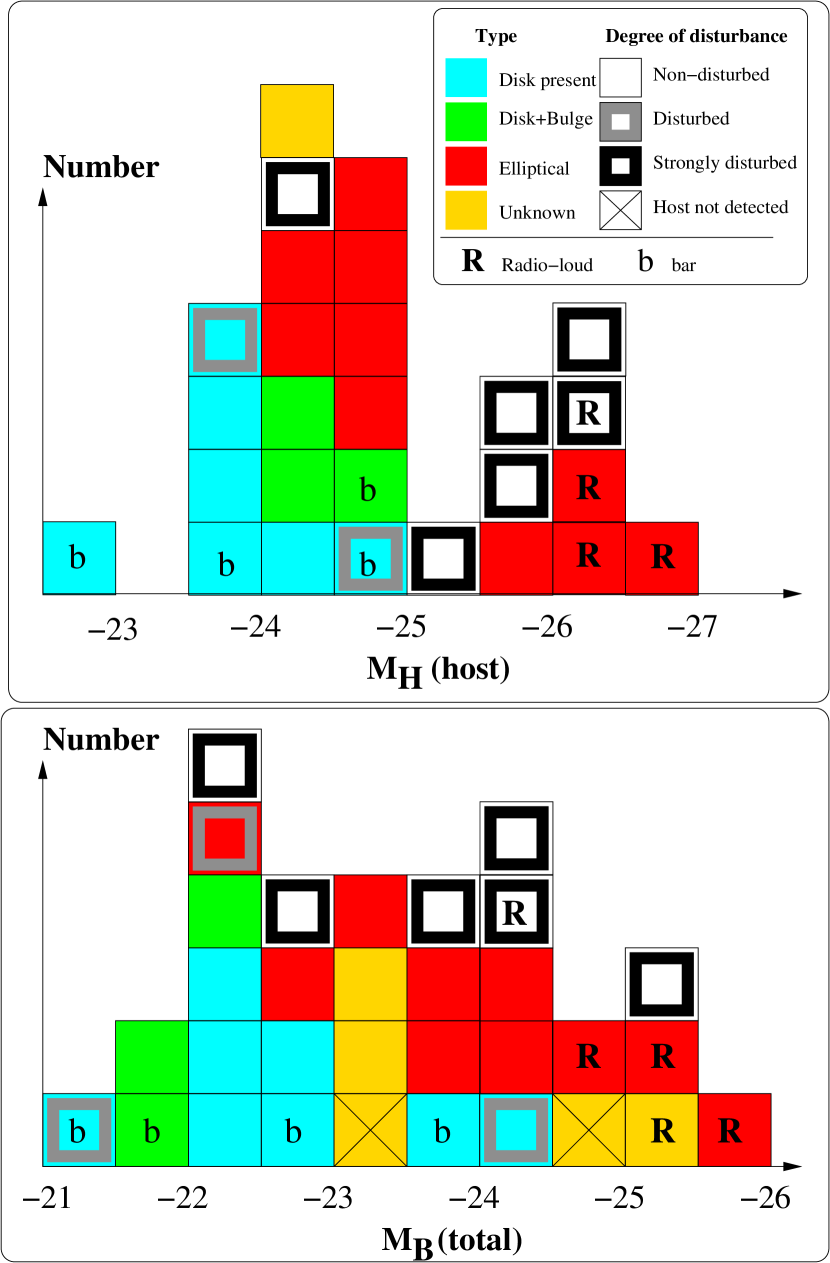
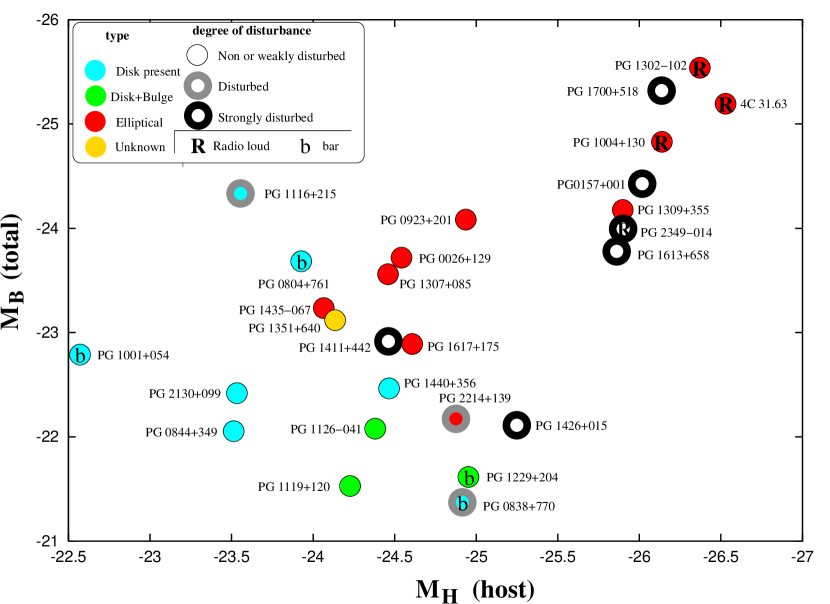
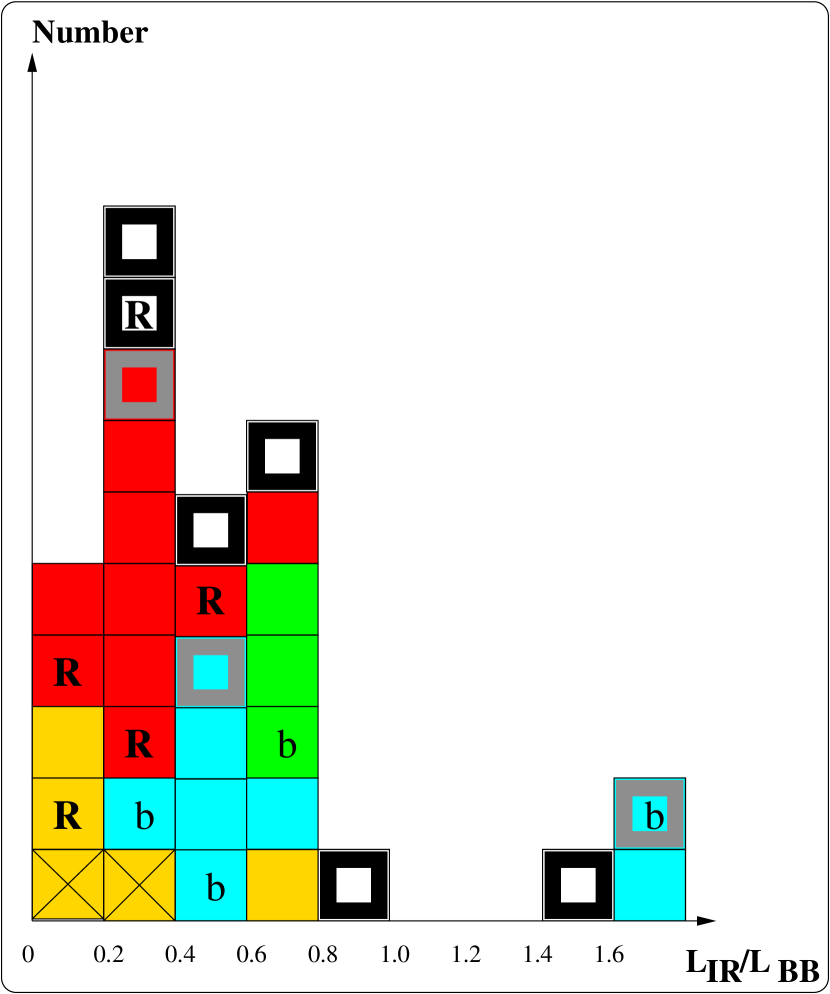
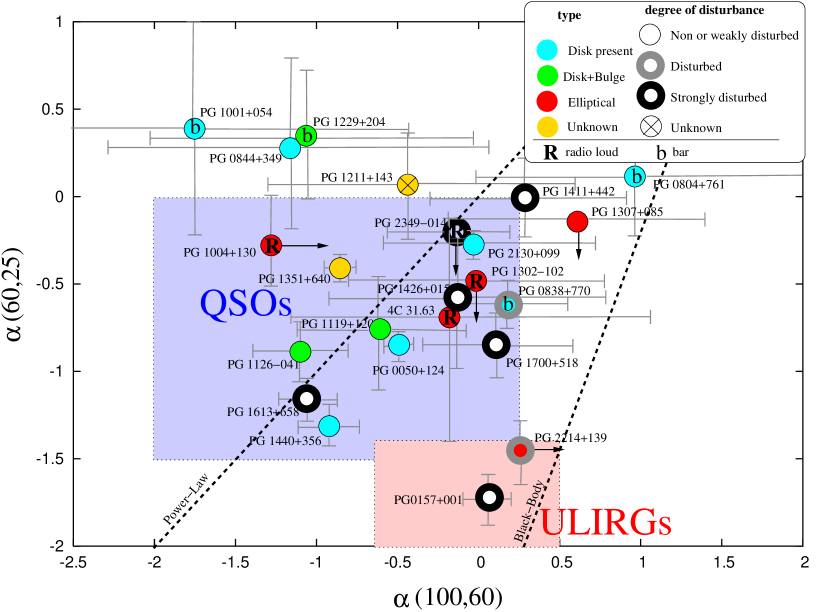
| Name | J2000 Coordinates | RedshiftaaRedshift given by NED | bb, , . | RadioccQ - radio quiet, L - radio loud: following Kellermann et al. (1994) where sources with a 5GHz radio luminosity greater than W Hz-1 ( km s-1 Mpc-1, ) were referred to as radio loud and the weaker ones as radio quiet. | |
|---|---|---|---|---|---|
| (h m s) (° ′ ″) | (mag) | (mag) | (Q,L) | ||
| PG0026+129 | 00 29 13.81 +13 16 04.5 | 0.142 | dd magnitude from Giveon et al. (1999). | Q | |
| PG0050+124 | 00 53 35.08 +12 41 34.4 | 0.061 | ee magnitude from Surace & Sanders (2000). | Q | |
| PG0157+001 | 01 59 50.24 +00 23 40.9 | 0.163 | ee magnitude from Surace & Sanders (2000). | Q | |
| PG0804+761 | 08 10 58.55 +76 02 41.8 | 0.100 | dd magnitude from Giveon et al. (1999). | Q | |
| PG0838+770 | 08 44 45.63 +76 53 09.4 | 0.131 | dd magnitude from Giveon et al. (1999). | Q | |
| PG0844+349 | 08 47 42.51 +34 45 04.6 | 0.064 | dd magnitude from Giveon et al. (1999). | Q | |
| PG0923+201 | 09 25 54.87 +19 54 06.7 | 0.190 | dd magnitude from Giveon et al. (1999). | Q | |
| PG0953+414 | 09 56 52.46 +41 15 22.0 | 0.234 | dd magnitude from Giveon et al. (1999). | Q | |
| PG1001+054 | 10 04 20.15 +05 13 00.3 | 0.160 | dd magnitude from Giveon et al. (1999). | Q | |
| PG1004+130 | 10 07 26.11 +12 48 56.2 | 0.240 | ff magnitude from Neugebauer et al. (1979). | L | |
| PG1116+215 | 11 19 08.70 +21 19 18.0 | 0.177 | gg magnitude from Schmidt & Green (1983). | Q | |
| PG1119+120 | 11 21 47.17 +11 44 18.1 | 0.050 | hh magnitude from Surace, Sanders, & Evans (2001). | Q | |
| PG1126041 | 11 29 16.73 04 24 07.8 | 0.060 | hh magnitude from Surace, Sanders, & Evans (2001). | Q | |
| PG1211+143 | 12 14 17.67 +14 03 12.4 | 0.081 | dd magnitude from Giveon et al. (1999). | Q | |
| PG1229+204 | 12 32 03.67 +20 09 29.1 | 0.063 | dd magnitude from Giveon et al. (1999). | Q | |
| PG1302102 | 13 05 33.01 10 33 19.4 | 0.278 | gg magnitude from Schmidt & Green (1983). | L | |
| PG1307+085 | 13 09 47.03 +08 19 49.3 | 0.155 | dd magnitude from Giveon et al. (1999). | Q | |
| PG1309+355 | 13 12 17.74 +35 15 21.3 | 0.184 | dd magnitude from Giveon et al. (1999). | Q | |
| PG1351+640 | 13 53 15.85 +63 45 44.9 | 0.088 | dd magnitude from Giveon et al. (1999). | Q | |
| PG1411+442 | 14 13 48.47 +44 00 13.6 | 0.090 | dd magnitude from Giveon et al. (1999). | Q | |
| PG1426+015 | 14 29 06.67 +01 17 06.3 | 0.086 | dd magnitude from Giveon et al. (1999). | Q | |
| PG1435067 | 14 38 16.25 06 58 21.5 | 0.126 | gg magnitude from Schmidt & Green (1983). | Q | |
| PG1440+356 | 14 42 07.54 +35 26 22.9 | 0.079 | hh magnitude from Surace, Sanders, & Evans (2001). | Q | |
| PG1613+658 | 16 13 57.27 +65 43 09.7 | 0.129 | dd magnitude from Giveon et al. (1999). | Q | |
| PG1617+175 | 16 20 11.29 +17 24 27.6 | 0.112 | dd magnitude from Giveon et al. (1999). | Q | |
| PG1626+554 | 16 27 56.03 +55 22 31.2 | 0.133 | dd magnitude from Giveon et al. (1999). | Q | |
| PG1700+518 | 17 01 24.87 +51 49 21.0 | 0.292 | dd magnitude from Giveon et al. (1999). | Q | |
| PG2130+099 | 21 32 27.92 +10 08 18.7 | 0.063 | dd magnitude from Giveon et al. (1999). | Q | |
| 4C 31.63 | 22 03 15.98 +31 45 38.3 | 0.295 | ff magnitude from Neugebauer et al. (1979). | L | |
| PG2214+139 | 22 17 12.35 +14 14 21.2 | 0.066 | ii magnitude from McAlary et al. (1983). | Q | |
| PG2251+113 | 22 54 10.50 +11 36 39.0 | 0.326 | dd magnitude from Giveon et al. (1999). | L | |
| PG2349014 | 23 51 56.13 01 09 13.4 | 0.174 | jj magnitude = 15.45 (Simbad). | L |
| Name | Obs. Date | ExposureaaValues in parentheses indicate poor photometric conditions, hence the sensitivity may not scale as | Filter | FWHM | Telescope |
|---|---|---|---|---|---|
| (UT) | (s) | (″) | |||
| PG0026+129 | 2001 Jun 27 | 2670 | 0.13 | Gemini | |
| PG0050+124 | 2000 Nov 17 | (1200) | 0.32 | Gemini | |
| 2000 Nov 17 | (1620) | 0.23 | Gemini | ||
| 2000 Nov 19 | (1560) | 0.16 | Gemini | ||
| 2000 Nov 19 | (1200) | 0.15 | Gemini | ||
| 2000 Nov 20 | (2300) | 0.23 | Gemini | ||
| 2000 Nov 20 | (1130) | 0.21 | Gemini | ||
| PG0157+001 | 2001 Sep 14 | 4050 | 0.19 | Gemini | |
| PG0804+761 | 2000 Dec 21 | 2910 | 0.15 | Gemini | |
| 2000 Dec 21 | 2620 | 0.15 | Gemini | ||
| PG0838+770 | 2003 Feb 12 | 1460 | 0.32 | Subaru | |
| PG0844+349 | 2001 Oct 10 | 600 | 0.38 | Gemini | |
| PG0923+201 | 2001 Feb 21 | 3930 | 0.20 | Gemini | |
| 2001 Feb 23 | (5700) | 0.17 | Gemini | ||
| PG0953+414 | 2000 Dec 20 | 4590 | 0.13 | Gemini | |
| 2001 Feb 23 | (1380) | 0.23 | Gemini | ||
| PG1001+054 | 2000 Dec 26 | 4140 | 0.20 | Gemini | |
| PG1004+130 | 2003 Feb 12 | 2400 | 0.16 | Subaru | |
| PG1116+215 | 2002 Apr 21 | (3030) | 0.18 | Gemini | |
| PG1119+120 | 2001 Feb 23 | (3960) | 0.15 | Gemini | |
| PG1126041 | 2001 Feb 21 | 4950 | 0.15 | Gemini | |
| PG1211+143 | 2002 Apr 21 | (2970) | 0.17 | Gemini | |
| PG1229+204 | 2002 Apr 23 | (630) | 0.24 | Gemini | |
| PG1302102 | 2003 Feb 12 | 1620 | 0.15 | Subaru | |
| PG1307+085 | 2003 Feb 12 | 2420 | 0.15 | Subaru | |
| PG1309+355 | 2002 Apr 23 | (2490) | 0.22 | Gemini | |
| PG1351+640 | 2002 Apr 21 | (2100) | 0.23 | Gemini | |
| PG1411+442 | 2001 Feb 23 | (1800) | 0.13 | Gemini | |
| 2001 Feb 23 | (1620) | 0.15 | Gemini | ||
| 2001 Feb 25 | 3870 | 0.17 | Gemini | ||
| 2001 Apr 25 | 2730 | 0.13 | Gemini | ||
| PG1426+015 | 2001 Apr 24 | (4080) | 0.18 | Gemini | |
| PG1435067 | 2001 Feb 23 | (2100) | 0.21 | Gemini | |
| PG1440+356 | 2001 Jun 28 | (960) | 0.16 | Gemini | |
| PG1613+658 | 2001 Feb 25 | 4500 | 0.30 | Gemini | |
| 2001 Apr 25 | 3420 | 0.18 | Gemini | ||
| 2001 Apr 27 | 1380 | 0.18 | Gemini | ||
| 2001 Apr 27 | 1110 | 0.28 | Gemini | ||
| PG1617+175 | 2002 Apr 21 | (4140) | 0.23 | Gemini | |
| PG1626+554 | 2001 Apr 27 | 1170 | 0.18 | Gemini | |
| 2001 Jun 27 | 4530 | 0.16 | Gemini | ||
| PG1700+518 | 2001 Sep 12 | 990 | 0.13 | Gemini | |
| 2001 Sep 14 | 3270 | 0.14 | Gemini | ||
| 2001 Oct 10 | 1350 | 0.15 | Gemini | ||
| PG2130+099 | 2001 Jun 28 | (3180) | 0.18 | Gemini | |
| 2001 Oct 10 | 1080 | 0.15 | Gemini | ||
| 4C 31.63 | 2001 Jun 27 | 3540 | 0.13 | Gemini | |
| PG2214+139 | 2001 Sep 12 | 2070 | 0.17 | Gemini | |
| PG2251+113 | 2001 Sep 14 | 2910 | 0.14 | Gemini | |
| PG2349014 | 2001 Sep 12 | 3540 | 0.13 | Gemini |
.
| Name | Band | 2MASSaaFlux enclosed within a 8″ diameter disk. | N79,N87b,cb,cfootnotemark: | Others | This WorkccFlux enclosed within a 55 diameter disk. Typical uncertainty . Lower limits were derived in non-photometric conditions, and are accurate to ( level). | Adopted ValueddIf available, the photometry done in this work is adopted. If not, 2MASS values are adopted. |
|---|---|---|---|---|---|---|
| (mJy) | (mJy) | (mJy) | (mJy) | (mJy) | ||
| PG0026+129 | ||||||
| PG0050+124 | ||||||
| PG0050+124 | ||||||
| PG0050+124 | ||||||
| PG0157+001 | ||||||
| PG0804+761 | ||||||
| PG0804+761 | ||||||
| PG0838+770 | ||||||
| PG0844+349 | ||||||
| PG0923+201 | ||||||
| PG0923+201 | ||||||
| PG0953+414 | ||||||
| PG0953+414 | ||||||
| PG1001+054 | eeHyland & Allen (1982) | |||||
| PG1004+130 | ffSitko et al. (1982) | |||||
| PG1116+215 | ||||||
| PG1119+120 | ||||||
| PG1126041 | ||||||
| PG1211+143 | ||||||
| PG1229+204 | ||||||
| PG1302102 | eeHyland & Allen (1982) | |||||
| PG1307+085 | ||||||
| PG1309+355 | ||||||
| PG1351+640 | ||||||
| PG1411+442 | ||||||
| PG1411+442 | ||||||
| PG1411+442 | ||||||
| PG1426+015 | ||||||
| PG1435067 | ||||||
| PG1440+356 | ||||||
| PG1613+658 | ||||||
| PG1613+658 | ||||||
| PG1613+658 | ||||||
| PG1617+175 | ||||||
| PG1626+554 | ||||||
| PG1626+554 | ||||||
| PG1700+518 | ||||||
| PG1700+518 | ||||||
| PG2130+099 | ||||||
| PG2130+099 | ||||||
| 4C 31.63 | ||||||
| PG2214+139 | ggBalzano & Weedman (1981) | |||||
| PG2251+113 | ||||||
| PG2349014 | hhRudy et al. (1982) |
| Name/ | aaThe numbers in brackets give the fraction of the host’s luminosity originating from the bulge component (first number) and the disk component (second number) for the bulge+disk 2-D fit. | ||
|---|---|---|---|
| Filter | |||
| PG0026+129 | 1.05 | 1.08 | 1.04 [0.96/0.04] |
| PG0157+001 | 3.79 | 4.26 | 3.12 [0.64/0.36] |
| PG0804+761 | 1.54 | 1.90 | 1.05 [0.82/0.18] |
| PG0804+761 | 1.01 | 1.10 | 0.95 [0.68/0.32] |
| PG0838+770 | 4.43 | 5.05 | 3.58 [0.78/0.22] |
| PG0844+349 | 2.33 | 3.07 | 2.31 [0.69/0.31] |
| PG0923+201 | 1.12 | 1.24 | 1.15 [0.89/0.11] |
| PG0923+201 | 1.07 | 1.24 | 1.07 [0.94/0.06] |
| PG0953+414 | 0.94 | 0.90 | 0.88 [0.32/0.68] |
| PG0953+414 | 0.92 | 0.93 | 0.91 [0.98/0.02] |
| PG1001+054 | 0.97 | 1.03 | 0.93 [0.48/0.52] |
| PG1004+130 | 1.13 | 1.79 | 1.06 [0.65/0.35] |
| PG1116+215 | 1.20 | 1.13 | 1.13 [0.00/1.00] |
| PG1119+120 | 11.38 | 10.86 | 6.57 [0.70/0.30] |
| PG1126041 | 11.61 | 17.00 | 9.66 [0.64/0.36] |
| PG1211+143 | 1.28 | 1.28 | 1.30 [0.46/0.54] |
| PG1229+204 | 1.97 | 2.46 | 1.41 [0.65/0.35] |
| PG1302102 | 2.20 | 2.46 | 2.00 [0.74/0.26] |
| PG1307+085 | 1.42 | 2.15 | 1.19 [0.74/0.26] |
| PG1309+355 | 0.98 | 1.28 | 0.97 [0.92/0.08] |
| PG1351+640 | 0.88 | 0.88 | 0.87 [0.48/0.52] |
| PG1411+442 | 2.08 | 2.05 | 2.00 [0.86/0.14] |
| PG1411+442 | 9.20 | 8.77 | 8.57 [0.61/0.39] |
| PG1411+442 | 1.48 | 2.26 | 1.47 [0.96/0.04] |
| PG1426+015 | 1.53 | 1.52 | 1.37 [0.91/0.09] |
| PG1435067 | 0.98 | 1.04 | 0.96 [0.92/0.08] |
| PG1440+356 | 2.14 | 1.93 | 1.65 [0.84/0.16] |
| PG1613+658 | 4.30 | 6.67 | 3.95 [0.90/0.10] |
| PG1613+658 | 5.14 | 5.61 | 5.15 [0.99/0.01] |
| PG1613+658 | 6.15 | 13.17 | 5.97 [0.98/0.02] |
| PG1617+175 | 1.05 | 1.62 | 1.06 [0.98/0.02] |
| PG1626+554 | 0.89 | 0.86 | 0.84 [0.52/0.48] |
| PG1626+554 | 0.93 | 0.92 | 0.92 [0.79/0.21] |
| PG1700+518 | 5.48 | 5.52 | 5.38 [0.80/0.20] |
| PG1700+518 | 2.53 | 2.34 | 2.34 [0.00/1.00] |
| PG2130+099 | 4.57 | 3.13 | 3.28 [0.00/1.00] |
| PG2130+099 | 5.25 | 3.98 | 3.87 [0.42/0.58] |
| 4C 31.63 | 1.07 | 1.49 | 1.06 [0.84/0.16] |
| PG2214+139 | 1.79 | 3.26 | 1.49 [0.76/0.24] |
| PG2251+113 | 1.04 | 1.02 | 0.95 [0.53/0.47] |
| PG2349014 | 4.31 | 5.70 | 4.13 [0.82/0.18] |
| Name | -TypebbNeugebauer et al. (1979), Neugebauer et al. (1987). Flux enclosed within a 55 diameter disk | Visual Features | Adopted TypeddDp: disk present, E: Elliptical, B+D: Bulge+disk. Type “disk present” indicates the presence of a disk component, but does not exclude a small bulge in the inner part of the host. The final adopted host morphology is based upon minimum 2-D fitting of images modified by visual inspection of the image for signs of features indicative of the presence of a disk component. | NoteseeCC: Close (within 10kpc projected separation) compact companion (see text) | ||||
|---|---|---|---|---|---|---|---|---|
| Bar | Arms | DistccApparent degree of disturbance from visual inspection of the images: Disturbed (“yes”), Non disturbed (“no”) or Strongly disturbed (“str”). | ||||||
| PG0026+129 | () | no | no | no | E | |||
| PG0050+124 | no | yes | no | Dp | ||||
| PG0157+001 | +exp. | no | yes | str | ? | host asymmetry | ||
| PG0804+761 | yes | no | no | Dp | well-defined bar | |||
| PG0838+770 | yes | yes | yes | Dp | twisted bar+ring, well-defined bar | |||
| PG0844+349 | ffBad PSF; 2-D fit is uncertain. | no | yes | no | Dp | |||
| PG0923+201 | no | no | no | E | ||||
| PG0953+414 | (exp) | ? | no | no | – | – | host too faint to be classified | |
| PG1001+054 | () | yes | no | no | Dp | well-defined bar | ||
| PG1004+130 | no | no | no | E | ||||
| PG1116+215 | exp | no | no | yes | Dp | CC, host asymmetry | ||
| PG1119+120 | +exp. | no | no | no | B+D | CC | ||
| PG1126041 | +exp. | no | yes | no | B+D | CC | ||
| PG1211+143 | ? | no | no | – | – | host too faint to be classified | ||
| PG1229+204 | +exp. | yes | yes | no | B+D | well-defined bar | ||
| PG1302102 | no | no | no | E | CC | |||
| PG1307+085 | no | no | no | E | ||||
| PG1309+355 | no | no | no | E | ||||
| PG1351+640 | ? | no | no | no | ? | |||
| PG1411+442 | exp | +exp | no | ?ggUnclear whether features seen are arms or tidal debris. | str | ? | CC | |
| PG1426+015 | no | ?ggUnclear whether features seen are arms or tidal debris. | str | ? | CC | |||
| PG1435067 | no | no | no | E | ||||
| PG1440+356 | exp | no | yes | no | Dp | |||
| PG1613+658 | no | ?ggUnclear whether features seen are arms or tidal debris. | str | ? | CC | |||
| PG1617+175 | ffBad PSF; 2-D fit is uncertain. | no | no | no | E | |||
| PG1626+554 | (exp)ffBad PSF; 2-D fit is uncertain. | ?ffBad PSF; 2-D fit is uncertain. | no | no | no | – | bad PSF; unreliable 2-D fit | |
| PG1700+518 | exp | no | ?ggUnclear whether features seen are arms or tidal debris. | str | ? | CC | ||
| PG2130+099 | exp | +exp | no | yes | no | Dp | ||
| 4C 31.63 | no | no | no | E | ||||
| PG2214+139 | no | no | yes | E | concentric shells | |||
| PG2251+113 | ?ffBad PSF; 2-D fit is uncertain. | no | no | no | – | bad PSF; unreliable 2-D fit | ||
| PG2349014 | no | ?ggUnclear whether features seen are arms or tidal debris. | str | ? | CC | |||
| Name/ | Nuclear magn | Host magn | aaDefinitions of the parameters are given in equation 2. The bulge component is characterized by (effective surface brightness), (effective radius), (elongation) and (position angle). The disk component is characterized by (peak surface brightness), (effective radius), (elongation) and (position angle). | aaDefinitions of the parameters are given in equation 2. The bulge component is characterized by (effective surface brightness), (effective radius), (elongation) and (position angle). The disk component is characterized by (peak surface brightness), (effective radius), (elongation) and (position angle). | aaDefinitions of the parameters are given in equation 2. The bulge component is characterized by (effective surface brightness), (effective radius), (elongation) and (position angle). The disk component is characterized by (peak surface brightness), (effective radius), (elongation) and (position angle). | aaDefinitions of the parameters are given in equation 2. The bulge component is characterized by (effective surface brightness), (effective radius), (elongation) and (position angle). The disk component is characterized by (peak surface brightness), (effective radius), (elongation) and (position angle). | aaDefinitions of the parameters are given in equation 2. The bulge component is characterized by (effective surface brightness), (effective radius), (elongation) and (position angle). The disk component is characterized by (peak surface brightness), (effective radius), (elongation) and (position angle). | aaDefinitions of the parameters are given in equation 2. The bulge component is characterized by (effective surface brightness), (effective radius), (elongation) and (position angle). The disk component is characterized by (peak surface brightness), (effective radius), (elongation) and (position angle). | aaDefinitions of the parameters are given in equation 2. The bulge component is characterized by (effective surface brightness), (effective radius), (elongation) and (position angle). The disk component is characterized by (peak surface brightness), (effective radius), (elongation) and (position angle). | aaDefinitions of the parameters are given in equation 2. The bulge component is characterized by (effective surface brightness), (effective radius), (elongation) and (position angle). The disk component is characterized by (peak surface brightness), (effective radius), (elongation) and (position angle). | |||
|---|---|---|---|---|---|---|---|---|---|---|---|---|---|
| Filter | app. | abs. | app. | abs. | m/″2 | (″) | (rad) | m/″2 | (″) | (rad) | |||
| PG0026+129 | 13.05 | 25.93 | 14.46 | 24.52 | 22.16 | 10.62 | 0.21 | 0.01 | |||||
| PG0157+001 | 13.41 | 25.90 | 13.30 | 26.01 | 18.79 | 1.94 | 0.43 | 0.60 | 18.55 | 3.75 | 0.43 | 1.73 | |
| PG0804+761 | 12.22 | 25.94 | 14.24 | 23.92 | 17.08 | 1.74 | 0.28 | 0.82 | |||||
| PG0804+761 | 10.67 | 27.49 | 14.44 | 23.72 | 18.02 | 3.39 | 0.61 | 0.82 | |||||
| PG0838+770 | 14.31 | 24.48 | 13.89 | 24.90 | 17.26 | 2.97 | 0.59 | 2.85 | |||||
| PG0844+349 | 13.35 | 23.82 | 13.65 | 23.52 | 16.04 | 1.38 | 0.25 | 0.53 | |||||
| PG0923+201 | 14.52 | 25.16 | 15.46 | 24.22 | 22.25 | 5.73 | 0.14 | 1.18 | |||||
| PG0923+201 | 13.53 | 26.15 | 14.73 | 24.95 | 21.20 | 4.53 | 0.07 | 0.79 | |||||
| PG0953+414 | 14.39 | 25.80 | 15.25 | 27.77 | 22.25 | 3.58 | 0.42 | 3.07 | 20.95 | 7.91 | 0.40 | 1.62 | |
| PG0953+414 | 12.42 | 24.94 | 13.86 | 26.33 | 18.29 | 0.95 | 0.90 | 1.55 | 22.02 | 8.75 | 0.90 | 1.98 | |
| PG1001+054 | 14.21 | 25.06 | 16.68 | 22.59 | 19.59 | 1.61 | 0.12 | 0.56 | |||||
| PG1004+130 | 13.84 | 26.41 | 14.12 | 26.13 | 22.00 | 10.04 | 0.10 | 2.94 | |||||
| PG1116+215 | 12.61 | 26.90 | 15.96 | 23.55 | 17.50 | 0.99 | 0.33 | 0.04 | |||||
| PG1119+120 | 13.30 | 23.32 | 12.39 | 24.23 | 17.22 | 0.91 | 0.43 | 2.37 | 16.07 | 1.49 | 0.37 | 1.38 | |
| PG1126041 | 12.49 | 24.53 | 12.63 | 24.39 | 17.94 | 2.65 | 0.79 | 1.21 | 16.05 | 1.65 | 0.52 | 1.00 | |
| PG1211+143 | 12.37 | 25.33 | 14.44 | 23.26 | 21.98 | 4.99 | 0.00 | 2.41 | 20.19 | 7.49 | 0.51 | 0.85 | |
| PG1229+204 | 13.56 | 23.57 | 12.18 | 24.95 | 17.59 | 1.57 | 0.24 | 1.51 | 16.94 | 3.38 | 0.59 | 2.67 | |
| PG1302102 | 13.74 | 26.88 | 14.25 | 26.37 | 19.89 | 3.14 | 0.46 | 0.81 | |||||
| PG1307+085 | 13.97 | 25.22 | 14.71 | 24.48 | 21.38 | 4.70 | 0.00 | 0.64 | |||||
| PG1309+355 | 14.03 | 25.57 | 13.71 | 25.89 | 19.53 | 3.15 | 0.18 | 1.46 | |||||
| PG1351+640 | 12.02 | 25.84 | 13.77 | 24.09 | 20.83 | 3.82 | 0.00 | 0.64 | 15.48 | 0.63 | 0.00 | 3.04 | |
| PG1411+442 | 13.48 | 24.43 | 14.39 | 23.52 | 21.01 | 6.32 | 0.52 | 1.28 | 17.20 | 0.82 | 0.55 | 2.36 | |
| PG1411+442 | 12.45 | 25.46 | 13.45 | 24.46 | 18.82 | 1.30 | 0.15 | 1.09 | 17.83 | 2.85 | 0.56 | 1.35 | |
| PG1411+442 | 11.52 | 26.39 | 13.54 | 24.37 | 19.84 | 5.90 | 0.57 | 1.28 | 15.99 | 0.62 | 0.83 | 2.50 | |
| PG1426+015 | 11.37 | 26.46 | 12.17 | 25.66 | 18.61 | 5.33 | 0.42 | 2.45 | 14.88 | 0.65 | 0.60 | 0.36 | |
| PG1435067 | 14.72 | 23.98 | 15.25 | 23.45 | 21.13 | 2.97 | 0.00 | 2.55 | |||||
| PG1440+356 | 11.51 | 26.12 | 12.80 | 24.84 | 14.63 | 1.02 | 0.18 | 2.35 | |||||
| PG1613+658 | 13.56 | 25.19 | 13.76 | 24.99 | 20.98 | 7.90 | 0.22 | 0.82 | 15.99 | 0.30 | 0.90 | 2.14 | |
| PG1613+658 | 12.90 | 25.85 | 12.88 | 25.87 | 19.98 | 6.94 | 0.25 | 0.95 | 15.91 | 0.68 | 0.46 | 2.91 | |
| PG1613+658 | 11.88 | 26.99 | 12.11 | 26.64 | 18.34 | 4.00 | 0.14 | 0.88 | 17.08 | 0.86 | 0.61 | 2.77 | |
| PG1617+175 | 11.12 | 27.30 | 13.40 | 25.02 | 21.73 | 14.34 | 0.00 | 0.08 | |||||
| PG1626+554 | 13.71 | 25.12 | 14.33 | 25.87 | 20.34 | 2.08 | 0.13 | 1.69 | 18.53 | 1.99 | 0.07 | 0.32 | |
| PG1626+554 | 12.96 | 24.50 | 13.11 | 25.72 | 17.76 | 0.30 | 0.01 | 1.13 | 15.61 | 0.59 | 0.03 | 1.30 | |
| PG1700+518 | 13.28 | 27.47 | 14.62 | 26.13 | 20.85 | 4.29 | 0.44 | 1.98 | 15.80 | 0.60 | 0.74 | 1.59 | |
| PG1700+518 | 12.04 | 28.71 | 15.56 | 25.19 | inf | 2.11 | 0.54 | 1.24 | 15.87 | 1.04 | 0.81 | 1.70 | |
| PG2130+099 | 12.05 | 25.08 | 13.60 | 23.53 | 15.54 | 1.25 | 0.40 | 2.27 | |||||
| PG2130+099 | 10.76 | 26.37 | 12.72 | 24.41 | 14.42 | 1.08 | 0.35 | 2.24 | |||||
| 4C 31.63 | 13.68 | 27.09 | 14.25 | 26.52 | 20.97 | 6.47 | 0.37 | 0.64 | |||||
| PG2214+139 | 12.41 | 24.83 | 12.37 | 24.87 | 18.07 | 2.72 | 0.07 | 3.02 | |||||
| PG2251+113 | 13.51 | 27.51 | 14.27 | 26.75 | 19.77 | 1.43 | 0.34 | 0.21 | 20.79 | 10.00 | 0.16 | 0.56 | |
| PG2349014 | 13.54 | 25.93 | 13.57 | 25.90 | 20.41 | 6.19 | 0.38 | 0.22 | 19.32 | 3.60 | 0.51 | 1.67 | |
| Number bbBest 2-D fit(s) correspond to the fit with minimum in each band as listed in Table 6. Parentheses indicate 2-D fits with low confidence level (difference between and is between 0.02 and 0.05).The host type adopted in Table 5 does not necessarily match the lowest value shown here, as morphological structures in the images is also taken into account. As discussed in the text, classification from values alone is unreliable. In columns 2 (Nuclear Mad.) to 11 (), the results of the fit corresponding to the final host classification in Table 5 are given. For hosts that are unclassified (PG0953+414, PG1211+143, PG1411+442, PG1426+015, PG1613+658, PG1626+554, PG1700+518 and PG2349014), the results of the bulge+disk fits are shown. | Nucleus | Host | ||||||||
|---|---|---|---|---|---|---|---|---|---|---|
| med. | ave. | med. | ave. | med. | ave. | |||||
| Elliptical | 10 | 26.04 | 25.93 | 0.24 | 24.91 | 25.24 | 0.27 | 1.83 | 2.21 | 0.40 |
| Disk present | 7 | 25.08 | 25.20 | 0.35 | 23.55 | 23.78 | 0.26 | 4.17 | 6.58 | 2.61 |
| Bulge+Disk | 3 | 23.57 | 23.81 | 0.30 | 24.39 | 24.52 | 0.18 | 0.43 | 0.62 | 0.22 |
| Unknown | 7 | 25.85 | 25.99 | 0.24 | 25.87 | 25.39 | 0.28 | 1.23 | 2.16 | 0.54 |
| Non-disturbed | 18 | 25.40 | 25.38 | 0.25 | 24.47 | 24.62 | 0.24 | 1.93 | 2.86 | 0.56 |
| Disturbed | 3 | 24.83 | 25.40 | 0.62 | 24.87 | 24.44 | 0.36 | 0.96 | 7.84 | 5.73 |
| Strongly disturbed | 6 | 25.88 | 26.02 | 0.27 | 25.88 | 25.61 | 0.26 | 1.13 | 1.68 | 0.39 |
| Total | 27 | 25.57 | 25.52 | 0.20 | 24.58 | 24.82 | 0.19 | 1.69 | 3.15 | 0.81 |
| Name | log | bbSee text for definitions of , the “Infrared Bump” luminosity, and , the “Blue Bump” luminosity. | ||||
|---|---|---|---|---|---|---|
| (mJy) | (mJy) | (mJy) | (mJy) | () | ||
| PG0026+129 | ||||||
| PG0050+124 | ||||||
| PG0157+001 | ||||||
| PG0804+761 | ||||||
| PG0838+770 | ||||||
| PG0844+349 | ||||||
| PG0923+201 | ||||||
| PG0953+414 | ||||||
| PG1001+054 | ||||||
| PG1004+130 | ||||||
| PG1116+215 | ||||||
| PG1119+120 | ||||||
| PG1126041 | ||||||
| PG1211+143 | ||||||
| PG1229+204 | ||||||
| PG1302102 | ||||||
| PG1307+085 | ||||||
| PG1309+355 | ||||||
| PG1351+640 | ||||||
| PG1411+442 | ||||||
| PG1426+015 | ||||||
| PG1435067 | ||||||
| PG1440+356 | ||||||
| PG1613+658 | ||||||
| PG1617+175 | ||||||
| PG1626+554 | ||||||
| PG1700+518 | ||||||
| PG2130+099 | ||||||
| 4C 31.63 | ||||||
| PG2214+139 | ||||||
| PG2251+113 | ||||||
| PG2349014 |
| Number | MedianaaThe median of an even number of values is the average of the two central values. | MedianaaThe median of an even number of values is the average of the two central values. | MedianaaThe median of an even number of values is the average of the two central values. | Mean [] bbFor the QSO with upper limit (PG2251+113), the 1 upper limit is used to derive both the mean and its standard deviation. | |
|---|---|---|---|---|---|
| (mag) | log () | ||||
| Elliptical | 10 | 23.88 | 11.61 | 0.27 | 0.29 [0.14] |
| Disk present | 8 | 22.52 | 11.49 | 0.53 | 0.81 [0.56] |
| Bulge+Disk | 3 | 21.63 | 11.12 | 0.68 | 0.66 [0.04] |
| Unknown ccIncludes 6 hosts classified in Table 5 as “strongly disturbed”. | 11 | 23.85 | 11.77ddThe median was determined without including PG 2251+113, for which there is only an upper limit on . | 0.38 | 0.54 [0.39] |
| Non-disturbed | 21 | 23.16 | 11.42ddThe median was determined without including PG 2251+113, for which there is only an upper limit on . | 0.42 | 0.47 [0.35] |
| Disturbed | 3 | 22.19 | 11.47 | 0.46 | 0.85 [0.67] |
| Strongly disturbed | 6 | 23.93 | 11.85 | 0.67 | 0.73 [0.39] |
| Unknown | 2 | 24.04 | 11.67 | 0.27 | 0.27 [0.10] |
| Total | 32 | 23.23 | 11.52ddThe median was determined without including PG 2251+113, for which there is only an upper limit on . | 0.42 | 0.54 [0.42] |