X-ray Absorption in Type II Quasars: Implications for the Equatorial Paradigm of Broad Absorption Line Quasars
Abstract
In this article, the hydrogen column densities derived from X-ray observations of type II (hidden) quasars and broad absorption line quasars (BALQSOs) are compared. These column densities represent the amount of absorbing material between the X-ray source and the observer. A sample of type II QSOs with strong narrow emission lines, weak UV continuum and no broad emission lines that also have deep X-ray observations was collected from the literature for analysis. The standard model of equatorial BAL (broad absorption line) winds predicts that the column densities of this type II QSO sample should significantly exceed BALQSO column densities. Based on the existing published deep hard X-ray observations this does not seem to be true, the BALQSO absorption columns are anomalously large. Actually, the limited existing data indicate that BALQSOs have column densities which are larger than the type II QSO column densities at a statistically significant level. The implication to BAL outflows and the fundamental physical geometry of QSOs is discussed.
1 Introduction
A popular paradigm for broad absorption line quasars (BALQSO) is that the UV broad absorption lines (BALs) form in an equatorial wind that flows just above the edge of a dusty molecular torus. This notion is a refinement of the what is called the ”standard model for AGN,” consisting of a hot accretion flow onto a black hole and a surrounding torus of molecular gas (Antonucci, 1993). It is widely believed that all radio quiet quasars have BAL outflows, but the designation of a quasar as a BALQSO depends on whether the line of sight intersects the solid angle subtended by the outflow. Within this extension of the standard model of AGN, along lines of sight to the accretion disk that approach from high latitudes, within of the pole, one views a conventional quasar spectrum without BALs, a type I AGN. About 20% of QSOs show BAL outflows, loosely defined as UV absorbing gas that is blue shifted at least 5,000 km/s relative to the QSO rest frame and displaying a spread in velocity of at least 2,000 km/s (Weymann, 1997; Hewett and Foltz, 2003). For lines of sight to the accretion disk at intermediate latitudes, say , one classifies the object as a BALQSO since a quasar spectrum is seen except for the the blue sides of the UV broad emission lines (BEL) which are absorbed, i.e., the near side of the BEL is obscured. At lines of sight even closer to the equatorial plane, , one encounters the dusty torus, the quasar is completely obscured; both the red and blue side of the BELs are attenuated and the central continuum optical/UV source is hidden from view, these are known as type II quasars. Consequently, in general, there is a larger attenuating column along lines of sight to the active nucleus for type II quasars than BALQSOs, if the paradigm is correct.
We check this prediction by comparing the column densities toward the nuclear X-ray source measured by XMM and Chandra in an archival sample of spectral fits in the existing literature on BALQOs and type II QSOs. This has only recently been made possible. In the past 5 years, some high quality bona fide BALQSOs data has been reduced and published () and a somewhat larger sample of quality type II QSO X-ray spectra () has appeared in the literature. In this article, we define type II QSOs (QSOIIs, hereafter) as strong narrow emission line objects with a weak UV continuum, no broad emission lines and a hidden nucleus of quasar luminosity that is verified by IR or X-ray observation. Contrary to the expectations of the the equatorial wind model of BALQSOs, preliminary data indicate that QSOIIs actually have a distribution of X-ray absorbtion hydrogen column densities that are statistically smaller (at the confidence level by a Mann-Whitney test) than the distribution of X-ray absorption columns measured for BALQOs. It is likely that this result is largely sample selection dependent, but the weaker claim that there is no statistical support for the hypothesis, QSOII X-ray absorption column densities are larger than BALQSO X-ray absorption column densities, seems well justified by the observations to date.
The data is intriguing even though it is based on small samples and certainly deserves further study. The implication, if the trend holds with more data, is that there is an additional absorbing column that obscures the X-ray emission in some or all BALQSOs that is not encountered for low latitude lines of sights characteristic of QSOIIs. In the equatorial wind model, this extra absorber would be the so-called ”hitchhiking gas” that shields the BAL wind from the X-ray source (Murray et al, 1995). However, this is by necessity located at low latitudes and should be encountered by most if not all type II lines of sight. By contrast polar BAL wind models, naturally produced an additional X-ray absorber along the polar axis, so this extra absorber would not be detected in QSOIIs (Punsly, 1999a, b). The comparison of column densities in QSOIIs and BALQSOs is a vital clue for understanding the fundamental underlying physical configuration that constitutes a QSO.
2 The Deep X-ray Sample
In order to accurately determine large X-ray absorbing columns, , high energy (10-20 keV in the quasar rest frame) observations are required. This essentially is a consequence of the fact that at the absorbing column is virtually black to soft X-rays (Murray et al, 1995). One needs higher energy X-ray measurements to determine the continuum spectral index, so the intrinsic background flux can be extrapolated back to the soft X-ray regime. In Punsly and Lipari (2005) anecdotal examples of misleading observations of BALQSOs that were used to estimate based on very few or no hard photons were given. The most notable examples are MRK 231 for which the column density was under estimated by two orders of magnitude for years, Braito et al (2004), and PHL 5200 which was under estimated by over 3 orders of magnitude, Brinkmann et al (2002). Thus, the ROSAT soft X-ray observations of Green and Mathur (1996) are inadequate for restricting the column density. Also, the survey work of Gallagher et al (2006) with detected hard photons for the vast majority of the sources is unsuitable for this analysis. The lessons learned form past experience is that there are no shortcuts to attaining even moderately accurate estimates of the X-ray absorption columns in BALQSOs. These are necessarily difficult observations that require very long exposures. Secondly, the fluxes from an obscured nucleus can be so attenuated that it can be swamped by any nearby weak X-ray source (Brinkmann et al, 2002). Thus, high resolution is preferred. These limitations indicate that reliable results can only be obtained from archival Chandra and XMM data for samples of highly attenuated sources such as QSOIIs and BALQSOs.
An important clarification of the BALQSO sample is that these are bona fide BALQSOs, in particular the so-called ”mini-BALQSOs” are excluded (such as RXJ 0911.4+0551, Morgan et al (2001) and PG 1115+080 Chartas et al (2003)). This class of sources has been preferentially proposed for observation as a premeditated expedience to get X-ray bright objects that are BALQSO-like without the risk of low photon counts inherent to BALQSOs observations (Chartas et al, 2003). Thus, they are likely to contaminate the statistics of the small BALQSO sample with their lower absorption columns.
| Source | z | type | Column Density | X-ray reference |
|---|---|---|---|---|
| () | ||||
| LBQS 2212-1759 | 2.217 | BAL | 250 | Clavel et al (2006) |
| MRK 231 | 0.042 | BAL | Braito et al (2004) | |
| PHL 5200 | 1.98 | BAL | Brinkmann et al (2002); Mathur et al (2001) | |
| 1413+117 | 2.56 | BAL | Chartas et al (2004); Oshima et al (2001) | |
| CDF-S 202 | 3.700 | II | Norman et al (2002); Tozzi et al (2006) | |
| CDF-S 153 | 1.54 | II | Tozzi et al (2006) | |
| IRAS 09104+4109 | 0.442 | II | Iwasawa et al (2001) | |
| IRAS 07598+6508 | 0.148 | BAL | Imanishi and Terashima (2004) | |
| PG 0946+301 | 1.233 | BAL | 10 | Mathur et al (2000) |
| SDSSJ 1226+0131 | 0.732 | II | Ptak et al (2006) | |
| CDF-N 171 | 1.993 | II | Alexander et al (2005) | |
| CDF-N 190 | 2.005 | II | Alexander et al (2005) | |
| CXO 52 Lynx | 3.288 | II | 5 | Sturm et al (2006) |
| PG 1254 + 047 | 1.024 | BAL | Sabra et al (2001) | |
| CDF-S 27 | 3.064 | II | Tozzi et al (2006) | |
| CDF-S 51 | 1.097 | II | Tozzi et al (2006) | |
| SDSSJ 0801+4112 0.556 | 0.556 | II | Ptak et al (2006) | |
| CDF-S 54 | 2.561 | II | Tozzi et al (2006) | |
| H 05370043 | 1.797 | II | Perola et al (2004) | |
| SBS 1524 + 517 | 2.85 | BAL | Shemmer et al (2006) | |
| APM 08279+52550.6 | 3.91 | BAL | Chartas et al (2002); Hasinger et al (2002) | |
| H 15800019 | 1.957 | II | Perola et al (2004) | |
| Source | z | type | Column Density | X-ray reference |
|---|---|---|---|---|
| () | ||||
| PG 2112+059 | 0.466 | BAL | Gallagher et al (2004) | |
| 1246-057 | 2.24 | BAL | Grupe et al (2003) | |
| H 05370123 | 1.153 | II | Perola et al (2004) | |
| SBS1542+241 | 2.361 | BAL | 0.5 | Grupe et al (2003) |
| LH 12A | 0.99 | II | Sturm et al (2006) | |
| XBS J0216-0435 | 1.987 | II | Severgnini et al (2006) | |
| SDSS J1641+3858 | 0.596 | II | Ptak et al (2006) | |
| LH 14Z | 1.38 | II | 0.4 | Sturm et al (2006) |
| UM425 | 1.465 | BAL | Aldcroft and Green (2003) | |
| CDF-S 117 | 2.573 | II | Tozzi et al (2006) | |
| XBSJ204043.4-004548 | 0.615 | II | Cacciangia et al (2004) | |
| XBSJ013240.1-133307 | 0.562 | II | Cacciangia et al (2004) | |
| H 50900013 | 1.261 | II | Perola et al (2004) | |
| LH H57 | 0.792 | II | 0.25 | Sturm et al (2006) |
| SDSS J0210-1001 | 0.540 | II | Ptak et al (2006) | |
| AXJ0144.9-0345 | 0.620 | II | Georgantopoulos et al (2006) | |
| CDF-S 18 | 0.979 | II | Tozzi et al (2006) | |
| CDF-S 31 | 1.603 | II | Tozzi et al (2006) | |
| H 0537011a | 0.981 | II | Perola et al (2004) | |
| H 05370016 | 0.995 | II | Perola et al (2004) | |
| LH 28B | 0.205 | II | 0.02 | Sturm et al (2006) |
| CDF-N 77 | 2.416 | II | Alexander et al (2005) | |
| H 03120006 | 0.680 | II | Perola et al (2004) | |
| H 50900001 | 1.049 | II | Perola et al (2004) | |
Over the past five years a sample of 13 BALQSOs with suitable X-ray observations has appeared in the literature (see table 1). Only recently, observations of QSOIIs, of similar quality, have been published (Alexander et al, 2005; Belsole et al, 2006; Evans et al, 2006; Ptak et al, 2006; Sturm et al, 2006; Tozzi et al, 2006; Perola et al, 2004). Thus, a comparison of BALQSO and QSOII absorbing columns is possible for the first time.
The QSOII observations are of two types, radio loud and radio quiet. The radio loud (radio loud type II quasars are usually referred to as narrow line FR II radio galaxies) X-ray observations of Belsole et al (2006); Evans et al (2006) have a resolution of only kpc for Chandra observations and an order of magnitude worse for XMM. Thus, contamination of the accretion flow X-ray emission from synchrotron and inverse Compton emission from the base of the radio jet makes the interpretation of this data, for the purposes of this study, extremely suspect. It is curious that the inclusion of these sources does not statistically alter the conclusions of this article. The sample of QSOIIs in this article is chosen to be radio quiet with spectroscopically determined redshifts. The quasar nature of the hidden nucleus is established by IR, X-ray and narrow line luminosity.
Table 1 is compiled from QSOIIs observed with Chandra and XMM that appear in the literature with sufficient sensitivity to detect the hard X-ray continuum (i.e., typically with more than 100 total counts from 0.5 keV to 8 keV). We make the distinction of Ptak et al (2006) to exclude sources with a de-absorbed (intrinsic) X-ray luminosity below the Seyfert 1/ QSO dividing line, i.e , from 0.5 keV to 10 keV. It is crucial to segregate QSOIIs from Seyfert 2 galaxies, because Seyfert galaxies are not the parent population for BALQSOs. Although Seyfert 1 galaxies have absorption outflows, the terminal velocities are much lower than BALQSOs (Weymann, 1997). The phenomenon of BALs is associated with the high luminosity AGN, QSOs. Thus, in this context it is very important to make the distinction between QSOs and Seyfert galaxies.
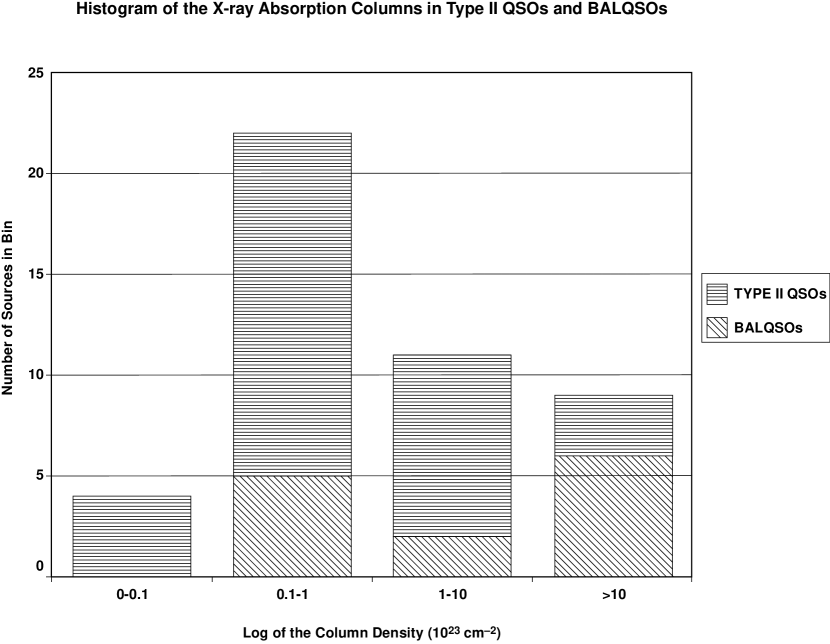
The results of the best fit column densities are tabulated in table 1 and figure 1. All of the data in table 1 is taken from Chandra or XMM observations except for PG 0946+301. This was a deep pointed observation with ASCA from Mathur et al (2000) that was extremely long, 100ks. It is possible that a deeper observation with XMM or Chandra would produce a better spectrum or resolve a nearby weak background X-ray source that would indicate a larger value of than the one in the table.
3 Selection Effects
The sample in table 1 is biased by many selection effects which we discuss below.
3.1 Selection Effects in the QSO II Sample
The QSOIIs in Sturm et al (2006) were selected on the basis of X-ray detections by XMM with high intrinsic absorption (an average ). Thus, this method selects against low intrinsic absorption sources, and Compton thick sources, , which might not be X-ray detections (except in the cases in which partial covering or scattered X-rays are significant). The sample picks X-ray detections from the 1 Msec observation of the Lockman hole with XMM, with red colors and ISCOCAM detections. All the sources also have strong narrow lines, confirming the hidden quasar inside and making the existence of a completely hidden BEL very likely. Similarly, the 1Ms Chandra Deep Field South QSOII sample of Tozzi et al (2006) requires and has the same selection bias as Sturm et al (2006). The cutoff for quality spectral fits in this sample was determined by Tozzi et al (2006) to be 120 counts, we lower this limit down to 100 counts in order to help offset the selection bias against highly absorbed sources in this flux limited sample. Many of the sources in table 1 come from the HELLAS2XMM survey, which are designated by the prefix H in table 1 (Perola et al, 2004). Again, this sample selects against Compton thick sources. A few Chandra Deep Field North sources have been found in Alexander et al (2005) with counts and a spectral identification in Chapman et al (2005) as an AGN based on narrow line emission and without broad line emission. Note our selection criteria excludes the sources in Alexander et al (2005) that have hidden quasars based on X-ray observations, but do not have the emission line signature indicative of an AGN in Chapman et al (2005). Supplementing this is the sample of Ptak et al (2006) which is selected from the SDSS survey of sources without a strong UV continuum, no broad emission lines, but strong narrow lines. This method does not select against Compton thick absorption a priori, but in practice observations of highly absorbed sources will lack enough counts to adequately fit a spectrum. The X-ray observations of QSOIIs in Polletta et al (2006) have too few photons to produce a reliable spectral fit for our purposes.
Using the selection criteria described in the last section, some sources from Sturm et al (2006) have been excluded from table 1, LH 901A is a Seyfert II galaxy and AX J0843+2942 is radio loud. Sources were also excluded from the sample of Ptak et al (2006). Based on O III luminosity, Ptak et al (2006) classify SDSS J0115+0015 and SDSS J 0243 + 0006 as Seyfert II galaxies. The sources SDSS J0801+4412, SDSS J0842+3625 and SDSS J1232+0206 all have exposures of less than 10 ks and the observations were unable to collect enough photons to constrain the X-ray spectrum. The QSOIIs from Tozzi et al (2006) are restricted to those AGN with spectroscopic redshifts and no broad lines from Szokoly et al (2004), leaving only 13 sources. Due to the low number of detected photons, total counts, some of the X-ray spectral fits have too much scatter for inclusion in table 1. In particular, the modest absorption () source, CDFS-112 at and the highly absorbed sources CDFS -531, CDFS - 263, CDFS-268 have X-ray data that are not adequately fit by the models of Tozzi et al (2006).
3.2 Selection Effects in BALQSO Sample
The BALQSO X-ray observations typically select the brightest X-ray objects to insure the best chance of successful detection of sufficient counts to determine a reasonable spectral fit. The ASCA deep survey of BALQSOs in Gallagher et al (1999) used ks exposures to place lower limits on , indicating that 5 BALQSOs sources are likely candidates to be Compton thick with deep Chandra or XMM observations, IRAS 0759+6508, LBQS 2111-4335, PG 1700+518, PG 0043+034 and 0043+008. There are no followup observations of these sources by any of these authors with Chandra or XMM in the literature. Yet some members of this research team chose to observe PG 2112+059 which was known to be X-ray bright from previous ROSAT and ASCA observations (Gallagher et al, 2001) and SBS 1547+517 which was known to be X-ray bright from Beppo SAX observations in Brandt et al (1999). Similarly Green et al (2001) performed a snapshot survey of BALQSOs with Chandra and some of the research team chose to study the two brightest sources UM 425, SBS 1542+541 and the brightest ROSAT BALQSO from Green and Mathur (1996), 1246-0542 with deeper observations. There are are no published Chandra or XMM data on the preponderance of weaker sources in the snapshot survey of Green et al (2001). The point of this is merely to illustrate a strong selection effect produced five of the six BALQSO values of in table 1.
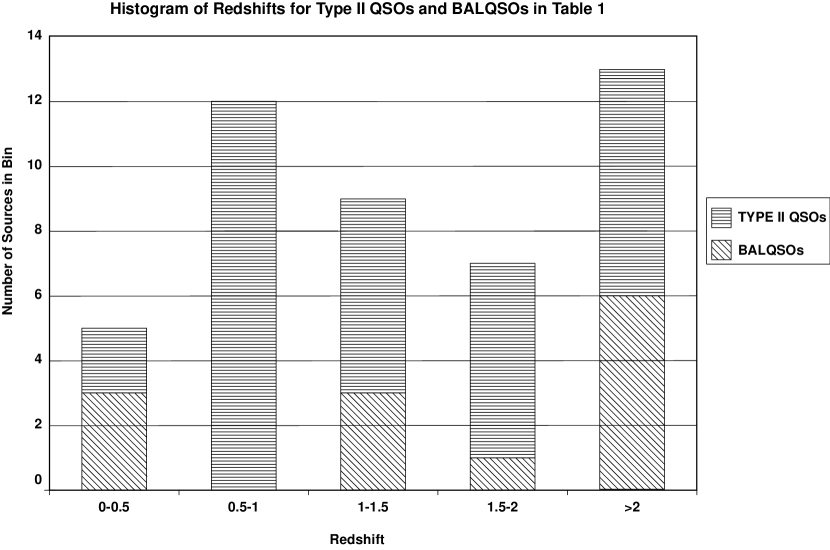
Another selection effect can be seen from the redshift distribution in the histogram of figure 2. The BALQSOs are selected by optical considerations which usually is the shifting of the CIV absorption trough into the visible band. Thus, these are predominantly sources with . The QSOIIs are mostly X-ray selected so there are more sources as a result of the flux limitations of the deep surveys. It is quite possible that selecting BALQSOs from flux limited X-ray samples would alter the results of this paper. However, the preponderance of high redshift BALQSOs in table 1 does not explain the anomalously large column densities of BALQSOs relative to QSOIIs because most of largest BALQSO column densities in table 1 are found at low redshift.
3.3 Can Column Densities be Compared?
The QSOII sample is not intended to be representative of the distribution of for the entire hidden quasar population. However, the QSOII sources found by the methods above and tabulated in table 1 are sufficient for the purposes of comparison with BALQSOs within the context of the BAL equatorial wind extension of the standard model. In particular, this (or any) sample of QSOIIs, by definition, not only has an obscured blue side of the UV BEL region (the near side of the equatorial wind model), as for BAL QSOS, but the red side (far side) of the UV BEL region as well as the central optical/UV continuum are also obscured. Thus, the ubiquity of BAL winds in all radio quiet QSOs within this extension of the standard model, implies that any subsample of QSOIIs should be more obscured than BALQSOs on average. In particular, a BALQSO has two dominant components to the absorption column density, , which is a filter that absorbs X-rays from the central continuum that allows the ionization state to be low enough so that Lithium-like atoms can form in the BAL wind zone farther out, away (Murray et al, 1995). Secondly there is the absorption in the wind itself, which is virtually negligible, (Murray et al, 1995). The shielding gas might actually just be the dense base of the BAL wind (Proga et al, 2000; Proga and Kallman, 2004).
The QSOIIs have an additional absorbtion component from the intervening dusty torus . A line of sight through the torus must also pass through the shielding gas on the way to the central X-ray source. This is a very important constraint on the model. The shielding gas has its highest density just above the accretion disk in both the theoretical treatment of Murray et al (1995) and in the numerical results of Proga and Kallman (2004). This is simply a consequence of the mass conservation law as the shielding gas has its source in a low velocity outflow emerging from the disk atmosphere or corona. To be precise, the type II lines on sight should encounter a larger than BALQSO lines of sight in the equatorial wind model. Thus, the typical QSOII absorbing column should exceed the typical BALQSO absorbing column, , by an amount roughly equal to the typical absorption column through the dusty torus.
It is not trivial to argue that the type II lines of sight might miss the shielding gas, i.e. the shielding gas is suspended at high latitude above the disk. This is a serious modification to the model for two reasons. First, it changes the source of the shielding gas to an unknown entity which is now adhoc. Secondly, coronal X-rays could now pass underneath the shielding gas and over-ionize the base of the wind zone. This would prevent resonant absorption from transferring sufficient moment to launch the BAL wind vertically away from the disk, its mass source (Murray et al, 1995). Such a modification is a significant departure from the equatorial wind model that is considered credible largely because of its physical explanation of the X-ray shielding mechanism.
4 Interpretation of the Results
The data in table 1 is summarized in the histogram in figure 1. The data does not support the hypothesis that QSOIIs have larger X-ray attenuating columns than BALQSOs (as expected from the equatorial wind model). In fact a Mann-Whitney test shows that the BALQSOs have larger values of than those of the QSOIIs in table 1 at the significance level. The result is also true above the significance level in Kolmogorov-Smirnov two sample test. One would have to add 11 Compton thick QSOII sources to the sample in order for the significance level to drop below in the Mann-Whitney test. The discussion in the previous section shows that there are some strong selection effects as well as a small sample size that could make a general interpretation of the results in table 1 misleading. However, there has certainly been no effort to select for the most attenuated BALQSOs, but actually some effort to the contrary. For example, 5 of the 13 of the BALQSOs were selected for deep observation because they were particularly X-ray bright for BALQSOs (see section 3.3). Removing the 5 BALQSOs chosen for deep observation by X-ray brightness increases the significance to by a Mann-Whitney test.
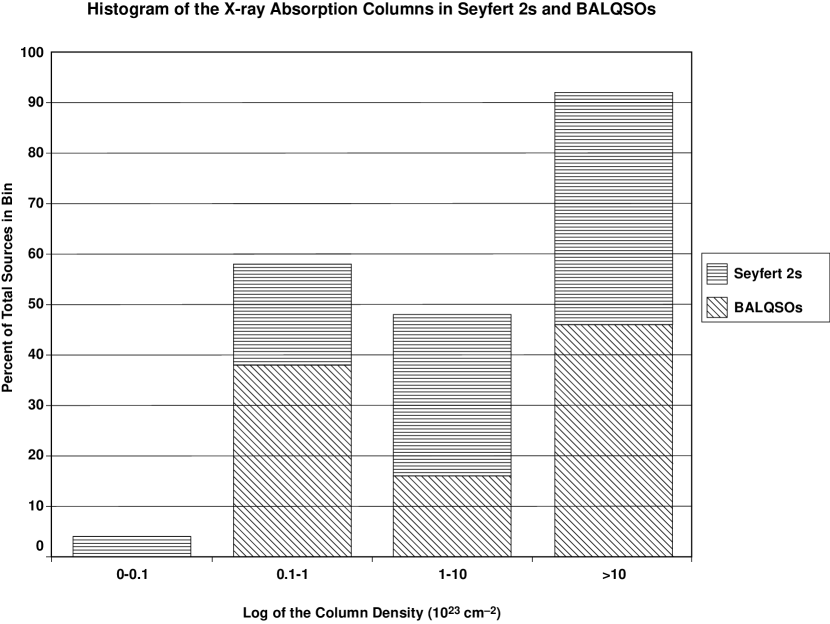
The primary question is how many Compton thick QSOIIs were missed by selection effects. It seems that as more deep X-ray spectra of QSOIIs become available that the statistical significance of the result might well diminish or disappear due the the inclusion of many weaker Compton thick sources. As noted above, only 11 more Compton thick QSOIIs would remove the statistical significance of the result. In order to investigate this possibility, one can compare the absorption columns in nearby Seyfert 2 galaxies to see if it reasonable to expect a large fraction of Compton thick QSOIIs. This exercise is pragmatically motivated since the local Seyfert 2 population is easier to study in flux limited samples which can still detect nearby Compton thick sources. However, this expedience goes directly against the admonishment of section 2 that Seyfert galaxies do not have a direct relationship to BALQSOs, but it can yield some ”ballpark” type of information. Figure 3 is a histogram of the distribution of Seyfert 2 galaxy hydrogen absorption columns given in Wilkes et al (2002) compared to the BALQSO sample presented here. The data is normalized so each bin represents the percent of that sample that is in the corresponding X-ray absorption column range. The distribution for Seyfert 2s and BALQSOs are incredibly similar. We do not compare them statistically because there is no physical basis for Seyferts to be the parent population of BALQSOs as discussed in section 2. However, the Seyfert 2 distribution indicates that of QSOIIs might be Compton thick which seems consistent with the results of Tozzi et al (2006). Thus, a deep survey should produce enough Compton thick sources to remove the statistical significance of the result that BALQSOs have larger values of than those of the QSOIIs in table 1.
However, it is not the claim of this article that BALQSOs have larger values of than those of the QSOIIs. The claim of this article is that the observations do not support the notion that is larger in QSOIIs than BALQSOs. In particular, the Seyfert 2 results in figure 3 do not suggest that deeper X-ray observations of QSOIIs will reverse the trend in figure 1 (especially if more X-ray weak BALQSOs are observed), This is primarily a consequence of the significant number of QSOIIs with seen in table 1 and in the sample of Tozzi et al (2006), compared to the majority of BALQSOs with . Quantitatively speaking, one would have to add 145 more QSOIIs to the sample in table 1 that are Compton thick in order to reverse the trend and attain a result that the QSOII values of are larger than the BALQSO values of at a marginal level of statistical significance. This would correspond to of the QSOIIs being Compton thick which is not supported by the Seyfert 2 data in figure 3. As discussed in section 3.3, if the two populations are statistically indistinguishable then it is still a conundrum for the equatorial wind model, the torus must be a more significant absorber than the BAL wind forming its upper skin.
This statistical study indicates that some or all of the BALQSOs contain an additional, large, absorbing region that is not encountered by lines of sight (near the equatorial plane) typical of QSOIIs. The extra absorber would have an average column density . Two possible explanations of the extra absorber can be found in the empirical hollow cone outflow model of QSOs in Elvis (2000) and the analytically calculated polar wind models of Punsly (1999a, b). In fact, it is claimed that a polar BAL wind has been directly observed in MRK 231 Punsly and Lipari (2005). Another 6-8 polar BALQSOs have been found in Zhou et al (2006). If the X-ray absorber and the BAL wind are along the polar axis in many BALQSOs (not necessarily all), then type II lines of sight would never encounter these large absorption columns.
It is interesting that 4 of the 5 highest column densities for BALQSOs show low ionization UV absorption troughs, MRK 231, PHL5200, IRAS 07598+6508 and 1413+117. If these sources are removed from the BALQSO sample then the BALQSOs have absorption columns that are larger than QSOIIs at only a marginal level of significance by a Mann-Whitney test, . This might suggest that the extra absorber is more prominent in BALQSOs with low ionization absorption. However, one can not justify removing these sources from the sample since according to the equatorial wind model, the low ionization sources are merely those BAL winds viewed even closer to the torus (the lowest BAL latitudes) (Murray et al, 1995). So technically, a sample of pure low ionization BALQSOs should still show less absorption than a QSOII sample.
5 Discussion
This article is the first attempt to compare the absorption column densities of QSOIIs (completely enshrouded QSOs) and BALQSOs (partially shrouded QSOs). It is claimed that this comparison is an important clue for understanding the fundamental underlying physical configuration that constitutes a QSO. The preliminary results presented here seem to suggest that the subpopulation of QSOIIs are not more absorbed than BALQSOs in general. There is a strong indication that a significant fraction of the BALQSO population is not described by an equatorial BAL wind, the X-ray absorbing gas is not concentrated at low latitudes. Hopefully, this discussion will motivate future X-ray observations of large samples of objects with minimal selection effects. One way to choose the objects might be with a MID IR flux limited sample created from deep Spitzer observations.
References
- Aldcroft and Green (2003) Aldcroft, T.L., Green, P.J., 2003 ApJ 592 710
- Alexander et al (2005) Alexander, D.M. et al 2005, ApJ 632 736
- Antonucci (1993) Antonucci, R.J. 1993, Annu. Rev. Astron. Astrophys. 31 473
- Belsole et al (2006) E. Belsole , D. M. Worrall , M.J. Hardcastle astro-ph/0511606 to appear in MNRAS
- Braito et al (2004) Braito, V. et al A & A 2004 420 79
- Brandt et al (1999) Brandt, W.N., et al 1999, ApJL 525 69
- Brandt and Schulz (2001) Brandt, W.N., Schulz, N. 2001, ApJ 544 123
- Brinkmann et al (2002) Brinkmann, W., Ferrero, E., Gliozzi, M. 2002, A & A 385 31
- Cacciangia et al (2004) Cacciangia, A. et al 2004, A & A 416 901
- Clavel et al (2006) Clavel, J. Schartel, N., Tomas, L. 2006 astro-ph/0509432 to appear in A & A
- Chapman et al (2005) Chapman, S., et al 2005, ApJ 622 772
- Chartas et al (2002) Chartas, G., Brandt, W. N., Gallagher, S. C. and Garmire, G. P. 2002, ApJ 579 169
- Chartas et al (2003) Chartas, G., Brandt, W. N., Gallagher, S. C. 2003, ApJ 595 85
- Chartas et al (2004) Chartas, G. Eracleous, M. Agol, E. and Gallagher, S. 2004 ApJ 606 78
- Elvis (2000) Elvis, M. 2000 ApJ 545 63
- Evans et al (2006) Evans, D., Worrall,D., Hardcastle,M., Kraft,R.,Birkinshaw, M. 2006 astro-ph/0512600 to appear in ApJ
- Gallagher et al (1999) Gallagher, S et al ApJ 1999 519 549
- Gallagher et al (2001) Gallagher, S et al ApJ 2001 546 745
- Gallagher et al (2002) Gallagher, S, Brandt, W.N., Chartas, G., Gamire, G.P. ApJ 2002 567 37
- Gallagher et al (2004) Gallagher, S. et al 2004 ApJ 603 425
- Gallagher et al (2006) Gallagher, S. et al 2006 to appear in ApJ astro-ph/0602550
- Georgantopoulos et al (2006) Georgantopoulos, I. et al 2006, MNRAS in press astro-ph/0601245
- Green and Mathur (1996) Green, P. and Mathur, S. 1996 ApJ 462 637
- Green et al (2001) Green, P. et al 2001 ApJ 558 109
- Grupe et al (2003) Grupe, D., Mathur, S., Elvis, M., 2003 AJ 126 1159
- Hasinger et al (2002) Hasinger, G., Schartel., N. Komossa, S., 2002 ApJ 573 L77
- Hewett and Foltz (2003) Hewett, P. and Foltz, C., 2003 AJ 125 1784
- Imanishi and Terashima (2004) Imanishi, M. and Terashima, Y., 2004 AJ 127 758
- Iwasawa et al (2001) Iwasawa, K, Fabian, C., Ettori, S. 2001 MNRAS 321 L15
- Mathur et al (2000) Mathur, M. et al ApJ 2000 533 79
- Mathur et al (2001) Mathur, S. et al ApJ 2001 55113
- Morgan et al (2001) Morgan, N. et al ApJ 2001 555 1
- Murray et al (1995) Murray, N. et al 1995, ApJ 451 498
- Norman et al (2002) Norman, C. et al 2002 ApJ 571 218 498
- Oshima et al (2001) Oshima, T. et al 2001 ApJ 563 103
- Perola et al (2004) Perola, G, et al 2004, A & A 421 491
- Polletta et al (2006) Poletta et al 2006 astro-ph/0602228 to appear in ApJ
- Proga et al (2000) Proga, D., Stone, J., Kallman, T. ApJ 2000 543 686
- Proga and Kallman (2004) Proga, Kallman, T. ApJ 2004 616 688
- Ptak et al (2006) Ptak, A. et al 2006 ApJ 637 137
- Punsly (1999a) Punsly, B. 1999, ApJ 527 609
- Punsly (1999b) Punsly, B. 1999, ApJ 527 624
- Punsly and Lipari (2005) Punsly, B. 2005, ApJL 623 101
- Sabra et al (2001) Sabra, B. and Hamman, M. 2001 ApJ 563 555
- Severgnini et al (2006) Severgnini, P. et al 2006 astro-ph/0602486 to appear in A & A
- Shemmer et al (2006) Shemmer, O. astro-ph/0509146 2006 ApJ in press
- Sturm et al (2006) Sturm, E. et al 2006 astro-ph/0601204 to appear in ApJ
- Szokoly et al (2004) Szokoly, G. et al 2004 ApJS 155 271
- Tozzi et al (2006) Tozzi, P. et al 2006 astro-ph/0602127 to appear in A & A
- Weymann (1997) Weymann, R. 1997 in ASP Conf. Ser. 128, Mass Ejection from Active Nuclei ed, N.Arav, I. Shlosman and R.J. Weymann (San Francisco: ASP) 3
- Wilkes et al (2002) Wilkes, B.. et al 2002 ApJL 564 L65
- Zhou et al (2006) Zhou, H. et al 2006, ApJ 639 716