Elemental Abundance Measurements in Low-redshift Damped Lyman- Absorbers
Abstract
We present elemental abundance measurements for 9 damped Ly- systems (DLAs) and 1 sub-DLA at 0.1 z 1.5 from recent observations with the Multiple Mirror Telescope. Most of these absorbers are found to be metal-poor, while 2 are found to have solar metallicities. Combining our data with other data from the literature, we find that the systems with higher [Zn/H] also have stronger depletion as measured by [Cr/Zn] and [Fe/Zn]. The relationship between the metallicity and H I column density is also investigated. Together with our previous MMT survey (Khare et al. 2004) we have discovered 2 of the 4 known absorbers at that lie above (although near) the “obscuration threshold”. This appears to be a result of selecting absorbers with strong metal lines in our sample. It would be interesting to find other similar systems by observing a larger sample and study how much such systems contribute to the cosmic budget of metals. Finally, an analysis of the -weighted mean metallicity vs. redshift for our sample combined with data from the literature supports previous conclusions that the -weighted mean global DLA metallicity rises slowly at best and falls short of solar levels by a factor of 4 even at .
keywords:
Quasars: absorption lines-ISM: abundances, dust, extinction1 Introduction
Absorption line systems in QSO spectra provide a unique window into the high-redshift universe. These systems have been detected in the range 0 , corresponding to 90 of the age of the universe. As the absorption line strengths depend primarily on the gas content, they are selected independent of the stellar luminosities of the galaxies. Thus in principle they may be expected to provide less biased probes of galaxies than objects used to study the high redshift universe through emission, which are biased toward brighter galaxies including actively star forming galaxies such as Lyman-break galaxies, active galaxy nuclei, and QSOs.
Damped Lyman- Absorption systems (DLAs) with log NHI 20.3 and sub-DLAs with 19.0 log N 20.3 seen in QSO spectra can be used as probes of the neutral gas content of the universe. DLAs and sub-DLAs are known to contain the majority of the neutral gas in the universe (e.g. Wolfe et al. 1995, Peroux et al. 2003). With such high neutral hydrogen column densities DLAs are believed to be closely linked to galaxies. DLAs may also be the neutral gas reservoirs used in star formation. Furthermore, DLAs and sub-DLAs provide detailed gas-phase abundances of a number of elements and can thus be used to test galactic chemical evolution models.
Several elements have been detected in DLAs including C, N, O, Mg, Si, S, Ca, Ti, Cr, Mn, Fe, Ni, and Zn. Zn is often used as a tracer of gas-phase metallicity as it is typically relatively undepleted in the Galactic ISM when the fraction of H in molecular form is low, which is the case for DLAs (Sembach et al., 1995), Zn tracks the abundance of Fe in Galactic stars (Mishenina et al., 2002), and the lines of Zn II 2026,2062 are fairly weak and unsaturated. Also, Zn II can be detected with ground-based observations over a wide range of redshifts (0.6 ). Elemental abundances relative to Zn such as [Cr/Zn] or [Fe/Zn] can be used to estimate the dust content of the QSO absorber. Here and throughout the paper we adopt the standard notation [X/H] = log (NX/NHI) - log (X/H)☉.
If DLAs do constitute a representative sample of galaxies, it would be expected that their global mean metallicity of these objects should rise to roughly solar values at low redshift. It is uncertain whether or not DLAs show this trend. The most recent evaluations of this by Kulkarni and Fall (2002), Prochaska et al. (2003b), and Kulkarni et al. (2005) show at best a weak evolution in the metallicity-redshift relation with slopes of - 0.200.07.
One proposed explanation of the lack of metal-rich DLAs in observed samples is that this population is being under-sampled due to dust obscuration (e.g.; Boisse et al. 1998; Pei Fall 1993; Vladilo Peroux 2005). Absorbers with higher metallicity may also contain more dust, making any background QSOs fainter and keeping those objects out of magnitude-limited samples (York et al., 2006). In fact, it has been claimed that up to 50 of QSOs may be hidden in optical surveys due to dust obscuration (Vladilo Peroux, 2005). Recently, Akerman et al. (2005) measured the metal abundances of DLAs from the Complete Optical and Radio Absorption Line System survey (CORALS), and found that NHI weighted mean metallicity based on the Zn abundance is only marginally higher but within error limits of previous samples. However, the effects of dust may be expected to be stronger at low redshifts. The role of dust in DLAs is still unclear, and more investigation is needed. We discuss dust and reddening in our sample of absorbers in more detail in 5.2.
Assuming a cosmology with = 0.3 and = 0.7, 1.5 spans 70 of the age of the universe. It is therefore critical to obtain more abundance measurements at low redshift. One reason for the uncertainty in the metallicity-redshift relation is the lack of abundance measurements in low-redshift absorbers. In fact 70 of the existing Zn measurements are for 2 z 3.5, which corresponds to only 10 of the age of the universe. The paucity of Zn measurements at low z is primarily because the Zn 2026, 2062 lines lie in the UV for z 0.6, and deeply in the blue end of the spectrum for 0.6 z 1.3, where most existing spectrographs are inefficient. In this paper we present new MMT observations toward 10 QSOs. The observations presented in this paper increases the size of the sample of absorbers at z 1.5 by 40.
In 2 we describe our observations and our data reduction routines. 3 describes the estimation of column densities. In 4 we present notes on the individual objects. We present results from these measurements in 5, and in 6 we discuss our results and their implications.
2 Observations and Data Reduction
Our sample consists of 10 confirmed DLA and sub-DLA absorbers at 0.2 1.5, for which NHI is known from spectra (Rao et al., 2005). Seven of these targets were observed in the Sloan Digital Sky Survey (SDSS), and most show the presence of strong Mg II or Fe II absorption features from SDSS spectra. Apparent magnitudes for these 7 QSOs are available from the SDSS Quasar Catalog III, Data release 3 (Abazajian et al., 2005).
The spectra presented here were obtained at the Multiple Mirror Telescope (MMT) during two separate epochs, 2004 May and 2005 February. Nearly 2.7 nights out of a total of 5 were lost due to poor weather. The Blue Chanel spectrograph was used with the 832 l mm-1 grating in the first order, or the 1200 l mm-1 grating in the second order, depending on the redshift of the absorber. A CuSO4 blocking filter was used with the 832 l mm-1 grating to block first order red light. The central wavelength for the 832 l mm-1 grating was at 3670 Å and 3600 Å for the 2004 May and 2005 Feb epochs respectively. For the 1200 l mm-1 grating the wavelength was centered at 4935 Å and 4770 Å during the 2004 May and 2005 Feb epochs respectively. In order to achieve the desired S/N while minimizing cosmic rays, multiple exposures of each target were taken with exposure times ranging from 1800 to 2700 s depending on the magnitude of the QSO. Each target observation was followed by a comparison spectrum from a He+Ne+Ar lamp for wavelength calibration. Quartz flat fields and bias frames were taken at both the beginning and end of the night. Table 1 lists the vacuum wavelengths and oscillator strengths used in identification of the features and subsequent analysis.Table 2 gives a summary of our observations.
| Species | References | ||
| Å | |||
| Be II | 3130.4219 | 3.321E-1 | 1 |
| C IV | 1548.2040 | 1.899E-1 | 1 |
| 1550.7810 | 9.475E-2 | 1 | |
| Mg I | 1827.9351 | 2.420E-2 | 1 |
| 2026.4768 | 1.130E-1 | 1 | |
| 2852.9631 | 1.830E00 | 1 | |
| Mg II | 2796.3543 | 6.155E-1 | 1 |
| 2803.5315 | 3.058E-1 | 1 | |
| Al II | 1670.7886 | 1.710E00 | 1 |
| Al III | 1854.7184 | 5.590E-1 | 1 |
| 1862.7910 | 2.780E-1 | 1 | |
| Si II | 1808.0129 | 2.080E-3 | 1,2 |
| Si IV | 1393.7602 | 5.130E-1 | 1 |
| 1402.7729 | 2.540E-1 | 1 | |
| Ca II | 3933.6614 | 6.267E-1 | 1 |
| 3968.4673 | 3.116E-1 | 1 | |
| Ti II | 1910.6123 | 1.040E-1 | 1,3 |
| 3383.7588 | 3.580E-1 | 1 | |
| Cr II | 2056.2569 | 1.030E-1 | 1,2 |
| 2062.2361 | 7.590E-2 | 1,2 | |
| Mn II | 2576.8770 | 3.610E-1 | 1 |
| 2594.4990 | 2.800E-1 | 1 | |
| 2606.4620 | 1.980E-1 | 1 | |
| Fe II | 2249.8768 | 1.820E-3 | 4 |
| 2260.7805 | 2.440E-3 | 4 | |
| 2344.2139 | 1.140E-1 | 1,5 | |
| 2374.4612 | 3.130E-2 | 1 | |
| 2382.7652 | 3.200E-1 | 1,5 | |
| Zn II | 2026.1370 | 5.010E-1 | 1,6 |
| 2062.6604 | 2.460E-1 | 1,6 |
References. (1) Morton 2003; (2) Bergeson Lawler 1993b;
(3) Wiesse et al. 1996; (4) Bergeson et al. 1994; (5) Bergeson et al. 1996;
(6) Bergeson Lawler 1993a
| QSO | log NHI | Grating | FWHM | Exposure Time | Epoch | |||
| cm-2 | lines mm-1 | Å | ||||||
| 0738+313 | 16.1 | 0.630 | 0.0912 | 21.180.06 | 832 | 1.10 | 3000 | 2005 Feb. |
| 0.2210 | 20.900.09 | 832 | 1.10 | 3000 | 2005 Feb. | |||
| 0827+243 | 17.3 | 0.941 | 0.5247 | 20.300.05 | 832 | 1.10 | 3600 | 2005 Feb. |
| 1010+0003 | 18.3 | 1.398 | 1.2651 | 21.520.07 | 1200 | 1.33 | 3600 | 2005 Feb. |
| 1107+0003 | 18.7 | 1.741 | 0.9547 | 20.260.14 | 832 | 1.10 | 8100 | 2005 Feb. |
| 1137+3907 | 17.4 | 1.023 | 0.7190 | 21.100.10 | 832 | 1.10 | 5400 | 2004 May |
| 1225+0035 | 18.9 | 1.226 | 0.7731 | 21.380.11 | 832 | 1.10 | 5400 | 2005 Feb. |
| 1501+0019 | 18.1 | 1.930 | 1.4832 | 20.850.13 | 1200 | 1.33 | 5400 | 2004 May |
| 1712+5559 | 18.7 | 1.356 | 1.2095 | 20.720.05 | 1200 | 1.33 | 5400 | 2004 May |
| 1715+4606 | 18.1 | 0.989 | 0.6511 | 20.440.13 | 832 | 1.10 | 5400 | 2004 May |
| 1733+5533 | 18.1 | 1.074 | 0.9981 | 20.700.03 | 832 | 1.10 | 3600 | 2004 May |
Data reduction was carried out using standard IRAF routines. Images were bias subtracted, trimmed, and flat fielded using the task CCDPROC. These reduced 2-d spectra were then extracted and wavelength calibrated using the task DOSLIT. The wavelengths were converted to vacuum using the task DISPTRANS. Finally the spectrum was normalized using the task CONINUUM. The solar abundances used as reference while calculating the abundances are adopted from Lodders et al. (2003).
Figures 1-10 plot the co-added and continuum-fitted spectra obtained with the MMT, along with line identifications from the DLAs as well as other absorption systems along the line of sight. Unmarked, minor depressions have been verified to be artifacts.
3 Estimation of Column Densities
Column densities were estimated by fitting the observed absorption line profiles using the package FITS6P (Welty et al., 1991), which has evolved from the code by Vidal-Madjar et al (1977). FITS6P iteratively minimizes the value between the data and a theoretical Voigt profile that is convolved with the instrumental profile. All lines were fit with a single component Voigt profile. If a multiplet was available such as Fe II 2344, 2374, 2382 the lines were fit simultaneously until convergence for a common N, , and . Equivalent width measurements were obtained with the package SPECP, also written by D.E. Welty. The 1 equivalent width uncertainties were estimated using the photon noise uncertainties and the continuum uncertainties obtained by allowing the continuum to vary by 10 . In all cases these uncertainties were dominated by the photon noise uncertainties.
The prescription of Khare et al. (2004) for fitting the Cr II and Zn II lines of was followed. Specifically, the Cr II 2056, 2066 lines were fit simultaneously to obtain N, , and values. Then, the blended Cr II+Zn II 2062 line was fit starting with the values obtained from the previous fits, holding the Cr II component fixed. The Zn II 2026 line was then fit using the and value from the Cr 2056, 2062 fit while holding the Mg I component fixed. If the Cr II 2056 line could not be fit due to noise, we fit the Zn II 2026 line, holding the Mg I 2026 contribution fixed, then fit the Cr II + Zn II 2062 blend holding the Zn II component fixed. The Mg I column density was estimated by fitting the Mg I 2852 line from the SDSS spectra. York et al. (2006) showed that the Mg I 2852 lies on the linear portion of the curve of growth for W 0.6 to 0.7. The Mg I 2852 line is often moderately saturated in DLAs and the assumption of a linear curve of growth may lead to an underestimation of the Mg I column density, therefor we did not assume Mg I 2852 to be on the linear portion of the curve of growth, and instead used the results of a profile fit to that line. To judge the effects of possible saturation of Mg I 2852 on NMgI and hence on NZnII, we also estimated the maximum NMgI that would be consistent with W2852 within a 3 level. We then used this maximum NMgI to estimate the minimum NZnII in the 2026 line. In any case, in our experience the contribution of Mg I to the blended 2026 line is typically small (eg. Peroux et al. 2006a). For Q1501+0019 we also have a constraint on NMgI from the non-detection of the Mg I 1827 line which gives log NMgI 13.47.
Tables 3 and 4 list the derived equivalent widths and column densities respectively. If a certain species was not detected, 3 upper limits were placed on the equivalent widths and column densities based on the signal to noise ratio (S/N) in the region based on a 3 pixel resolution element. It was assumed that these lines lie on the linear portion of the curve of growth. As can be seen in figures 1-10, none of the detected Zn II or Cr II lines are saturated. In fact, none of the lines detected appear to show significant saturation even in those cases where the equivalent widths are large. This is likely due to the line profile being composed of multiple components that could not be resolved at the resolution of our data.
4 Discussion of Individual Objects
( = 0.630, = 0.0912 for system A and = 0.2210 for system B): Both of the systems listed are DLAs. The Zn and Cr lines were studied by Kulkarni et al. (2005) using data. The 3933,3969 lines of Ca II appear in both systems A and B. We also placed upper limits on Ti II 3383 of system B. As the background QSO is very bright (g = 16.1), we were able to obtain high S/N of 100 in the region. This gives an upper limit of log (NTiII/NHI) -9.42, with [Ti/H] -2.32. The feature located at 5070 Å is an artifact from bad pixels in the CCD.
( = 0.941, = 0.259 for system A and = 0.5247 for system B): The Zn and Cr lines of system B were studied in detail at lower wavelengths by Khare at al. (2004). The Fe II 2249, 2260, 2344, 2374, 2382, 2586, 2600 lines were measured previously. Strong Mg II 2796, 2803 and Mg I 2852 lines were present in system B in the new spectra. The Mg I 2852 line was fit first to estimate and values, which were used when fitting the Mg II doublet. Due to the strong saturation of the Mg II 2796, 2803 doublet we give the derived column density as a lower limit. We were able to place upper limits on Ti II 3383 of [Ti/H] = -1.45 at S/N 60 in the region. The feature located at 5070 Å is again an artifact from bad pixels in the CCD.
( = 1.4007, =1.2651): The Cr II 2056, 2062, 2066 lines, as well as the Zn II 2026, 2062 lines were detected with S/N of 30. As all the lines were detected, the full prescription outlined in 2 was followed. The Mg I contribution to the blended Zn II+Mg I 2026 line was estimated from the SDSS spectrum. The Mg I 2852 has an equivalent width of Wrest = 404 mÅ. This line was fit using a single component model, yielding log NMgI = 12.670.05. This component was held fixed in Mg I 2026 while the Zn II and Cr II 2026, 2056, 2062, 2066 lines were fit simultaneously giving log NZnII = 12.96.
| QSO | Species | Wrest | QSO | Species | Wrest | ||||
|---|---|---|---|---|---|---|---|---|---|
| Å | mÅ | Å | mÅ | ||||||
| 0738+313 | 0.0912:A | Ca II | 3933 | 18913 | 1501+0019 | 1.4832:A | Mg I | 2852 | 952a |
| Ca II | 3969 | 5410 | Al III | 1854 | 33417 | ||||
| 0.2210:B | Ca II | 3933 | 6310 | Al III | 1862 | 21618 | |||
| Ca II | 3969 | 3510 | Si II | 1808 | 29516 | ||||
| Ti II | 3383 | 14 | Cr II | 2056 | 10516 | ||||
| 0827+243 | 0.2590:A | Ca II | 3933 | 34 | Cr II | 2066 | 26 | ||
| Ca II | 3969 | 34 | Zn II+Mg I | 2026 | 23121 | ||||
| Ti II | 3383 | 33 | Zn II+Cr II | 2062 | 19118 | ||||
| 0.5247:B | Mg I | 2852 | 60229 | 1.8510:B | C IV | 1548 | 15418 | ||
| Mg II | 2796 | 241627 | C IV | 1550 | 11618 | ||||
| Mg II | 2803 | 231628 | 1.9260:C | C IV | 1548 | 25414 | |||
| Ti II | 3383 | 30 | C IV | 1550 | 15414 | ||||
| 1010+0003 | 1.2651:A | Mg I | 2852 | 404a | Al II | 1670 | 8811 | ||
| Al III | 1854 | 10421 | 1712+5559 | 1.1590:A | Cr II | 2056 | 33 | ||
| Al III | 1862 | 46 | Cr II | 2066 | 33 | ||||
| Cr II | 2056 | 9119 | Fe II | 2344 | 41530 | ||||
| Cr II | 2066 | 6915 | Fe II | 2374 | 24027 | ||||
| Fe II | 2249 | 14426 | Fe II | 2382 | 59232 | ||||
| Fe II | 2260 | 18426 | Zn II+Mg I | 2026 | 33 | ||||
| Fe II | 2344 | 56428 | Zn II+Cr II | 2062 | 33 | ||||
| Fe II | 2374 | 54335 | 1.2093:B | Mg I | 2852 | 367a | |||
| Fe II | 2382 | 71530 | Cr II | 2056 | 35 | ||||
| Zn II+Mg I | 2026 | 23323 | Cr II | 2066 | 35 | ||||
| Zn II+Cr II | 2062 | 18122 | Fe II | 2344 | 97333 | ||||
| 1107+0003 | 0.5252:A | Mn II | 2576 | 30 | Fe II | 2374 | 72331 | ||
| Mn II | 2594 | 34 | Fe II | 2382 | 116835 | ||||
| Mn II | 2606 | 20 | Zn II+Mg I | 2026 | 35 | ||||
| Fe II | 2344 | 13936 | Zn II+Cr II | 2062 | 35 | ||||
| Fe II | 2374 | 47 | 1715+4606 | GALb | Ca II | 3933 | 155646c | ||
| Fe II | 2382 | 26936 | Ca II | 3969 | 20536 | ||||
| Fe II | 2586 | 18525 | 0.6544:A | Cr II | 2056 | 165 | |||
| Fe II | 2600 | 34227 | Cr II | 2066 | 165 | ||||
| 0.9547:B | Ti II | 1910 | 42 | Fe II | 2344 | 126442 | |||
| Cr II | 2056 | 27 | Fe II | 2374 | 85140 | ||||
| Cr II | 2066 | 27 | Fe II | 2382 | 155646c | ||||
| Zn II+Mg I | 2026 | 27 | Zn II+Mg I | 2026 | 165 | ||||
| Zn II+Cr II | 2062 | 27 | Zn II+Cr II | 2062 | 165 | ||||
| 1.711:C | Si IV | 1393 | 61836 | 1733+5533 | GALb | Ca II | 3933 | 48236 | |
| Si IV | 1402 | 44740 | Ca II | 3969 | 25733 | ||||
| 1137+3907 | GALb | Ca II | 3933 | 33658 | Mg I | 2852 | 362a | ||
| Ca II | 3969 | 24151 | 0.9984:A | Al III | 1854 | 17931 | |||
| 0.7190:A | Cr II | 2056 | 74 | Al III | 1862 | 10027 | |||
| Cr II | 2066 | 74 | Si II | 1808 | 17830 | ||||
| Fe II | 2249 | 15031 | Ti II | 1910 | 30 | ||||
| Fe II | 2260 | 29134 | Cr II | 2056 | 35 | ||||
| Fe II | 2344 | 176867 | Cr II | 2066 | 29 | ||||
| Fe II | 2374 | 130037 | Zn II+Mg I | 2026 | 29 | ||||
| Fe II | 2382 | 200970 | Zn II+Cr II | 2062 | 29 | ||||
| Zn II+Mg I | 2026 | 44756 | 1.1496:B | C IV | 1548 | 45355 | |||
| Zn II+Cr II | 2062 | 26670 | C IV | 1550 | 34151 | ||||
| 1225+0035 | 0.7731:A | Mg I | 2852 | 929a | Al II | 1670 | 40 | ||
| Cr II | 2056 | 25981 | Al III | 1854 | 30 | ||||
| Cr II | 2066 | 17776 | Al III | 1862 | 30 | ||||
| Fe II | 2249 | 33973 | Si II | 1808 | 25 | ||||
| Fe II | 2260 | 37280 | |||||||
| Zn II+Mg I | 2026 | 122 | |||||||
| Zn II+Cr II | 2062 | 18191 |
a: From SDSS spectra. b: Entries with GAL identifier are from lines originating in the Milky Way. c: The Galactic Ca II 3933 line and Fe II 2383 line from the DLA at zabs = 0.6544 are blended in the spectra.


————
To judge the effect of potential saturation of Mg I 2852 we estimated the maximum NMgI and hence the minimum NZnII as described in 3. This gave log NZnII 12.95, affirming the assumption that the Mg I contribution to the blended 2026 line is small. Fe II 2249, 2260, 2344, 2374, 2382 lines were also detected.
( = 1.7408, = 0.5252 for system A, = 0.9547 for system B and = 1.711 for system C): System B is of primary interest to this paper, and contains a confirmed sub-DLA from HST spectra with log NHI = 20.26. This QSO also has a broad absorption line system (BAL) at 1.711. Si IV 1393, 1403 lines from the BAL were detected. No Zn II or Cr II lines were detected from the sub-DLA at = 0.9547, but upper limits were placed on the column densities. There is also a system at = 0.5252 with weak Fe II lines detected in SDSS spectra. Lines of Fe II 2344, 2382, 2586, 2600 were detected from this system. The weaker Fe II 2374 line however was not detected. The Fe II 2344, 2382 lines were fit simultaneously, as were the 2586, 2600 lines with the same and . Mn II 2576, 2594, 2606 fell within the observable region for system B, but none were detected.
( = 1.023 and = 0.7193): This is a BAL system. The Zn II + Mg I 2026 blend was detected at 3 level in this system. The S/N in the region was 15, leading to larger errors in the column density estimates. There are no data available on Mg I for this system, so it could not be included in the fit of the blended Zn II+Mg I 2026. We are however confident of the Zn II column density quoted, because based on our experience so far, the contribution from Mg I 2026 is relatively small for most systems. For example, the DLA toward Q1010+0003 showed differences in the Zn II column density of only 0.05 dex with and without the contribution from Mg I 2026.The Zn II 2026 line was fit using the value from the fit of the Fe II 2249, 2260 lines. The Zn II component was held fixed in the blended 2062 line to determine NCrII. Strong Fe II 2249, 2260, 2344, 2374, 2382 were also detected. The feature at 3740 Å is caused by a defect in the CCD.
( = 1.226 and = 0.7730): The spectra of this object were taken near daybreak, which resulted in additional noise due to increased background. The Cr II 2056, 2062 lines was detected at 3, allowing for moderately accurate determination of the column density. The Zn II+Mg I 2026 blend lies in a noisy region and was not detected, and the Zn II upper limit had to be estimated from S/N. We also detected Fe II 2249, 2260 lines which were fit simultaneously with the same and . The feature at 3735 Å is caused by a defect in the CCD.
( = 1.930, = 1.4832 for system A, = 1.8510 for system B, and = 1.9260 for system C): System A is the system of primary interest in this paper, and has a confirmed DLA from HST spectra. We detected only the C IV 1548, 1550 lines in system B. The Zn II+Mg I 2026 blend, along with the Cr II+Zn II 2062 and Cr II 2056 lines were all detected in system A. Because the Cr II 2066 line was not detected, the Cr II column density was determined from Cr II 2056 solely. The Mg I contribution to the blended Zn II+Mg I 2026 line was determined from SDSS spectra, which yields a Wrest for the Mg I 2852 line of 952 mÅ. This line was fit using a one component model, giving log NMgI = 12.930.05. This component was held fixed in the MMT spectrum of the 2026 line while the Zn II and Cr II 2056, 2062, and 2066 lines were fit simultaneously. To judge the effects of saturation of Mg I 2852, we again estimated the maximum Mg I contribution to the blended 2026 line as described in 3. This gave NZnII 12.89, only 0.04 dex less than the “best fit” model. Al III 1854, 1862 lines were also detected and fit together while simultaneously varying N, , and . The feature at 5220 Å is caused by a defect in the CCD.
( = 1.930, = 1.2093 for system A and = 1.1584 system B): System A is the system of primary interest for this paper, and contains a confirmed DLA from HST spectra with log NHI = 20.72. Both systems contain strong Fe II 2344, 2374, 2382 lines. No other lines from system B appear to be present. No Zn II or Cr II lines were detected in either system, with S/N 30 in the region. The feature at 5220 Å is caused by a defect in the CCD.
( = 0.989 and = 0.6511) We have determined the H I column density for this object from archival data. By fitting the line profile, we have determined a column density of log NHI=20.44. Strong Fe II 2344, 2374, 2382 lines were detected. No lines of Zn II or Cr II were seen, although the S/N in the region was only 10 due to poor weather during the observations. A weak Galactic Ca II 3698 feature was seen, but the stronger Ca II 3933 line was blended with the Fe II 2382 line from the =0.6511 system. The feature located at 3690 Å is an artifact of the CCD.
( = 1.074 and = 0.9984 for system A and = 1.1496 for system B) System A is of primary interest for this study, as it has a confirmed DLA with log NHI = 20.70. System B appears to be a C IV system with no other absorption features at this redshift detected in SDSS spectra. No Zn II or Cr II lines were detected in system A, but the relatively high S/N (33) in the region allows us to place tight upper limits on the abundances. Al III 1854,1862 lines were weakly detected and were fit together varying N, , and simultaneously. We also detected strong Galactic Ca II 3933, 3968 lines.
| QSO | Species | log N | QSO | Species | log N | ||||
|---|---|---|---|---|---|---|---|---|---|
| cm-2 | km s-1 | cm-2 | km s-1 | ||||||
| 0738+313 | 0.0912 | Ca II | 12.320.02 | 51.2 | 1225+0035 | 0.7731 | Mg I | 12.850.06c | 52.4 |
| Ti II | 12.530.10a | Cr II | 13.990.11 | 74.7 | |||||
| Cr II | 13.280.22b | Fe II | 15.690.03 | 74.7 | |||||
| Zn II | 12.66a | Zn II | 13.01 | ||||||
| 0.2210 | Mg I | 12.000.10a | 1501+0019 | 1.4832 | Mg I | 12.920.05c | 96.6 | ||
| Mg II | 13.300.03a | Al III | 13.350.01 | 87.1 | |||||
| Ca II | 11.910.03 | 34.2 | Si II | 15.71.02 | 86.5 | ||||
| Ti II | 11.48 | Cr II | 13.400.09 | 86.5 | |||||
| Cr II | 13.110.24b | Zn II | 12.930.06 | 86.5 | |||||
| Zn II | 12.83b | 1.8510 | C IV | 13.640.04 | 74.1 | ||||
| 0827+243 | 0.2590 | Ca II | 11.60 | 1.9260 | C IV | 13.870.03 | 88.8 | ||
| Ti II | 11.96 | Al II | 12.330.04 | 53.4 | |||||
| 0.5247 | Mg I | 12.690.02 | 80.3 | 1712+5559 | 1.1584 | Cr II | 12.93 | ||
| Mg II | 14.59 | 80.3 | Fe II | 13.980.03 | 74.9 | ||||
| Ti II | 11.76 | Zn II | 12.25 | ||||||
| Cr II | 13.42b | 1.2093 | Mg I | 12.44c | 76.7 | ||||
| Fe II | 14.590.02a | Cr II | 12.86 | ||||||
| Zn II | 12.80b | Fe II | 14.54 | 76.7 | |||||
| 1010+0003 | 1.2651 | Mg I | 12.670.05c | 184.3 | Zn II | 12.19 | |||
| Al III | 12.670.10 | 10.8 | 1715+4606 | GALd | Ca II | 12.660.10 | 35.5 | ||
| Cr II | 13.540.07 | 22.5 | 0.6511 | Cr II | 13.54 | ||||
| Fe II | 15.260.05 | 22.5 | Fe II | 14.940.03 | 57.4 | ||||
| Zn II | 12.960.06 | 22.5 | Zn II | 12.87 | |||||
| 1107+0003 | 0.5252 | Mn II | 12.16 | 1733+5533 | GALd | Ca II | 12.790.03 | 88.2 | |
| Fe II | 13.540.08 | 37 | 0.9984 | Mg I | 12.44b | ||||
| 0.9547 | Ti II | 13.01 | Al III | 13.130.05 | 133.7 | ||||
| Cr II | 12.76 | Si II | 15.480.06 | 118.9 | |||||
| Zn II | 12.08 | Cr II | 12.79 | ||||||
| 1.7110 | Si IV | 13.990.03 | 198.3 | Zn II | 12.11 | ||||
| 1137+3907 | GALd | Ca II | 12.630.05 | 87.8 | 1.1496 | C IV | 14.190.04 | 88.8 | |
| 0.7193 | Cr II | 13.710.20 | 122.9 | Al II | 11.77 | ||||
| Fe II | 15.450.05 | 122.9 | Si II | 14.6 | |||||
| Zn II | 13.430.05 | 122.9 |
a: Khare et al. (2004) b: Kulkarni et al. (2005) c: From SDSS spectra. d: Entries with GAL identifier are from lines originating in the Milky Way.
| QSO | [Zn/H] | [Cr/Zn] | [Fe/Zn] | [Ti/Zn] | [Si/Zn] | |
|---|---|---|---|---|---|---|
| Q0738+313 | 0.0912 | -1.14a | -0.21a | -0.48a | ||
| 0.2213 | -0.7a | 0.7a | ||||
| Q0827+243 | 0.5247 | -0.04a | -0.3a | |||
| Q1010+0003 | 1.2651 | -1.19 | -0.46 | -0.54 | -1.01 | |
| Q1107+0003 | 0.9547 | -0.72 | ||||
| Q1137+3907 | 0.7190 | -0.30 | -0.67 | -0.82 | ||
| Q1225+0035 | 0.7731 | -1.15 | 0.09 | 0.07 | ||
| Q1501+0019 | 1.4832 | -0.54 | -0.56 | -1.24 | -0.28 | |
| Q1712+5559 | 1.2093 | -1.07 | -0.51 | |||
| Q1715+4606 | 0.6511 | -0.61 | -0.78 | |||
| Q1733+5533 | 0.9981 | -1.13 | 0.37 |
a: Abundance measurements from Kulkarni et al. (2005).
5 Results and Discussion
5.1 Relative Abundances
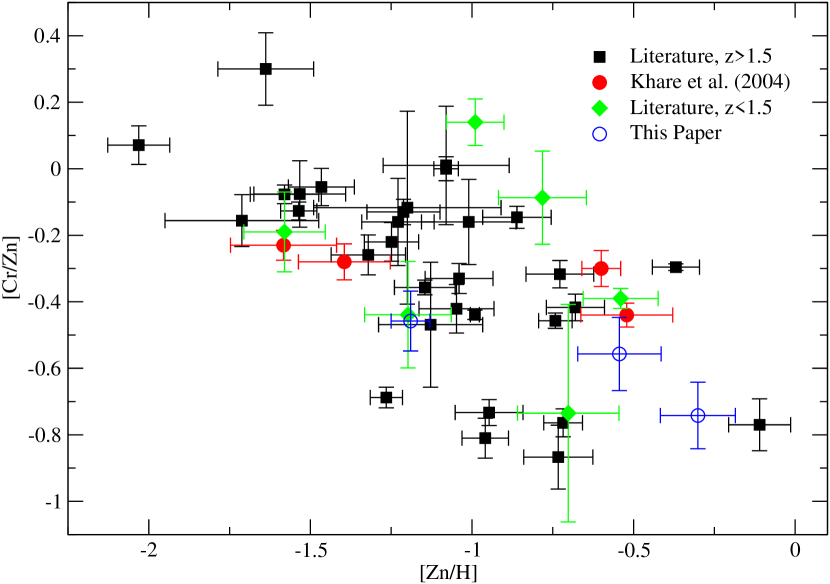
The observed relative abundances of the elements are a combination of both the nucleosynthetic processes and of dust depletion. If dust is significantly present in DLAs, then refractory elements such as Cr, Mn, Fe, Co, and Ni should show substantial depletions. As already discussed in 1, Zn is a relatively undepleted element due to its low condensation temperature. Ratios such as [Cr/Zn] and [Fe/Zn] are therefore a measure of dust depletion. Table 5 lists abundances of Cr, Fe, and Ti relative to Zn for the systems in our sample. Also given is the metallicity [Zn/H]. Although it is customary to estimate metallicity based on measurements of NZnII, it has been shown that [Zn/H] is not much affected by ionization (Vladilo et al., 2001).
No Ti II was found in any of the systems sampled. We determined [Ti/Zn] upper limits of -1.01 and -1.24 for the DLAs toward Q1010+0003 and Q1501+0019 respectively. The measured [Fe/Zn] in Q1010+0003 was also sub-solar (-0.69) also suggesting dust depletion. No Fe lines were sampled in the spectra of Q1501+0019, so [Fe/Zn] could not be measured.
Si is an -capture element, and its abundance relative to Fe group elements can provide clues into the chemical evolution of DLAs. Disk stars in the Milky Way show a systematic decrease in [/Fe] with increasing [Fe/H], which indicates an increase with time of Fe contributed to the ISM from type Ia supernovae, relative to type II supernovae (Edvardsson et al., 1993). Prochaska Wolfe (1999) observed that the DLAs in their sample showed no such trend, and that most of the objects were -enhanced. In DLAs, Zn is a better indicator of Fe group abundances than Fe because of the large depletion of Fe on dust grains. We detected Si II 1808 in Q1501+0019 and Q1733+5533. [Si/H] = -0.68 in Q1501+0019, and [Si/H] = -0.76 in Q1733+5533. We unfortunately did not cover any Fe II lines in the region. However, [Si/Zn] = -0.28 in Q1501+0019, and [Si/Zn] 0.37 in Q1733+5533, implying significant -enhancement in the latter system.
Figure 11 shows [Cr/Zn] vs. [Zn/H] for our data as well as those from the literature. Only detections, not limits have been plotted. There is intrinsic scatter in the data, which is to be expected, but there appears to be a general trend suggesting that the most metal rich DLAs also show the most depletion. If this is true, then one would expect the most metal rich absorbers to be under-sampled because they would also most likely be the most reddened. A Spearman rank-order correlation test on the 48 data points plotted in Fig. 11 gives the Spearman rank-order coefficient RS=-0.623, with a probability of obtaining such a value by chance of P(RS)=1.9510-5.
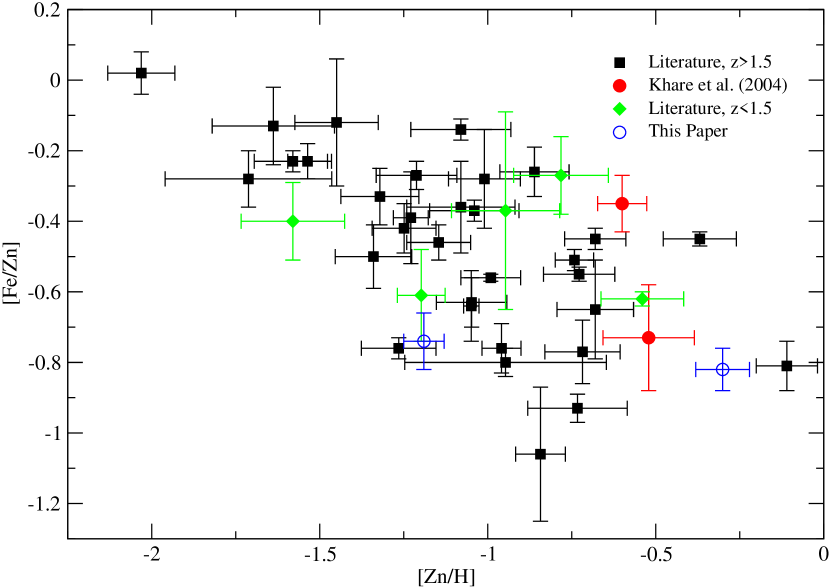
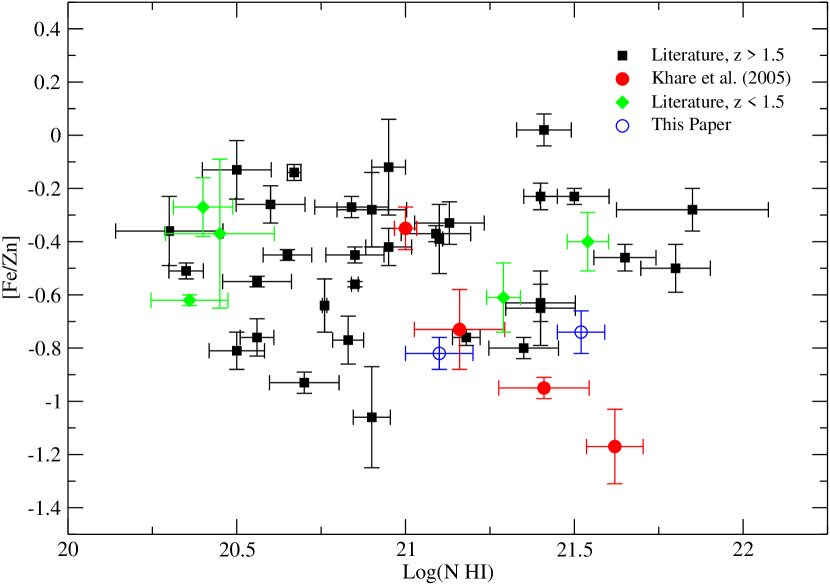
Figure 12 shows [Fe/Zn] vs [Zn/H] for our data as well as from the literature. Again, only detections have been plotted. Both figures 11 and 12 show a trend toward higher depletion with higher metallicity. Previous investigations have shown a similar anti-correlation between [Cr/Zn] or [Fe/Zn] and [Zn/H] although the vast majority of their data set has come from absorbers at (Pettini et al., 1997; Prochaska Wolfe, 2002; Akerman et al., 2005). Our study increases the number of Zn measurements at by 30 A Spearman rank-order correlation test on this data set gives RS=-0.428, with a probability of obtaining such a value by chance of P(RS)=6.0010-3.
5.2 Dust Obscuration Bias
Several studies have tried to understand whether current DLA observations are affected by a dust obscuration bias. Recently, York et al. (2006) conducted a survey of 809 Mg II systems from the SDSS with 1.0 1.9 and found that QSOs with an intervening absorber are at least three times more likely to have highly reddened spectra than QSOs without any absorption systems in their spectra. Furthermore, York et al. (2006) found a trend toward higher Zn II column densities but lower [Zn/H] and lower abundances of the first ions as the reddening E(B-V) increased. Significant reddening has also been seen in a sample of strong Ca II absorbers (Wild Hewett, 2005; Wild et al., 2006).
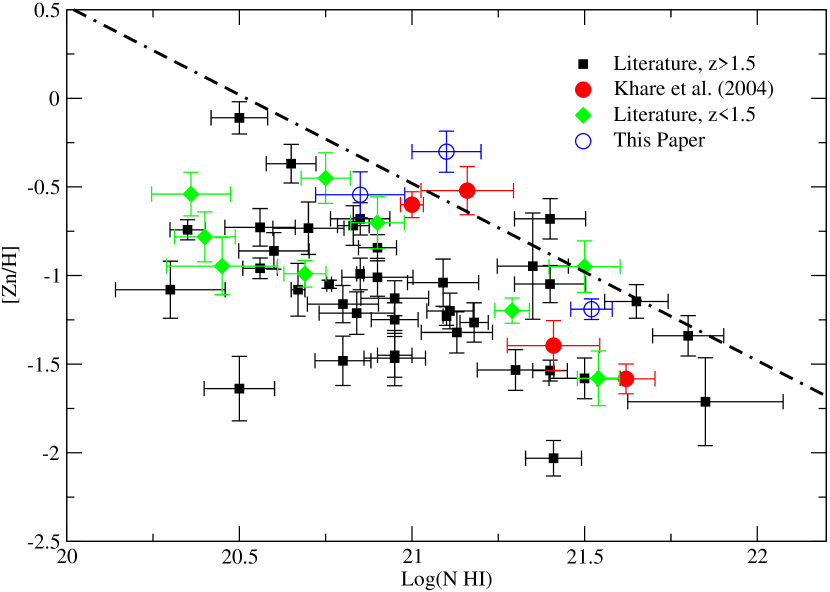
If dust obscuration effects are significant, highly reddened QSOs would be under-sampled due to their faintness. Boisse et al. (1998) pointed out that there is a deficit of systems with high and high [Zn/H], and suggested that this may be caused by a dust obscuration bias (because such systems may also have high dust content and may obscure the background quasars more). They speculated that observations of fainter QSOs might reveal systems with high and high metallicity. Figure 13 shows a plot of [Zn/H] vs. for DLAs from our sample as well as the literature (Akerman et al. 2005, Rao et al. 2005). Clearly, there is a deficit of systems that are seen with both low metallicity and low . This could be attributed to observational limitations in detecting weak Zn II lines, although recent high resolution, high S/N observations still find a dearth of systems in this region. More interestingly though, there are few absorbers with high metallicity and high , as noted by Boisse et al. (1998) and also by Akerman et al. (2005). This cannot be credited to observational limitations, because systems with similar metallicities have been detected at lower , and seems to suggest that these types of systems are being under-sampled. Also, there is nothing unphysical about systems with high and high metallicity. It is thus surprising that only 3 points from the literature (of which 1 came from our previous sample in Khare et al. 2004) lie above the dashed line indicating the empirical “obscuration threshold” log 13.15 suggested by Boisse et al. (1998).
Two of the systems at that lie above the “obscuration threshold” came from our samples (this paper and Khare et al. 2004), although it is still remarkable that all points in Fig. 13 lie fairly close to the threshold suggested by Boisse et al. (1998). Indeed, all but two of the points are consistent, within the errors, with being below the obscuration threshold. It should also be noted that the Boisse et al. threshold is not meant to be a hard limit, but an observationally determined boundary based on the much smaller sample available to Boisse et al. (1998). Indeed, hydrodynamical simulations by Cen et al. (2003) predict the existence of absorbers above this threshold. Thus, it may not be completely surprising that we are now finding some objects above the threshold.
We emphasize that the higher proportion of systems with NZnII close to the Boisse et al. threshold in our studies (this paper and Khare et al. 2004) is not due to errors in the column density estimations from the moderate resolution of the MMT spectrograph. Column densities derived from our observations of several systems with both the MMT and with the higher resolution ( 5 km s-1) Ultraviolet-Visual Echelle Spectrograph (UVES) on the Very Large Telescope (VLT) agree to within 0.1 dex (Peroux et al., 2006a, b). A similar agreement was also found between column densities derived by Khare et al. (2004) from MMT spectra and those derived by Rao et al. (2005b) from Keck HIRES spectra. The reason for the higher proportion of metal-rich systems in our studies is that the targets in this paper and Khare et al. (2004) were chosen partially because of strong metal line absorption features seen in SDSS spectra. Thus, these systems may have been more likely to have higher Zn column densities. Indeed, composite SDSS quasar spectra indicate that systems with larger Wrest of Mg II tend to have stronger Zn II lines (Nestor et al. 2003; York et al. 2006). One of our two systems has a large depletion consistent with the obscuration selection effect while the other system shows a moderate depletion, so it is not clear whether the small number of such systems found so far is caused by dust obscuration or small sample size especially at where the effects of dust are expected to be the most pronounced (Boisse et al., 1998). It could also be the case that the most metal rich systems are truly rare.
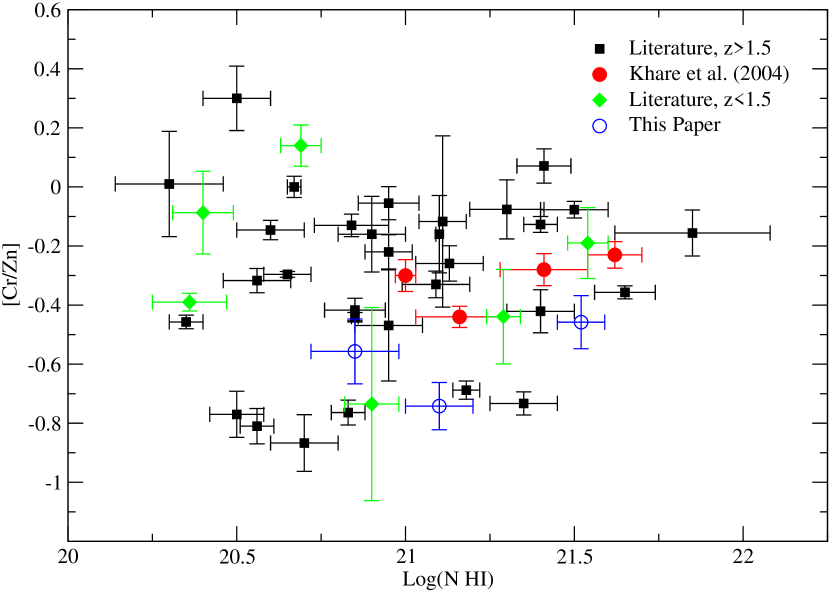
Figures 14 and 15 show the dust content as measured by [Cr/Zn] and [Fe/Zn] respectively vs. log for these DLAs as well as those from the literature. As can be seen, there is very little trend in the data. It may appear surprising from Figs. 11-15 that there is no (anti)-correlation between [Cr/Zn] (or [Fe/Zn]) and log N(HI) even though there is an (anti)-correlation between [Cr/Zn] (or [Fe/Zn]) and [Zn/H] and between [Zn/H] and log NHI. If one traces some of the extreme points in Figs. 11 (or 12) and 13 that do show the correlation, one can see that the correlations in these two figures arise from different systems. For example, consider the 3 points A, B, and C with ([Cr/Zn], [Zn/H], log NHI (-0.46, -1.19, 21.52); (-0.74, -0.30, 21.10); and (-0.54; -.57; 20.85). Points such as A and B are responsible for the correlation in Fig 11. Points such as B and C are responsible for the correlation in Fig. 13. When one plots these points in Fig. 14, there is no strong correlation. (More generally, if data sets x,y and y,z show correlations, x and z do not necessarily show a correlation; whether or not they do depends on the distribution of the individual data values. See, for example, Casella Berger 2002.)
5.3 Constraints on Metallicities and Potential Implications for Metallicity Evolution
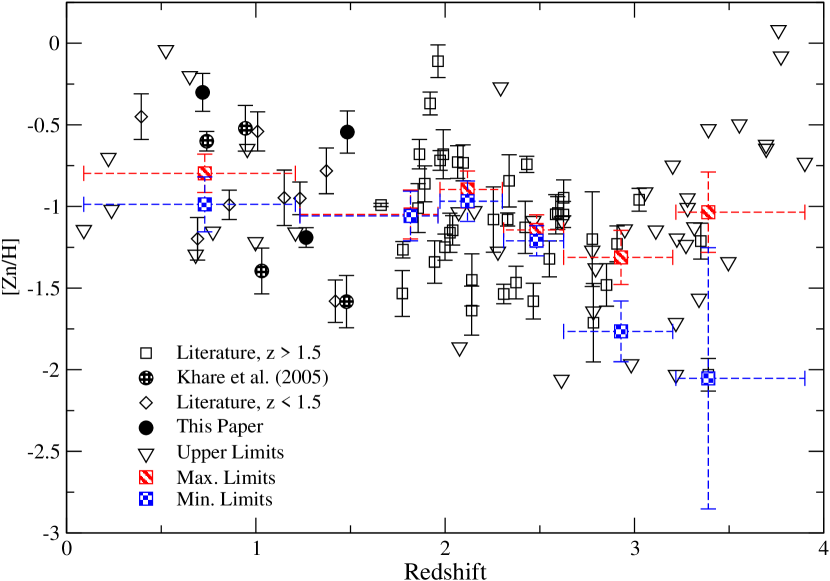
The Zn abundances for our DLAs are listed in Table 5. In 4 of the systems at the abundances of Zn are about 10 solar or lower, while in 2 systems, the abundances are 30-50 solar. We now briefly discuss the implications of our data for the metallicity evolution of DLAs. Our analysis is based on the statistical procedures outlined in Kulkarni & Fall (2002), and uses our data, the data compiled in Kulkarni et al. (2005), and other recent data from the literature (Rao et al. 2005; Akerman et al. 2005). We binned the combined sample of 109 DLAs in 6 redshift bins with 18 or 19 systems each and calculated the global NHI-weighted metallicity in each bin. Figure 16 shows [Zn/H] vs. for the data in the literature as well as from this paper.
We constructed two samples for these 109 DLAs: a “maximum limits” sample where the Zn limits are treated as detections, and a “minimum limits” sample, where the Zn limits are treated as zeros. For an individual system these extreme cases cover the full range of possible values the Zn column densities can take in the case of the limits. The -weighted mean metallicity in the lowest redshift bin is for the “maximum limits” sample and for the “minimum limits” sample. The linear regression slope of the metallicity-redshift relation for the redshift range is for the “maximum limits” sample, and for the “minimum limits” sample. The corresponding estimates for the intercept of the metallicity-redshift relation are for the “maximum limits” sample and for the “minimum limits” sample. Thus our data support the conclusions of Khare et al. (2004) and Kulkarni et al. (2005) that the global mean metallicity of DLAs shows at best a slow evolution with redshift.
6 Conclusions and Future Work
The MMT observations presented here, together with our previous MMT and HST data have more than doubled the DLA Zn sample at and more than tripled the sample at . Combining our data with data from the literature, we find that the systems with higher [Zn/H] also have stronger Cr depletion [Cr/Zn]. Analysis of the -weighted mean metallicity vs. redshift for our sample combined with previous data from the literature supports previous conclusions that the -weighted mean global DLA metallicity rises slowly at best and does not reach solar levels by .
Questions still remain pertaining to dust depletion and selection effects, and linked to this, the metallicity-redshift relationship of DLAs. Despite the large improvement from our surveys, DLA samples at are still relatively small. Clearly, more observations of DLAs at are needed for improved statistics in this vast epoch ( Gyr). The large number of SDSS absorbers now available present a good opportunity for this purpose.
Two of our systems have higher than the empirical upper limit (log ) that has been attributed to dust obscuration in previous studies. The fairly high Zn abundances in these 2 DLAs suggests that metal-rich DLAs may be a rare class of objects, but can be found in a large enough sample. It would be interesting to confirm the metal-rich nature of these DLAs with higher resolution spectra in the future, and find similar other systems by observing a larger sample. If a large number of such systems are found, they may make a significant contribution to the cosmic budget of metals.
It has been suggested that the low metallicity found in DLAs is caused by metallicity gradients. On the basis of a small sample of objects Chen et al. (2005) reported a difference between emission line and absorption line metallicities. If metallicity gradients are present in DLAs, then metal poor DLAs may be more likely to be found because larger impact parameters are more probable. This may be because (a) they correspond to larger cross-sections and (b) they correspond to less dust. On the other hand, other studies (Schulte-Ladbeck et al., 2005; Bowen et al., 2005) have found no difference between emission and absorption line metallicities for other DLAs. Given that the metallicity gradients are not well established and fairly weak even in nearby spirals, it is not clear if metallicity gradients fully explain the low metallicities seen in DLAs.
So far, no DLA has been observed with a super-solar metallicity. The key to finding such systems may lie in observing faint, reddened QSOs. Vladilo & Péroux (2005) have estimated that dusty DLAs may contribute as much as 17 of the total metals. ( - ) measurements are available from SDSS photometry for thousands of quasars with candidate DLAs and sub-DLAs. It would be interesting to obtain [Cr/Zn] and [Fe/Zn] for a large sample of such objects to study dust depletion patterns in quasar absorbers and to examine trends between quasar reddening and dust depletion.
Acknowledgments
We thank the staff of the MMT observatory for assistance during our observing runs. We thank C. Péroux for helpful comments on an earlier version of this paper and J. Grego for discussions on statistical techniques. JM and VPK gratefully acknowledge support from the National Science Foundation grant AST-0206197 and the NASA/STScI grant GO-9441. PK acknowledges support from the University of South Carolina Research Foundation during a visit there in Spring and Summer 2004. We also would like to thank the anonymous referee for the insightful and helpful comments concerning this paper.
References
- Abazajian et al. (2005) Abazajian K., Adelman J., Agueros M., et al., 2005, AJ, 129, 1755
- Akerman et al. (2005) Akerman C.J., Ellison S.L., Pettini M., Steidel C.C., 2005, A&A, 440, 449
- Bergeson Lawler (1993a) Bergeson S.D., Lawler J.E., 1993a, ApJ, 408, 382
- Bergeson Lawler (1993b) Bergeson S.D., Lawler J.E., 1993b, ApJ, 414, L137
- Bergeson et al. (1994) Bergeson S.D., Mullman K.L., Lawler J.E. 1994, ApJ, 435, L157
- Bergeson et al. (1996) Bergeson S.D., Mullman K.L., Wickliffe M.E., Lawler J.E., Litzen U., Johansson S. 1996, ApJ, 464, 1044
- Boisse et al. (1998) Boisse P., Le Brun V., Bergeron J., Deharveng J., 1998, A&A, 333, 841
- Bowen et al. (2005) Bowen D.V., Jenkins E.B., Pettini M., Tripp T.M., 2005, ApJ, 635, 880
- Casella Berger (2002) Casella G., Berger R.L., Statistical Inference 2nd ed., Duxbury, 2002
- Cen et al. (2003) Cen R., Ostriker J., Prochaska J.X., Wolfe A., 2003, ApJ, 741, 598
- Edvardsson et al. (1993) Edvardsson B., Anderson J., Gustafsson B., Lambert D.L., Nissen P.E., Tompkin J., 1993, A&A, 275, 101
- Khare et al. (2004) Khare P., Kulkarni V.P., Lauroesch J.T., York D.G, Crotts P.S., Nakamura O., 2004, ApJ, 616, 86
- Kulkarni et al. (2005) Kulkarni V.P., Fall S.M., Lauroesch J.T., York D.G, Welty D.E, Khare P., Truran J.W., 2005, ApJ, 618, 68
- Lodders (2003) Lodders K. 2003, ApJ, 591, 1220
- Mishenina et al. (2002) Mishenina T.V., Soubiran C., Travaglio C., Busso M., 2002, A&A, 369,189
- Morton (2003) Morton D.C., 2003, ApJS, 149, 205
- Nestor et al. (2003) Nestor D., Rao S.M., Turnshek D.A., Vanden Berk D., 2003, ApJ, 595, L5
- Peroux at al. (2003) Peroux C., McMahon R.G., Storrie-Lombardi L.J., Irwin M.J., 2003, MNRAS, 346, 1103
- Peroux et al. (2006a) Peroux C., Kulkarni V.P., Meiring J., Ferlet R., Khare P., Lauroesch J.T., Vladilo G., York D.G., 2006a, AA, in press
- Peroux et al. (2006b) Peroux C., Meiring J., Kulkarni V.P., Ferlet R., Khare P., Lauroesch J.T., Vladilo G., York D.G., 2006b, MNRAS, to be submitted
- Pettini et al. (1997) Pettini M., King D.L., Smith L.J., Huntstead R.W., 1997, ApJ, 478, 536
- Pettini et al. (2000) Pettini M., Ellison S.L., Steidel C.C., Shapley A.E., Bowen, D.V., 2000, ApJ, 532, 65
- Prochaska Wolfe (1999) Prochaska J.X., Wolfe A.M., 1999, ApJS, 121, 369
- Prochaska Wolfe (2002) Prochaska J.X., Wolfe A.M., 2002, ApJ, 566, 68
- Rao et al. (2005) Rao S. M., Turnshek D. A., Nestor D. B., 2005, ApJ, in press (astro-ph/0509469)
- Rao et al. (2005b) Rao S.M., Prochaska J.X., Howk C., Wolfe A.M., 2005, AJ, 129, 9
- Schulte-Ladbeck et al. (2005) Schulte-Ladbeck R.E., König B., Miller C.J., Hopkins A.M., Drozdovsky I.O., Turnshek D.A., Hopp U., 2005, ApJ, 625, L79
- Sembach et al. (1995) Sembach K.R., Steidel C.C., Macke R.J., Meyer, R.J., 1995, ApJ, 445, L27
- Steidel C.C. (1998) Steidel C.C., 1998, ApJ, 492, 428
- Webster et al. (1995) Webster R.L., Francis P.J., Peterson B.A., Drinkwater M.J., Masci F.J., 1995, Nature, 375, 469
- Vidal-Majar et al. (1977) Vidal-Madjar A., Laurent C., Bonnet R. M., York D. G., 1977, ApJ, 211, 91
- Vladilo et al. (2001) Vladilo G.,Centurión M., Bonifacio P., Howk J.C., 2001, ApJ, 557, 1007
- Vladilo Peroux (2005) Vladilo G., Peroux C., 2005, A&A, 444, 461
- Welty et al. (1999b) Welty D.E., Hobbs L.M., Lauroesch J.T., Morton D.C., Spitezer L., York D.G., 1999, ApJS, 124, 465
- Welty et al. (1991) Welty D.E., Hobbs L.M., York D.G., 1991, ApJS, 75, 425
- Wiess et al. (1996) Wiess W.L., Fuhr J.R., Deters T.M., 1996 J. Phys. Chem. Ref. Data, Monograph 7
- Wild Hewett (2005) Wild V., Hewett P.C., 2005, MNRAS, 361, L30
- Wild et al. (2006) Wild V., Hewett P.C., Pettini M., 2006, MNRAS, 367, 211
- Wolfe at al. (1995) Wolfe A. M., Lanzetta K. M., Foltz C. B., Chaffee F.H., 1995, ApJ, 454, 698
- Wolfe et al. (2005) Wolfe A.M., Gawiser E., Prochaska J.X., 2005, ARAA 43, 861,918
- York et al. (2006) York D.G., Khare P., Vanden Berk D., Kulkarni V.P., Crotts A.P.S., Lauroesch J.T., Richards G.T., et al., 2006, MNRAS, 367, 945