FLUORINE ABUNDANCE VARIATIONS AS A SIGNATURE OF ENHANCED EXTRA MIXING IN RED GIANTS OF THE GLOBULAR CLUSTER M4
Abstract
We show that enhanced extra mixing in low-mass red giants can result in a fluorine abundance that is correlated with abundance variations of other elements participating in H burning, such as C, N, O and Na. This finding is used to explain the fluorine abundance variations recently found in bright red giants of the globular cluster M4.
1 Introduction
In many galactic globular clusters, there are star-to-star abundance variations of C, N, O, Na, Mg and Al, while the heavier elements show almost no dispersion (see reviews by Denissenkov 2004b; Gratton et al. 2004, and references therein). The signs of these variations, their pairwise correlations, and the constancy of the sum of C+N+O in some clusters (Pilachowski 1988; Smith et al. 1996; Ivans et al. 1999) indicate that we are most likely seeing the by-products of H burning in the CNO–, NeNa–, and MgAl–cycles. Regarding their production place and process, the most plausible alternatives proposed so far include the so-called hot-bottom burning of hydrogen at the bottom of convective envelope in intermediate-mass () asymptotic giant branch (IM-AGB) stars (D’Antona et al. 1983; Ventura et al. 2001), and the hydrogen shell burning in low-mass () red giant branch (RGB) stars (Sweigart & Mengel 1979; Denisenkov & Denisenkova 1990; Langer & Hoffman 1995). The former case would imply primordial abundance variations in the RGB stars where the abundance anomalies are observed, while the latter explanation would require in situ mixing. The physical interpretation of these results is therefore significant for understanding the origin of these anomalies.
Recently, Smith et al. (2005a) have added 19F to the list of nuclides whose abundances vary from star to star in globular clusters. They have found a deficit of the fluorine abundance ([F/Fe]111We use the standard spectroscopic notation: [A/B] = , where and are number densities of the nuclides A and B. ) anti-correlated with the abundance of Na in 7 bright red giants of the globular cluster M4. The range of the fluorine abundance variation is 0.8 dex. Since 19F is effectively destroyed in the hot-bottom H burning in the reaction 19F(p,O, while low-mass stars have so far been considered as its net producers (Forestini et al. 1992; Jorissen et al. 1992), Smith et al. (2005a) have interpreted their measurements as an indication that the star-to-star abundance variations in globular clusters originated in the IM-AGB stars.
In this paper, we give an alternative interpretation of the new observational data by demonstrating that low-mass RGB stars could produce the F–Na anti-correlation in exactly the same way as they contribute to the global O–Na anti-correlation (Denissenkov & VandenBerg 2003; Denissenkov et al. 2006).
2 IM-AGB and RGB Pollution Scenarios
In some globular clusters, the O–Na and Mg–Al anti-correlation and the N–Na correlation have been found not only in evolved RGB stars but also in main-sequence (MS) turn-off and early subgiant stars. Because these stars have interior temperatures that are too low for the NeNa- and MgAl-cycles to work, they must have abundance variations that predate the RGB phase; these are either present ab initio or reflect accretion of material from IM-AGB stars (Briley et al. 1996; Gratton et al. 2001; Ramírez & Cohen 2002; Cohen et al. 2002; Briley et al. 2002; Grundahl et al. 2002; Harbeck et al. 2003).
In IM-AGB stars, the envelope material processed in hot-bottom H burning is immediately delivered to the interstellar medium via a strong stellar wind. On the other hand, in RGB stars the H-burning shell is separated from the bottom of the convective envelope by a radiative zone. However, extensive spectroscopic data on the surface chemical composition of low-mass RGB stars as a function of luminosity, supported by appropriate stellar models, show that most of these stars experience some extra mixing that connects the H burning shell with the convective envelope (Sweigart & Mengel 1979; Charbonnel 1994, 1995; Gratton et al. 2000; Denissenkov & VandenBerg 2003). Near the RGB tip, before undergoing the core He-flash and becoming a horizontal branch star, a low-mass red giant loses a considerable amount of its envelope mass with a stellar wind (D’Cruz et al. 1996), thus depositing products of the H-shell burning to the interstellar medium. In globular clusters, both the IM-AGB stars and the low-mass stars more massive than the present-day MS turn-off stars (i.e. ) have already completed their lives. So, either of them could pollute the globular-cluster interstellar medium with the ashes of H-burning.
Unfortunately, neither the AGB nor the RGB pollution scenario can quantitatively reproduce all of the observed star-to-star abundance variations in globular clusters simultaneously. For example, when destroying 16O in the IM-AGB stars the hot-bottom burning depletes 24Mg even more (Denissenkov & Herwig 2003). It also keeps [C/Fe] (Denissenkov & Weiss 2004). Besides, the third dredge-up in AGB stars should increase the sum of C+N+O (Fenner et al. 2004). None of these theoretical predictions is supported by observations. At present, IM-AGB star models are being modified towards complying with constraints imposed by the element abundance anomalies in globular clusters (e.g., Ventura & D’Antona 2005).
In low-mass RGB stars, extra mixing starts to manifest itself when the H-burning shell, advancing in mass, erases the chemical composition discontinuity left behind by the bottom of convective envelope at the end of the first dredge-up (Gratton et al. 2000; Shetrone 2003). At this moment, the evolution of red giants slows down for a while, which produces a prominent feature (the RGB bump) in the differential luminosity functions of globular clusters (Zoccali et al. 1999; Riello et al. 2003). Therefore, extra mixing in low-mass stars is said to work on the upper RGB, above this bump luminosity. Below the bump luminosity, on the lower RGB, extra mixing is thought to be shielded from the H-burning shell by a gradient in the mean molecular weight associated with the composition discontinuity (Sweigart & Mengel 1979; Charbonnel, Brown & Wallerstein 1998; Denissenkov & VandenBerg 2003) or to operate very slowly (Chanamé et al. 2005; Palacios et al. 2006).
The main problem of the RGB pollution scenario is that for the majority of upper RGB stars, the observed pattern of surface abundance anomalies can only be produced by in situ mixing that only penetrates to the outer part of the H-shell, where the CN branch of the CNO–cycle is operating. This is what Denissenkov & VandenBerg (2003) have called “canonical extra mixing”. They demonstrated that its depth and rate (diffusion coefficient) can be parameterized by any pair of correlated values within the close limits specified by and cm2 s-1, to and cm2 s-1. Here, is the difference between the logarithms of temperature at the base of the H-burning shell and at the maximum depth of extra mixing. Thus, canonical extra mixing can be responsible for the evolutionary decline of [C/Fe] in upper RGB stars, both in the field and in star clusters. It can also explain the decrease in surface Li and 3He abundances with increased , the strong reduction of the 12C/13C isotopic ratio and the slight increase in the N abundance, but it does not affect O, Na, Mg and Al.
However, if extra mixing in upper RGB stars penetrates the H-burning shell deeper than in the canonical case, it could dredge up material deficient in O and enriched in Na (Denisenkov & Denisenkova 1990) and even in Al, under certain assumptions (Langer & Hoffman 1995; Cavallo et al. 1996; Denissenkov & Tout 2000; Denissenkov & Weiss 2000). Denissenkov & VandenBerg (2003) have proposed that in some upper RGB stars canonical extra mixing may be switched to its enhanced mode with much faster and somewhat deeper mixing. If the extra mixing in these stars is driven by differential rotation of their radiative zones then such enhanced extra mixing could be caused by their spinning up as a result of tidal synchronization in close binaries (Denissenkov et al. 2006).
There is also an unexplored possibility that the depth and rate of canonical extra mixing do not remain constant along the whole upper RGB but increase toward its tip. This hypothesis is supported by the following arguments. Firstly, observations show that in some globular clusters the anti-correlated abundance variations of C and N in red giants become larger when stars approach the RGB tip. Moreover, the values of [N/Fe] in some of these stars indicate the dredge-up of material in which not only C but also a fraction of O has been converted into N (Smith et al. 2005b). Secondly, at least in the globular cluster M13, the relative number of upper RGB stars with the O–Na anti-correlation increases with luminosity (Johnson et al. 2005). Note that all of the metal-poor field stars used by Denissenkov & VandenBerg (2003) to calibrate the parameters of canonical extra mixing have , i.e. they are located a magnitude below the RGB tip. Hence, if canonical extra mixing got enhanced within the last magnitude of the upper RGB then Denissenkov & VandenBerg (2003) would not have seen it.
3 19F and Extra Mixing in Upper RGB Stars
3.1 Model Parameters for the M4 Red Giants
The stellar evolution code, input physics and simple diffusion model of extra mixing in upper RGB stars used here have been described by Denissenkov et al. (2006). The code has since been developed to allow studies of the pre-MS and horizontal branch (HB) evolution. As in many other similar codes, our zero-age HB models are constructed using information about the internal structure of the RGB tip models in which the core He-flash just sets in.
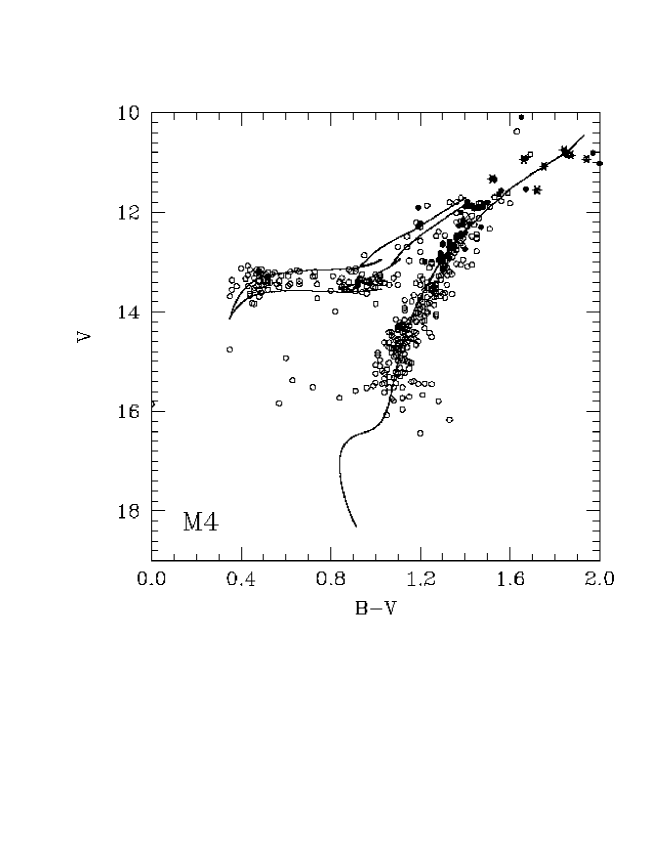
We have found that for a model star with the initial mass , helium and heavy-element mass fractions and our RGB evolutionary track, zero-age HB and HB evolutionary tracks fit the color-magnitude diagram (CMD) of evolved stars in M4 reasonably well (Fig. 1). Our adjusted stellar parameters give a theoretical metallicity [Fe/H] and an age of evolved stars 14 Gyr. In Fig. 1, we have applied the cluster reddening and the distance modulus . Our adopted parameters are in good agreement with those used by Alcaino et al. (1997) who fitted the M4 main-sequence CMD with a 14 Gyr isochrone of Bergbusch & VandenBerg (1992) for , [Fe/H] , and . The spectroscopic metallicity of M4 is [Fe/H] (Ivans et al. 1999).
3.2 19F and Canonical Extra Mixing
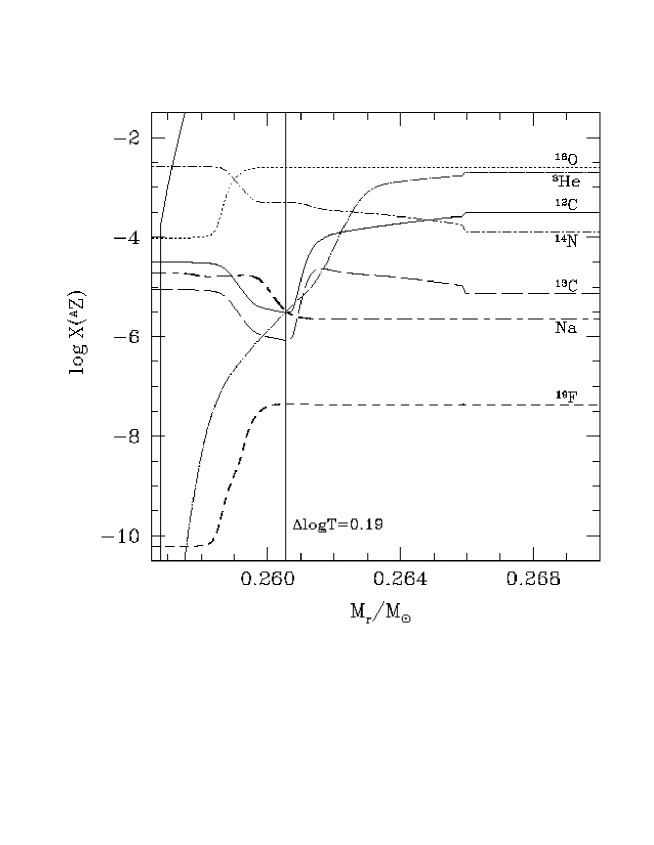
Abundance profiles of some nuclides participating in the H-shell burning, including 19F, in a bump luminosity model star are plotted in Fig. 2. The vertical line marked is shown at a depth characteristic of canonical extra mixing. The nearly vertical line at the left of the plot shows the profile for H; this coincides with the lower edge of the H-burning shell. Canonical extra mixing occurs when the H-burning shell erases the composition discontinuity at the mass coordinate . Most or all stars more luminous than this would show a reduced abundance of 12C (Denissenkov & VandenBerg 2003). However, we see that canonical extra mixing will not change the surface abundance of 19F.
3.3 19F and Enhanced Extra Mixing
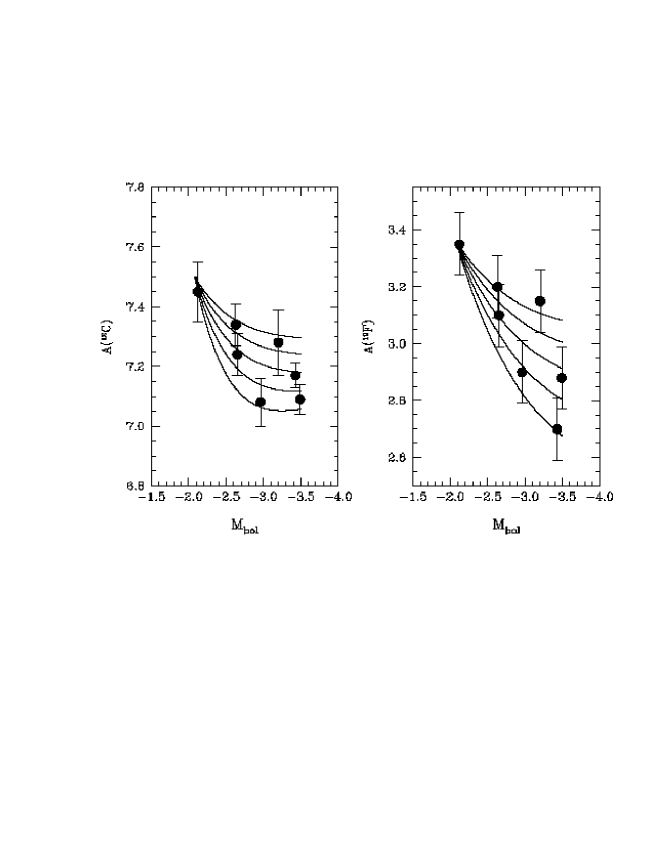
Note that all of the 7 red giants studied by Smith et al. (2005a) are located within one magnitude of the RGB tip (asterisks in Fig. 1). As we have already mentioned in § 2, there are some arguments supporting the idea that at least the depth of canonical extra mixing increases in the vicinity of the RGB tip. In particular, the decline of [C/Fe] becomes stronger within the last magnitude of the RGB, which is accompanied by extremely high N abundances ([N/Fe] ) supposedly signifying the dredge-up of material with O partially processed into N (Smith et al. 2005b). Smith et al. (2005a) claim that they have found a similar decline of the C abundance with the absolute bolometric magnitude in their M4 stars (circles with errorbars in the left panel in Fig. 3).
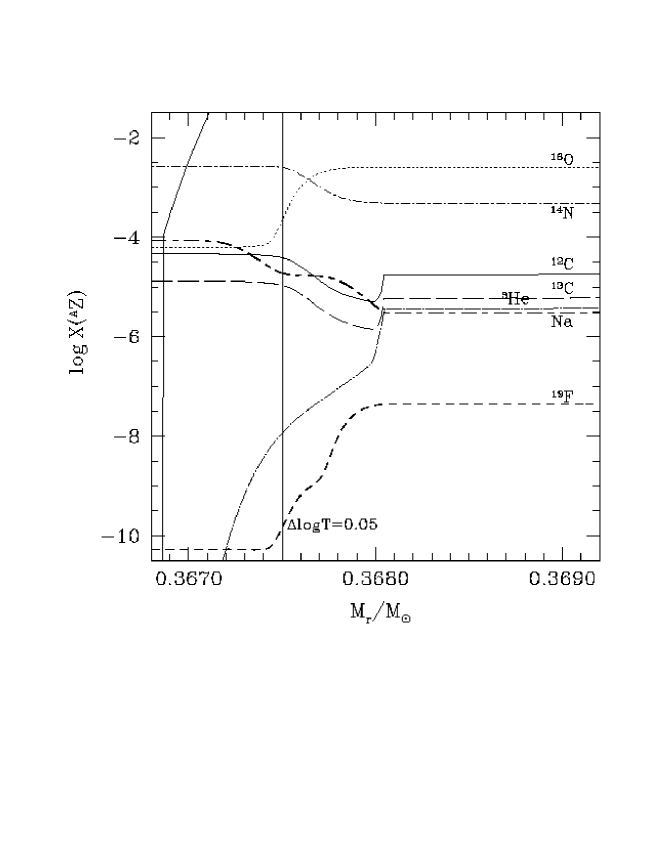
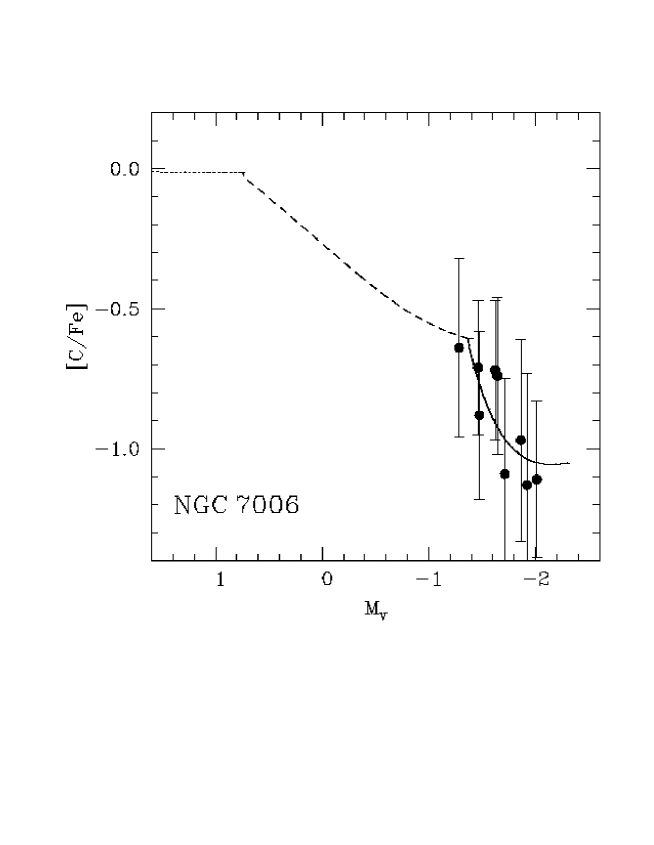
In order to test the hypothesis that canonical extra mixing gets enhanced near the RGB tip, we have proceeded as follows. First, starting with a model at (this value is slightly less than the bump luminosity; it corresponds to , , and ), we have computed its evolution up to (, , and ). In this computation, the depth and rate of extra mixing had their canonical values (Fig. 2) and cm2 s-1, or . Abundance profiles in the radiative zone in the final model are shown in Fig. 4. After that, we have continued our stellar evolution computations toward the RGB tip with increased depth and rate of extra mixing. The parameter has been reduced to 0.05, while for we have considered the following higher values: 9.2, 9.3, 9.4, 9.5, and 9.6. Already looking at Fig. 4, one can conclude that such enhanced extra mixing will dredge up material in which deficits of 16O and 19F should correlate with overabundances of N and Na. Curves in left panel in Fig. 3 demonstrate how the surface C abundance declines with in our models with enhanced extra mixing. In Fig. 5, a combined evolution of [C/Fe] is shown as a function of for the post-first-dredge-up (dotted line), canonical extra mixing (dashed curve), and enhanced extra mixing (solid curve) phases. Here, points with errorbars are data for bright red giants of the globular cluster NGC 7006 from the work of Smith et al. (2005a), the 4 brightest of them having [N/Fe] (given the large uncertainties of the [C/Fe] data in NGC 7006, the difference in metallicities [Fe/H] [Fe/H] is unimportant for the comparison).
Interestingly, if we take the fluorine abundances measured by Smith et al. (2005a) in the M4 red giants at their face values and plot them as a function of , we find a correlation of with (circles with errorbars in right panel in Fig. 3) that looks none the worse than the correlation between and (left panel). Even more interestingly is that the curves in the right panel representing results of our evolutionary computations with enhanced extra mixing could nicely reproduce that correlation if it were real. We also find a theoretical anti-correlation between [Na/Fe] and [F/Fe] that is qualitatively similar to the observational one revealed by Smith et al. (2005a) (Fig. 6).
Therefore, alternatively to the IM-AGB pollution scenario, we propose that the fluorine abundance variations in the red giants of the globular cluster M4 may actually be a signature of enhanced extra mixing in low-mass RGB stars. Moreover, we strongly encourage spectroscopists to increase the size of the sample of bright red giants with known fluorine abundances in globular clusters because if indeed correlates with this will be a direct evidence of enhanced extra mixing in these stars. On the other hand, if the fluorine abundance is not found to decline with increasing luminosity near the RGB tip this will not necessarily reject our hypothesis that its deficit is due to enhanced extra mixing in upper RGB stars. There will still remain a possibility that the star-to-star abundance variations of 19F, like those making up the O–Na anti-correlation, were produced by enhanced extra mixing in the low-mass red giants that had been slightly more massive than the present-day MS turn-off stars in globular clusters and that had completed their lives in the past (the RGB pollution scenario).
We have also examined the possibility that the F/Na anticorrelation could have been produced by larger-than-expected temperature errors. The F abundances were computed using the temperatures determined by Ivans et al. (1999), who obtained them by measuring the line depth ratios of temperature-sensitive species following Gray & Johanson (1991). The stated random errors in the temperature were about 50 K. Using the sensitivity of the abundances to temperature, we find that the dispersion in the F or Na abundances could have been produced if the random errors in temperature were as large as 125 K. Since both lines have the same sense of temperature dependence, however, such large random errors would produce an erroneous correlation between the F and Na abundances, instead of the observed anticorrelation.
Note that for a Salpeter initial mass function the total mass lost by those red giants before they arrived at the zero-age HB is comparable to the mass delivered to the interstellar medium by the IM-AGB stars (Denissenkov 2004a). This estimate assumes that every upper RGB star loses before it undergoes the core He-flash. For comparison, our HB model stars with on the CMD of the globular cluster M4 in Fig. 1 all have , i.e. each of them has lost more than . It is far from clear, however, that the problem of depositing the lost mass from either AGB or RGB stars onto the other stars in the system after they reached the MS has been satisfactorily addressed. For this reason, determining the contribution of direct mixing on the observed abundances is important.
4 Conclusion
In this work, we have shown that the reduced abundances of 19F (i.e. [F/Fe] ) anti-correlated with [Na/Fe] found by Smith et al. (2005a) in the red giants of M4 do not rule out the RGB pollution scenario in which canonical extra mixing switches to its enhanced mode. The enhanced extra mixing could result from tidal spin-up of upper RGB stars in close binaries (Denissenkov et al. 2006). Another possibility is that canonical extra mixing gets enhanced toward the RGB tip due to some internal physical processes in single stars. We emphasize that there is observational evidence of this, one of which could be a correlation of with like that plotted in the right panel in Fig. 3, provided it is confirmed in future spectroscopic observations. At present the reduced fluorine abundance cannot be considered as a strong argument in favor of the IM-AGB pollution scenario as the only plausible interpretation of star-to-star abundance variations in globular clusters. On the contrary, if is correlated with in low-mass stars near the RGB tip, this will support the original hypothesis of Denisenkov & Denisenkova (1990) that extra mixing in upper RGB stars can penetrate the H burning shell deep enough to dredge-up material enriched not only in N but also in Na, and deficient not only in C but also in O and F. A small number of stars in the fast evolutionary phase, at the RGB tip, could explain the absence of field upper RGB stars in which the anti-correlated O and Na surface abundances are produced and dredged up in situ (Gratton et al. 2000).
References
- Alcaino et al. (1997) Alcaino, G., Liller, W., Alvarado, F., Kravtsov, V., Ipatov, A., Samus, N., & Smirnov, O. 1997, AJ, 114, 189
- Bergbusch & VandenBerg (1992) Bergbusch, P. A., & VandenBerg, D. A. 1992, ApJS, 81, 163
- Briley et al. (2002) Briley, M., Cohen, J. G., & Stetson, P. B. 2002, ApJ, 579, L17
- Briley et al. (1996) Briley, M. M., Smith, V. V., Suntzeff, N. B., Lambert, D. L., Bell, R. A., & Hesser, J. E. 1996, Nature, 383, 604
- Cavallo et al. (1996) Cavallo, R. M., Sweigart, A. V., & Bell, R. A. 1996, ApJ, 464, L79
- Chanamé et al. (2005) Chanamé, J., Pinsonneault, M., & Terndrup, D. M. 2005, ApJ, 631, 540
- Charbonnel (1994) Charbonnel, C. 1994, A&A, 282, 811
- Charbonnel (1995) Charbonnel, C. 1995, ApJ, 453, L41
- Charbonnel, Brown & Wallerstein (1998) Charbonnel, C., Brown, J. A., & Wallerstein, G. 1998, A&A, 332, 204
- Cohen et al. (2002) Cohen, J. G., Briley, M. M., & Stetson, P. B. 2002, AJ, 123, 2525
- Cudworth & Rees (1990) Cudworth, K. M., & Rees, R. 1990, AJ, 99, 1491
- D’Antona et al. (1983) D’Antona, F., Gratton, R., & Chieffi, A. 1983, Mem. Soc. Astr. Ital., 54, 173
- D’Cruz et al. (1996) D’Cruz, N. L., Dorman, B., Rood, R. T., & O’Connell, R. W. 1996, ApJ, 466, 359
- Denissenkov (2004a) Denissenkov, P. A. 2004a, Mem. Soc. Astr. Ital., 75, 328
- Denissenkov (2004b) Denissenkov, P. A. 2004b, Astrophys. Space Phys. Rev., 12, 1
- Denissenkov et al. (2006) Denissenkov, P. A., Chaboyer, B., & Li, K. 2006, ApJ, 641, 1087
- Denisenkov & Denisenkova (1990) Denisenkov, P. A., & Denisenkova, S. N. 1990, Soviet Astr. Lett., 16, 275
- Denissenkov & Herwig (2003) Denissenkov, P. A., & Herwig, F. 2003, ApJ, 590, L99
- Denissenkov & Tout (2000) Denissenkov, P. A., & Tout, C. A. 2000, MNRAS, 316, 395
- Denissenkov & Weiss (2000) Denissenkov, P. A., & Weiss, A. 2000, A&A, 358, L49
- Denissenkov & Weiss (2004) Denissenkov, P. A., & Weiss, A. 2004, ApJ, 603, 119
- Denissenkov & VandenBerg (2003) Denissenkov, P. A., & VandenBerg, D. A. 2003, ApJ, 593, 509
- Fenner et al. (2004) Fenner, Y., Campbell, S., Karakas, A. I., Lattanzio, J. C., & Gibson, B. K. 2004, MNRAS, 353, 789
- Forestini et al. (1992) Forestini, M., Goriely, S., Jorissen, A., & Arnould, M. 1992, A&A, 261, 157
- Gratton et al. (2001) Gratton, R. G., Bonifacio, P., Bragaglia, A., et al. 2001, A&A, 369, 87
- Gratton et al. (2004) Gratton, R., Sneden, C., & Carretta, E. 2004, ARA&A, 42, 385
- Gratton et al. (2000) Gratton, R. G., Sneden, C., Carretta, E., & Bragaglia, A. 2000, A&A, 354, 169
- Gray & Johanson (1991) Gray, D. F., & Johanson, H. L. 1991, PASP, 102, 439
- Grundahl et al. (2002) Grundahl, F., Briley, M., Nissen, P. E., & Feltzing, S. 2002, A&A, 385, L14
- Harbeck et al. (2003) Harbeck, D., Smith, G. H., & Grebel, E. K. 2003, AJ, 125, 197
- Johnson et al. (2005) Johnson, C. I., Kraft, R. P., Pilachowski, C. A., Sneden, C., Ivans, I. I., & Benman, G. 2005, PASP, 117, 1308
- Jorissen et al. (1992) Jorissen, A., Smith, V. V., & Lambert, D. L. 1992, A&A, 261, 164
- Ivans et al. (1999) Ivans, I. I., Sneden, C., Kraft, R. P., Suntzeff, N. B., Smith, V. V., Langer, G. E., & Fulbright, J. P. 1999, AJ, 118, 1273
- Langer & Hoffman (1995) Langer, G. E., & Hoffman, R. D. 1995, PASP, 107, 1177
- Palacios et al. (2006) Palacios, A., Charbonnel, C., Talon, S., & Siess, L. 2006, astro-ph/0602389
- Pilachowski (1988) Pilachowski, C. A. 1988, ApJ, 326, L57
- Ramírez & Cohen (2002) Ramírez, S. V., & Cohen, J. G. 2002, AJ, 123, 3277
- Riello et al. (2003) Riello, M., Cassisi, S., Piotto, G., Recio-Blanco, A., De Angeli, F., Salaris, M., Pietrinferni, A., Bono, G., & Zoccali, M. 2003, A&A, 410, 553
- Shetrone (2003) Shetrone, M. D. 2003, ApJ, 585, L45
- Smith & Briley (2005) Smith, G. H., & Briley, M. M. 2005, PASP, 117, 895
- Smith et al. (2005b) Smith, G. H., Briley, M. M., & Harbeck, D. 2005, AJ, 129, 1589
- Smith et al. (1996) Smith, G. H., Shetrone, M. D., Bell, R. A., Churchill, C. W., & Briley, M. M. 1996, AJ, 112, 1511
- Smith et al. (2005a) Smith, V. V., Cunha, K., Ivans, I. I., Lattanzio, J. C., Campbell, S., & Hinkle, K. H. 2005, ApJ, 633, 392
- Sweigart & Mengel (1979) Sweigart, A. V., & Mengel, J. G. 1979, ApJ, 229, 624
- Ventura & D’Antona (2005) Ventura, P., & D’Antona, F. 2005, ApJ, 635, L149
- Ventura et al. (2001) Ventura, P., D’Antona, F., Mazzitelli, I., & Gratton, R. 2001, ApJ, 550, L65
- Zoccali et al. (1999) Zoccali, M., Cassisi, S., Piotto, G., Bono, G., & Salaris, M. 1999, ApJ, 518, L49