Active Galaxies in the UV
Abstract
In this article we present different aspects of AGN studies demonstrating the importance of the UV spectral range. Most important diagnostic lines for studying the general physical conditions as well as the metalicities in the central broad line region in AGN are emitted in the UV. The UV/FUV continuum in AGN excites not only the emission lines in the immediate surrounding but it is responsible for the ionization of the intergalactic medium in the early stages of the universe. Variability studies of the emission line profiles of AGN in the UV give us information on the structure and kinematics of the immediate surrounding of the central supermassive black hole as well as on its mass itself. ultraviolet: galaxies, galaxies: active, galaxies: seyfert, quasars: emission lines, quasars: absorption lines
Keywords:
:1 Introduction
Active Galactic Nuclei (AGN) are the most luminous objects in the universe. Their luminosities, their spectral energy distribution from the radio to the -ray range, as well as their emission line ratios cannot be generated by normal stars. Galaxies containing an active nucleus are called active galaxies. We divide the AGN in different subclasses such as Quasars, Seyfert galaxies and Liners.
Many aspects of the generation of the energy in AGN are still unknown. Accretion of gas onto a central supermassive black hole (SMBH) is generally accepted to be the dominant physical process generating the enormous energies we are observing (Rees Rees (1984)). The accretion flow is the source of the non-thermal continuum emission in the UV, X-ray and optical. The spectral energy distribution (SED) of the non-thermal continuum emission in typical AGN has its maximum in the UV.
The central continuum source ionizes the circumnuclear gas in the so called broad line region (BLR) and narrow line region (NLR). The majority of the most important emission lines are emitted in the UV spectral range. The overall continuum distribution as well as the UV spectral lines (narrow emission lines, broad emission lines, absorption lines) are tracers of the physical conditions of those regions where these emission lines originate. The emission line region of the narrow lines is spatially resolved in some nearby objects. They originate at distances of pc to kpc from the central ionizing source. However, the broad emission lines originate at distances of light days to light months only from the central ionizing source. This BLR is unresolved by orders of magnitudes even for the nearest AGN.
Various excellent reviews about AGN have been published over the past
years.
Different aspects of AGN spectra were highlighted in those papers as e.g.
Netzer (1990), Urry & Padovani (1995), Koratkar & Blaes (1999),
Hamann & Ferland (1999), Veron & Veron (2000),
Ho (2004),
Heckman (2004), Peterson et al. (2004).
This article is devoted to the UV spectral range of AGN.
The UV spectral range is important for our understanding of active galaxies
because;
- the maximum flux of AGN is emitted in the UV.
- the rest frame EUV continuum in highly redshifted AGN is important for
our understanding of the early universe.
- the UV spectra of the class of low luminous AGN can only be observed in the
local universe because of their faintness.
-the most important diagnostic emission and absorption lines are emitted
in the UV: they give
information on the physical conditions in the emission line region next
to the central ionizing source.
-for the study of the cosmological and chemical evolution of AGN the UV
spectra of ’nearby’ objects (Z=0-2) have to be known.
-important far UV diagnostic lines can only be observed in the UV – even
for high redshift objects.
-variations of the emission lines give us information on the structure and
kinematics of the innermost AGN regions. The most important
lines next to the central black hole are emitted in the UV/FUV.
2 The AGN Family
2.1 Seyfert Galaxies and Quasars
Quasars are the most luminous subclass of the AGN family having nuclear magnitudes of . Seyfert galaxies are by definition those AGN with . Besides a strong non-thermal continuum their spectra are dominated by broad permitted emission lines in the UV and optical. Typical observed line widths (full width at half maximum (FWHM)) are with maxima of up to . The line widths are interpreted as Doppler motion of the BLR clouds where these lines are emitted. The non-thermal ionizing source in AGN is surrounded by the central BLR clouds at distances of less than 1 pc ( to about cm). Typical electron densities in these emission line regions are for temperatures of about T20.000 K. Most of the important diagnostic lines of this BLR are emitted in the UV spectral range – except for the optical Balmer and a few Helium lines.
In the spectra of Seyfert 2 galaxies only narrow (permitted and forbidden) emission lines with typical line widths (FWHM) of are present in contrast to those of Seyfert 1 galaxies and quasars. These narrow emission lines originate at distances of about 100 to 1000 pc from the center. Electron densities in the range from to are derived for typical electron temperatures of 10.000 - 25.000 K. Even if many of the narrow emission lines are emitted in the optical wavelength range too – the most important ones are emitted in the UV.
2.2 Low Luminosity AGN
Low Luminosity AGN (LLAGN) refers to those objects with H luminosities less than 1039 erg s-1. They are the most abundant type of AGN and reside in of bright galaxies in the local universe (Heckman 1980; Ho et al. 1996). There are evidence that LLAGN may consist of two different subclasses. The first subclass is accretion onto small black holes, i.e., a scaled version of Seyfert galaxies (Filippenko & Ho 2003; Barth et al. 2004; Greene & Ho 2005). In the second subclass, it is the very low accretion rate that leads to low nuclear luminosity but otherwise with black holes of similar masses to those in quasars and Seyfert galaxies (e.g., Di Matteo et al. 2003). Both classes of objects have attracted much attentions in the past decade because of their role in the history of black hole growth in the universe and the accretion physics. The black hole-host galaxy connection in the low mass end of black hole, which is likely in their infants, is crucial to the origin of such relations in the massive quiescent and active galaxies, which were found in the last five years (e.g., Magorrian et al. 1998; Gebhardt et al. 2000; Ferrarese et al. 2001), and clues to the formation of seeded BH in the early universe. The state of very lower accretion rate is the end point of the AGN evolution and provides the test-bed for accretion process at very low rate, which is in a very different form from those seen in Seyfert galaxies and quasars. Very low radiative efficiency and the lack of big blue bump is the major prediction of theoretical models for the latter type (e.g., Narayan et al. 1998). Thus the ultraviolet observation is critical to discriminate the two possibilities.
Owing to the weakness of the active nuclei, stellar light usually dominates the continuum emission in the optical band even at the resolution of Hubble Space Telescope. As stellar spectrum drops rapidly towards ultraviolet in most of LLAGN, UV observation is one of the most important spectral regimes for exploring the continuum properties of those objects. Reverberation mapping of broad line region described in the next section can only be carried out in ultraviolet for this type of AGN since one has to measure precisely small variations in the continuum flux. In addition, these AGN are so faint, only nearby objects can be studied in detail. However, they are much less studied in the UV than other type of AGN due to their intrinsic faintness (Maoz et al. 1999).
The majority of these sources show characteristics of Low Ionization Nuclear Emission Line Region (LINER), which can be produced either through photo-ionization of the AGN/young stellar clusters or shock process (Heckman 1980). Some key issues that might be solved with future UV observations include: (1) How much fraction of LINERs are powered by nuclear activity, how much by star forming process and what is the role of shocks? Measuring high excitation lines (such as CIII/CII) in UV is critical to distinguish photo-ionization process by the central continuum from opaque shock ionization models (Dopita & Sutherland 1996). The measurement of UV absorption lines of young stellar component or the featureless AGN continuum will allow to determine the contribution of the ionizing source, directly. (2) What is the UV continuum spectrum of these active nuclei, which is closely related to the truncate radius of the geometrically thin and optically thick part of the disk and coupling between electron and proton in the case of low rate accretion onto large mass BH (Quataert et al., 1999), or to the global energy output in the accretion onto low mass AGN. (3) How does the BLR structure of LLAGN fit into the whole picture of AGN? There is indirect evidence that the size of BLR in LLAGN deviates systematically from the relation extrapolated from the known one for Quasars and Seyfert galaxies (Wang & Zhang 2003). But a direct measurement of the size of BLR by reverberation mapping is required.
3 Spectral Energy Distribution and rest frame EUV continuum in AGN
The mean broadband continuum spectral energy distribution (SED) for radio-quiet and radio-loud AGN is shown in Fig.1. The flux scale has been normalized at 1 m.
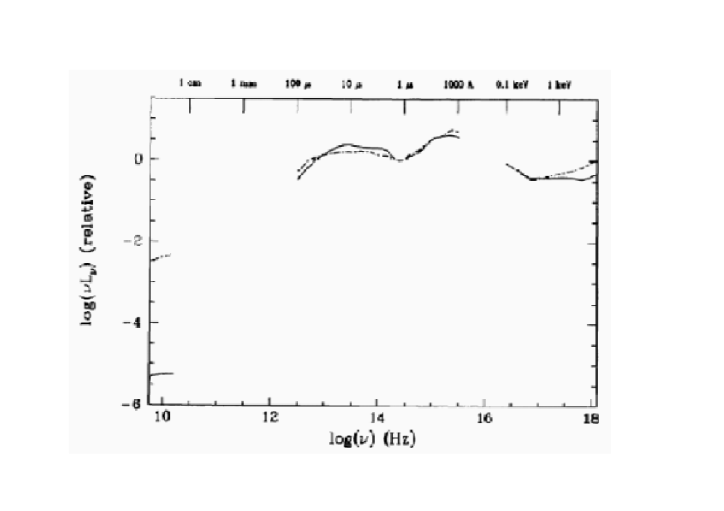
The AGN continuum flux is relatively flat from the radio to the X-ray range. The bulk of this flux is thought to arise from synchrotron emission. Besides a bump in the infrared due to thermal dust reemission the overall continuum flux peaks additionally in-between the optical and soft X-ray spectral range in the UV. This spectral feature is sometimes called the big blue bump. More than half of the bolometric luminosity of an (un-obscured) AGN is emitted in this big blue bump. The big blue bump is thought to arise from an accretion disk surrounding the central black hole. Gravitational energy from the central accretion flow is converted into the observed UV radiation of the disk. The thermal emission in the UV corresponds to typical temperatures of K (e.g.Koratkar & Blaes (1999)).
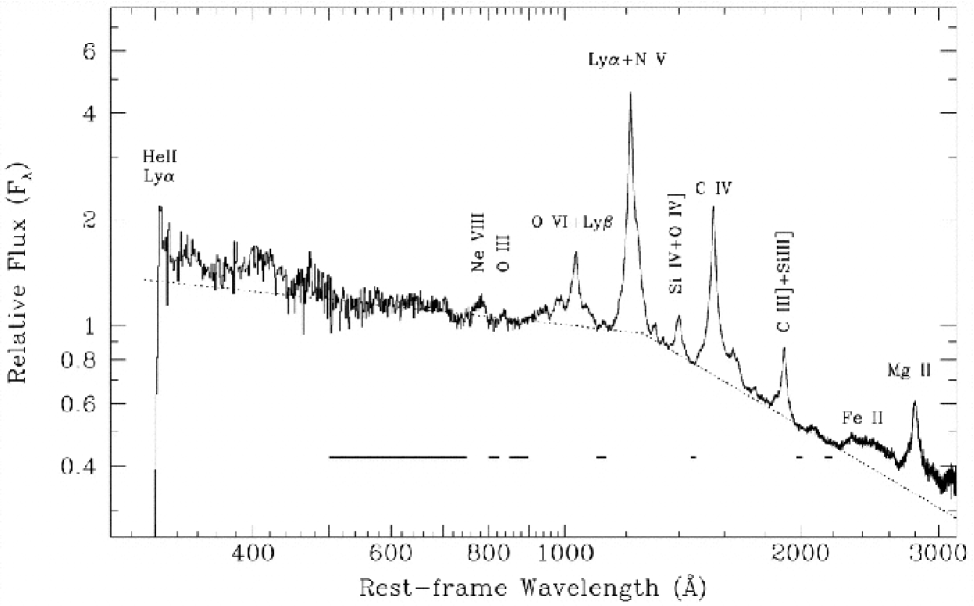
The study of the UV/EUV spectral range is very difficult because of the absorption caused by our own galaxy, the intrinsic absorption in distant galaxies, as well as the absorption in the intergalactic medium. Fig. 2a shows the UV composite spectrum derived from more than 2000 AGN spectra. Before combining the spectra Telfer, Zheng, Kriss, & Davidsen (2002) corrected them for internal and external extinction as good as possible. The dotted line shows accretion disk models of Mathews & Ferland (1987). The dashed line corresponds to simple power law models with a thermal cutoff corresponding to a temperature of K. Fig. 2b again shows a composite optical–soft X-ray spectrum for radio-loud and radio-quiet quasars. One can see the flux is peaking not as extreme as model calculations of accretion disk models predict (e.g. Laor et al. (1997)) .
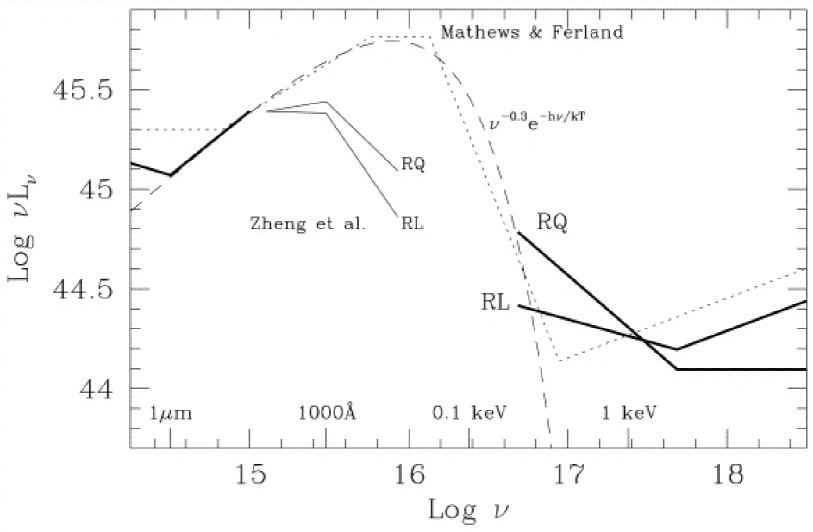
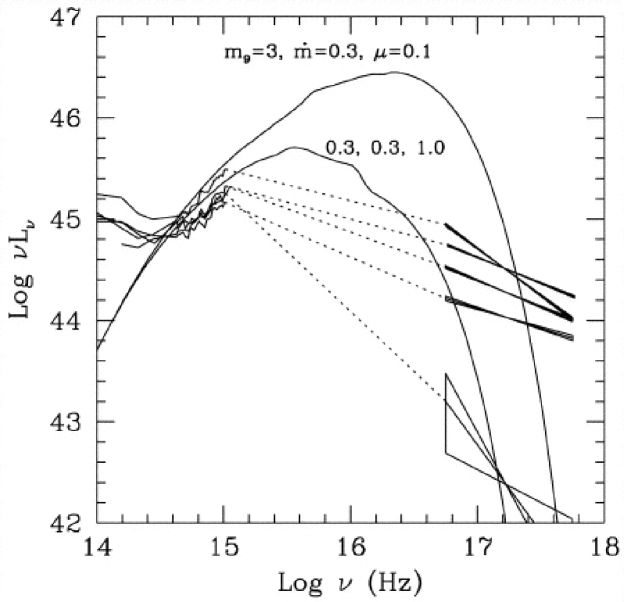
Right: Observed energy distribution of some quasars vs. two accretion disk model spectra (Laor et al., 1997).
The accretion disk models cannot reproduce in a simple way the observed spectral shape. There are indications in the observed composite AGN spectra that the spectral index brakes at 1000 . Observational difficulties are caused by dust obscuration and the contamination of the host galaxy. Furthermore, the composite spectrum has been derived from different classes of AGN. Far more observations in the UV of all classes of AGN are needed to understand the details of accretion disks surrounding the central black hole in AGN.
The knowledge of the UV/FUV spectral shape of quasars is of outmost importance for our understanding of the evolution of the early universe. The UV continuum of quasars ionizes the intergalactic medium at the end of the dark ages. At z6 the neutral hydrogen has been re-ionized by the ionizing radiation of quasars at very early stages of the universe.
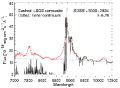
The epoch of the ionization of HeI and HeII is even less clear. Fig. 3 shows a spectrum of the high redshift quasar SDSSJ1030+0524 (z=6.28) with the UV spectral template of Telfer, Zheng, Kriss, & Davidsen (2002). The Gunn-Peterson absorption troughs show no emission over a redshift interval of 0.2 starting at z=6.
4 UV emission line diagnostics
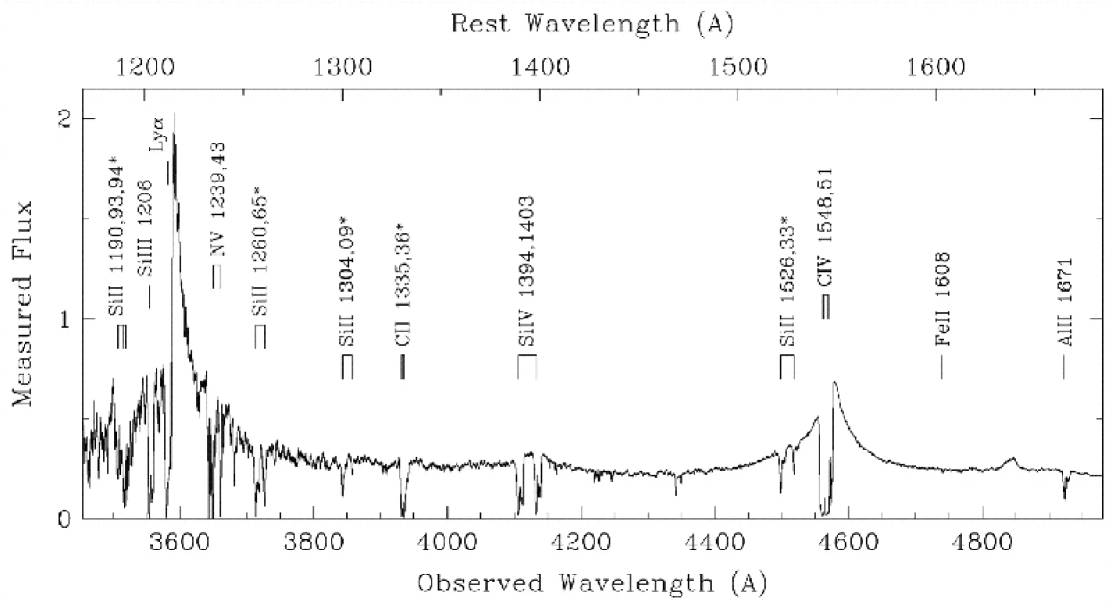
A UV spectrum of the Seyfert 1 galaxy NGC 4151 is shown in Fig.4.
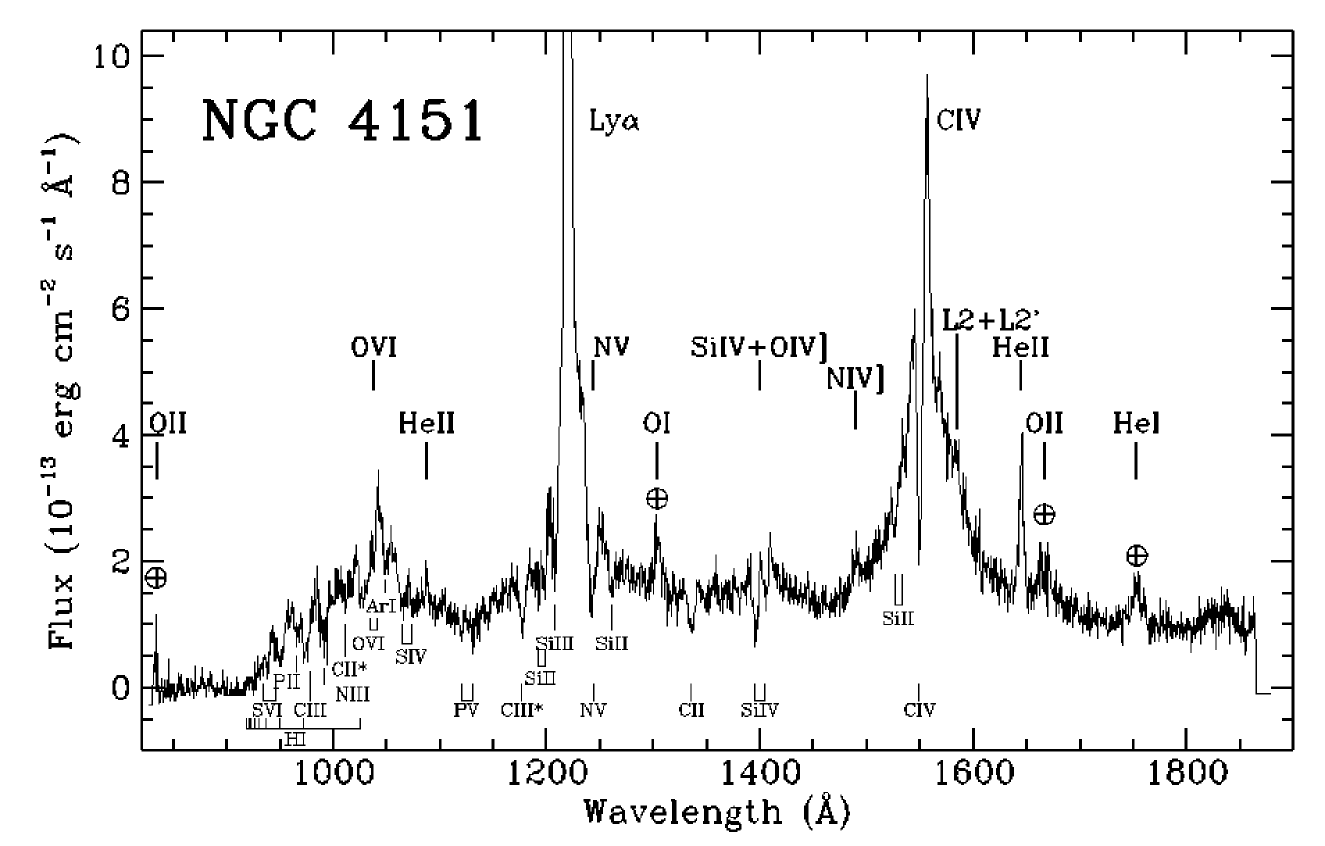
Some emission lines as well as some absorption features are indicated in Fig. 4. The spectrum has been taken with the Hopkins Ultraviolet Telescope (HUT) (Kriss et al., 1992). The most important AGN diagnostic lines between 950 and 2000Å̃are: CIII 977, NIII 991, Ly+OVI 1034, Ly, NV 1240, OI 1303, CII 1335, SiIV+OIV] 1394,1402, NIV] 1486, CIV 1549, HeII 1640, OIII] 1663, NIII] 1750, and CIII] 1909. These emission lines show a wide range of ionization states. They originate at different distances from the central ionizing source in clouds with densities from .
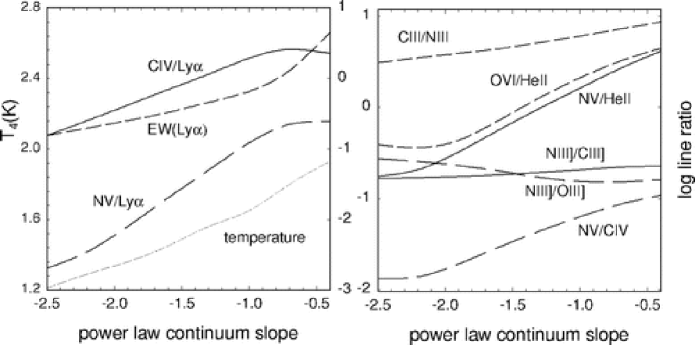
Photoionization calculations predict line flux ratios we can compare with the observations. Fig. 5 shows a series of calculations of emission line ratios for different slopes of the ionizing continuum flux (from Hamann & Ferland, 1999).
4.1 Metalicities
The determination of the heavy element abundances in AGN is one further aspect of quasar emission line studies. This is connected with the investigation of the chemical evolution of the universe as quasars can be observed at extreme distances and therefore at very large look-back times. Surprisingly, the broad line spectra of nearby AGN resemble those of the most distant quasars. Furthermore, there are indications in the spectra of some distant luminous quasars that their metalicity abundances are very high even at z5 (e.g. Ferland et al. (1996)).
In early investigations of AGN spectra the collisionally excited inter-combination lines NIII]1750, NIV]1486, OIII]16664, CIII]1909 have been used to derive the abundance ratios of the elements nitrogen, oxygen and calcium (e.g.Shields (1976),Davidson (1977),Baldwin & Netzer (1978). But these diagnostic lines are weak in most spectra. Furthermore, the densities in the BLR () are near the critical densities of these lines. Therefore these lines have different degrees of collisional suppression.
Permitted lines might be better candidates
for deriving the element abundances in AGN. Detailed
calculations have been carried out (e.g.
Hamann et al. (2002))
proving the sensitivity of the UV broad emission lines
with respect to the metalicity in AGN spectra.
The most important diagnostic lines are
NIII991, NV1240, CIII977, CV1550,
CIV+OIV1034, HeII1640.
All these diagnostic lines are emitted in the UV. It is possible to derive the metalicities only for distant (z2) as well as luminous quasars when the diagnostic lines are shifted into the optical range. Very few is known about nearby and/or low luminous AGN. But it is necessary to have this information for deriving the chemical evolution of the universe.
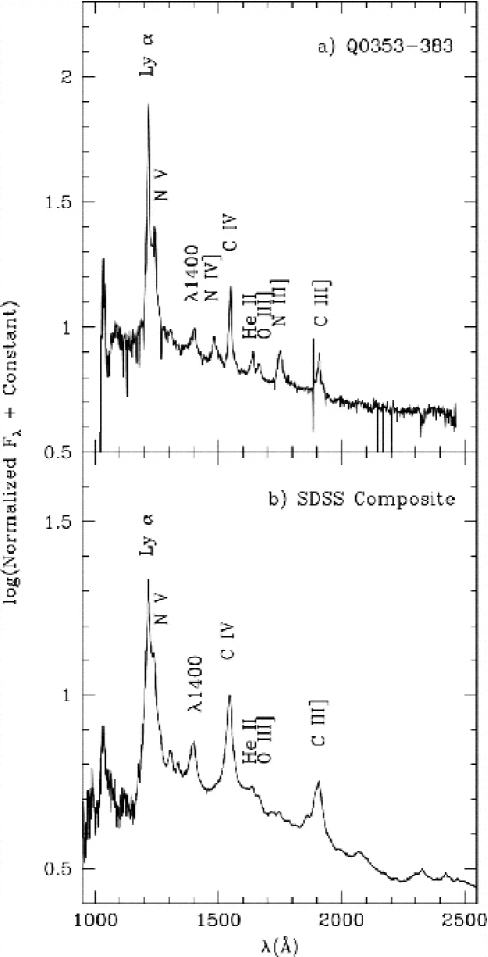
A few very interesting AGN show clear indications of abundance anomalies as e.g. Q0353-383 (Osmer & Smith (1980)). But they are rare and nothing is known about their evolution and their number in the present day universe. Very recently Bentz, Hall, & Osmer (2004) checked the Sloan Digital Sky Survey for all nitrogen-rich quasars. They investigated more than 6000 quasars with appropriate redshifts that the important UV diagnostic lines were shifted into the optical range. Only four candidates show very strong nitrogen emission lines comparable to those in the spectrum of Q0353-383 (see Fig.6). This means that only about one in 1700 distant quasars (z2) has extreme nitrogen over-abundances.
Further spectra of nearby and distant, as well as of bright and low luminous AGN are needed to understand these galaxies within the overall AGN population. There is the basic question whether the nitrogen enrichment is a short phase in an AGN lifetime only or whether only a certain percentage of quasars reaches extremely high metalicities. We need UV spectra to detect high or even very high metalicities in present day AGN to answer this question.
4.2 Far UV diagnostic lines
Very few is known about line strengths of diagnostic emission lines in the extreme ultraviolet spectral range between 300 and 900 . Composite far UV spectra have been constructed from the spectra of highly redshifted QSOs taken with the Hubble Space Telescope (HST) and the Far Ultraviolet Spectroscopic Explorer (FUSE). They show the HeII304 and HeI584 lines as well as the high ionization NeVIII+OIV lines at 772 and OIII at 831 (Telfer, Zheng, Kriss, & Davidsen (2002), Scott et al. (2004)) (see Fig.7, Telfer et al.).
Considerably more UV spectra of intermediate and high redshift AGN are needed to compile far UV spectra with better S/N ratio and to investigate the spectral details of different classes of AGN.
The UV and EUV diagnostic lines are of outmost importance to understand the AGN phenomenon. Their properties reflect the highest energetic areas next to the central black holes in AGN.
4.3 UV Absorption lines
Broad blue shifted resonant absorption lines in ultraviolet have been detected in 10-20% optically selected quasars (wey91), while narrow intrinsic absorption lines are much more common ( 40% of Seyfert galaxies and 20-30% in quasars; Hamann & Sabra (2004) and references therein). The predominance of blue-shift among absorption lines suggests that partially ionized gas outflows from the active nucleus. Recent X-ray observations with moderate spectral resolution have found similar blue-shifted absorption lines in the X-ray bands (e.g., Collinge et al. (2001) ). There are suggestion that the mass loss rate and kinetic energy associated with the outflow may be large and can have significant impact on the structure of disk itself if it is disk-wind and on the ISM of the host galaxies. But evidence for this is still ambiguous for following reasons. Because strong UV absorption lines may be severely saturated and partially covering, the column density and ionization state of major UV absorbing ions are poorly determined (e.g., Arav et al. (2001)). Although the total absorption column density can be better determined from photo-electronic absorption in X-rays, very little information about velocity structure of X-ray absorption line/edge can be obtained from the current data. Resonant line absorptions in X-ray can be a very powerful diagnostics of properties of ions at different level of ionizations, but spectral resolution comparable to those in optical and UV band will not be available within next decade. Therefore, it is necessary to observe the weak absorption lines of the same elements that produce strong absorption lines in order to derive both the covering factor and column density as a function of velocity. Most these lines fall in the spectral domain of far to extreme ultraviolet. Figs.8,9 shows absorption lines in the UV spectral range of 3C191 taken with Keck (Hamann et al., 2001) and of Mrk509 taken with FUSE (Kriss et al., 2003).
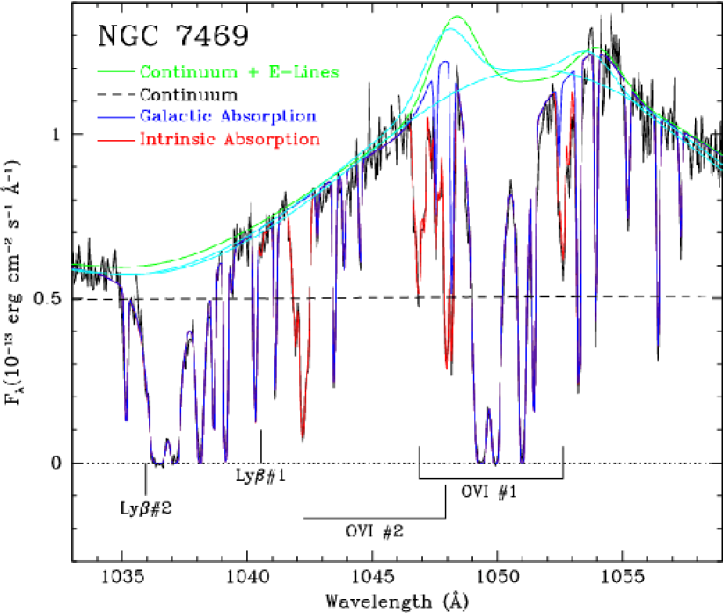
UV observations, simultaneously in soft X-rays with future more sensitive X-ray missions, may improve our understanding of the problem in several aspects: (1) Simultaneous observations of UV and soft X-ray absorption of low red-shift AGN would allow to determine the total column densities of material, especially those at the ionization level similar to that of UV absorbing material, and ionization states of the X-ray absorbing material (Wang et al. 2000). At the same time we get velocity structure information from UV absorption lines. This will permit a detailed modeling of the physical state of outflows. (2) By studying absorption lines in UV bright 2 BAL QSOs, we will obtain the kinematical properties of absorption lines of highly ionized species at far UV. Comparison of those with low ionization species will allow to study the changes in the kinematics with ionization state, thus to bridge the gap between that with X-ray absorbing material in these objects. Observing bright BAL QSOs will also allow to better determine the shape of the ionizing continuum, one uncertainty in the modeling of the ionization structure of absorbing gas. (3) Variations of intrinsic UV absorption lines can put strong constraints on the density of the absorbing material, and thus give an upper limit on the distance to the continuum source. If these observations are carried out simultaneously in soft X-rays for low-z AGN, one might distinguish the variations caused by changes in the flow and ionization effect (e.g.,Gebel et al. (2002)). (4) Comparison of abundances derived from absorption lines with those from emission lines will give an independent check of those derived from emission lines.
5 Structure and kinematics of the central region in AGN
The innermost line emitting region in AGN – the broad emission line region (BLR) – surrounds the central supermassive black hole at distances of about to cm. This corresponds to radii of light days to light months. The motions of the line emitting clouds give us information on the mass of the central black hole (e.g. Kasp00,Peterson et al. (2004)). The broad-line region is spatially unresolved even in the nearest AGN. But we can derive the structure and kinematics with indirect methods by studying their line and continuum variability (e.g. Kollatschny (2003),Horne et al. (2004).
5.1 Reverberation mapping
In a first step one has to correlate observed light-curves of integrated broad emission line intensities with the ionizing continuum light curve. It is of great advantage to observe the ionizing flux in the UV since the optical continuum flux is far more contaminated by the stellar continuum flux of the host galaxy.
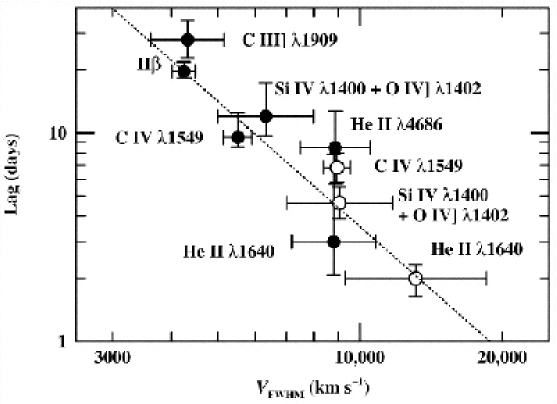
Fig. 10 shows the results of an optical/UV variability campaign (including HST observations) of the prototype Seyfert galaxy NGC5548 (Peterson & Wandel (1999)). Plotted is the time lag of the emission lines with respect to continuum variations as a function of their linewidth (FWHM) in the rms profiles. The time lag corresponds to the mean distance of the line emitting region from the central ionizing source. One can see a clear trend: the higher ionized lines originate closer to the central source. UV lines originate about ten times closer to the center than optical emission lines. The most successful monitoring campaign of the integrated UV lines of an AGN has been carried out for NGC5548 so far (Clavel et al. (1991), Korista et al. (1995)). Variability campaigns of e.g. 3C390.3 (O’Brien et al. (1998)) and Akn 564 (Collier et al. (2001)) demonstrated the power of UV reverberation studies but the S/N ratio and/or the fractional variability amplitudes of the continuum variations were not strong enough for detailed line profile studies.
Future monitoring campaigns of many galaxies including the UV spectral range of the highly ionized OVI lines (1032,1038) e.g. will uncover the innermost broad line region in AGN.
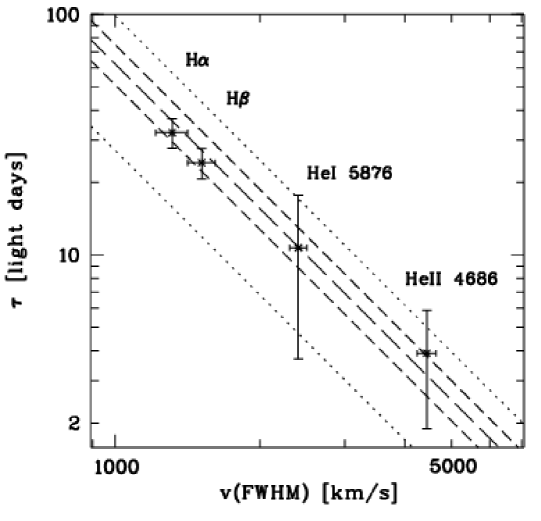
The clear trend that higher ionized emission lines originate closer to the center has been seen in optical variability campaigns of e.g. Mrk 110 too (see Fig. 11)(Kollatschny (2003)). But the most important lines for reverberation studies are: CV1550, SiIV+OIV]1400, HeII1640, NV1240, CIV+OIV1034 (see Fig.10). These lines give us information about the immediate surrounding of the central black hole one order of magnitude closer than we can do it with optical lines.
The line profile variations of UV lines should be studied in a second step. They gives us information on the kinematics in the broad line region. Detailed profile variations have been studied in the optical lines of Mrk 110 (Kollatschny & Bischoff (2002),Kollatschny (2003)) only so far. Different delays of emission line segments (the velocity-delay maps) measure the geometry and flow of the line emitting gas when we compare observed two-dimensional velocity-delay maps with model calculations (e.g.Welsh & Horne (1991)).
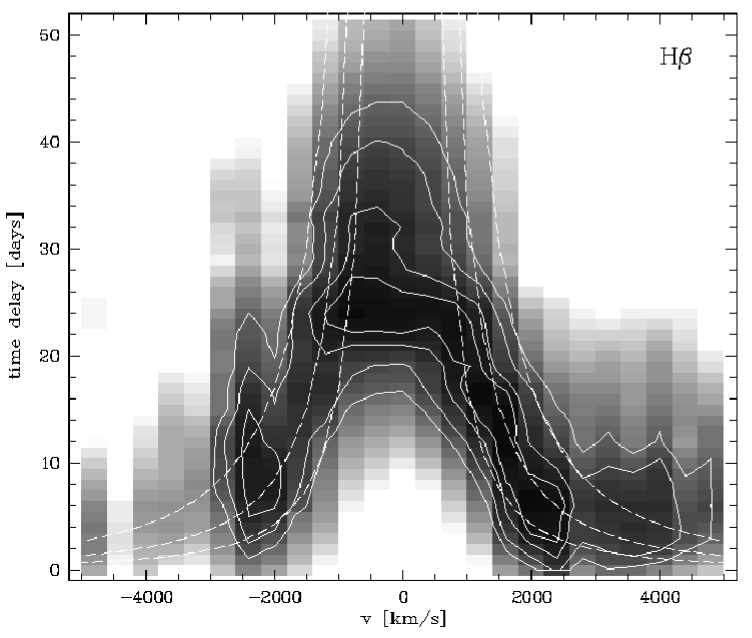
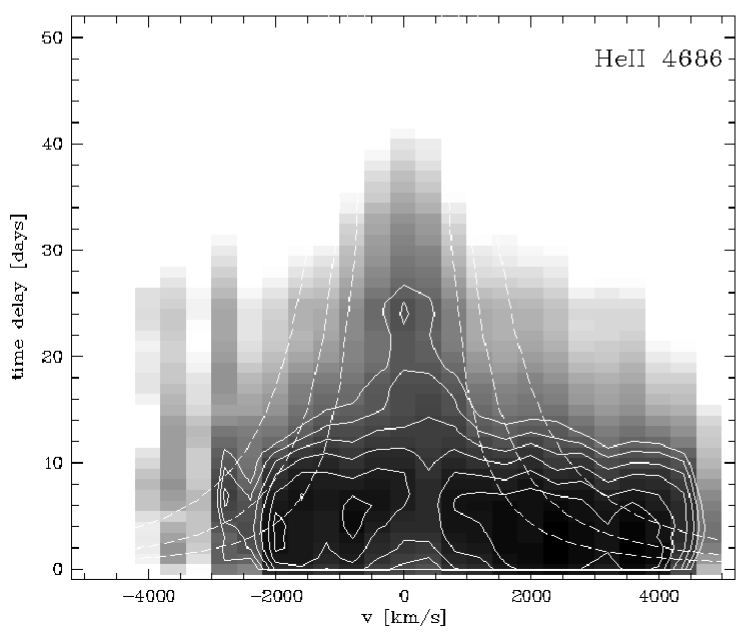
Fig. 12 shows the correlation of H and HeII4686 line profile segments with continuum variations. The data are from the variability campaign of Mrk 110 taken with the 10m Hobby Eberly Telescope at McDonald Observatory. Only Keplerian disk BLR models can reproduce the observed fast and symmetric response of the outer line wings. The H line center originates at distances of 25 light-days while the HeII line center originates at distances of 4 light-days only.
5.2 Central Black Hole mass in AGN
It is possible to calculate the central black hole mass in AGN. One has to know the distances of the line emitting clouds as well as the velocity dispersion of these clouds (e.g. Peterson et al. (2004)). We derived a central black hole mass of in Mrk110. In that case we used additional information about the projected angle of the accretion disk where the broad emission lines originate Kollatschny (2003). A Schwarzschild radius of corresponds to this black hole mass.
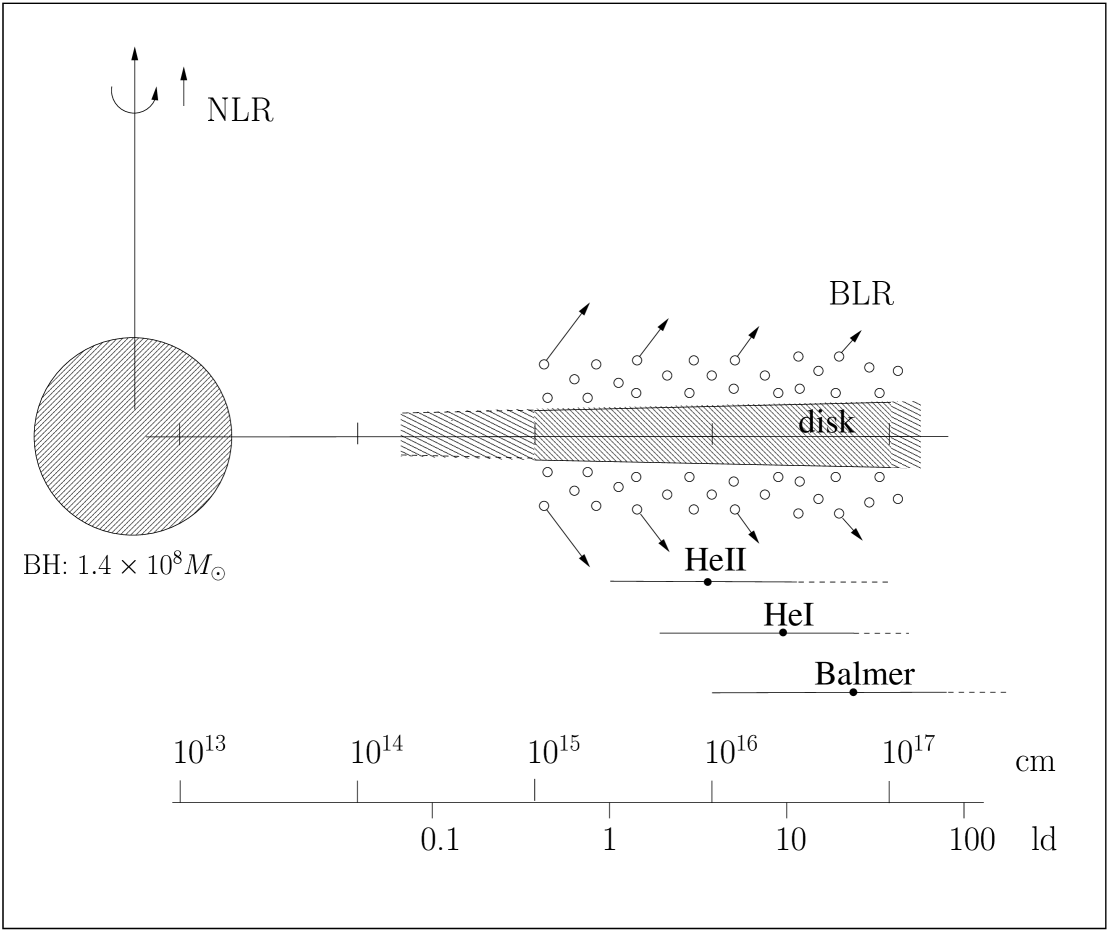
Fig. 13 shows the inner broad line region structure of Mrk 110 derived from 2D-reverberation mapping. The HeII line originates at a distance of 230 Schwarzschild radii only from the central black hole. The monitoring of highly ionized UV lines in AGN enables us to study the physics of the immediate environment of black holes even more closer to the center. This helps us to derive the central black hole mass more precisely. Finally, we will achieve a clear progress in our knowledge of black hole physics by monitoring different types of AGN in the UV.
References
- Arav et al. (2001) Arav, N., et al., 2001, ApJ, 561, 118
- Baldwin & Netzer (1978) Baldwin, J. A. & Netzer, H. 1978, ApJ, 226, 1
- Barth et al. (2004) Barth, A.J., Ho, L.C., Rutledge R.S., Sargent W.L.C., 2004, ApJ, 607, 90
- Bentz, Hall, & Osmer (2004) Bentz, M. C., Hall, P. B., & Osmer, P. S. 2004, AJ, 128, 561
- Clavel et al. (1991) Clavel, J. et al., 1991, ApJ, 366, 64
- Collinge et al. (2001) Collinge, M.J., et al., 2001, ApJ, 557, 2
- Collier et al. (2001) Collier ,S.,Crenshaw , D. M., Peterson ,B. M., W. N. Brandt W.N. et al., 2001, ApJ, 561, 146
- Davidson (1977) Davidson, K. 1977, ApJ, 218, 20
- Di Matteo et al. (2003) Di Matteo,T., Allen, S.W. Fabian A.C., Wilson A.,Young A.,J. 2003, ApJ, 582, 133
- Dopita & Sutherland (1996) Dopita M.A., Sutherland R.S., 1996, ApJS,102,16
- Elvis et al. (1994) Elvis, M., Wilkes, B.J., McDowell, J.C., Green, R.F. et al. 1994, ApJS, 95, 1
- Ferland et al. (1996) Ferland, G. J., Baldwin, J. A., Korista, K. T., Hamann, F., Carswell, R. F., Phillips, M., Wilkes, B., & Williams, R. E. 1996, ApJ, 461, 683
- Ferrarese et al., (2001) Ferrarese L., Pogge R. W., Peterson B. M., Merritt D., Wandel A., Joseph C. L., 2001, ApJ, 555, L79
- Filippenko & Ho (2003) Filippenko A.V., Ho, L.C., 2003,ApJ, 588, L13
- Gebhardt et al., (2000) Gebhardt K., et al., 2000, ApJ, 539,
- Gebel et al. (2002) Gebel J.R., et al. 2003, ApJ, 595, 120
- Hamann & Ferland (1999) Hamann, F. & Ferland, G. J. 1999, ARAA, 37, 487
- Hamann et al. (2001) Hamann, F., Barlow, T. A.; Chaffee, F. C.; Foltz, C. B.; Weymann, R. J. 2001, ApJ, 550, 142
- Hamann et al. (2002) Hamann, F., Korista, K. T., Ferland, G. J., Warner, C., & Baldwin, J. 2002, ApJ, 564, 592
- Hamann & Sabra (2004) Hamann, F., & Sabra, B., 2004, in ASP conf Series 311, ed. G.T., Richards & P.B. Hall, (San-Francisco ASP), 203
- Heckman (1980) Heckman, T.M., 1980, A&A, 87, 142
- Heckman (2004) Heckman, T.M., 2004, in Coevolution of Black Holes and Galaxies, from the Carnegie Observatories Centennial Symposia. Published by Cambridge University Press, ed. L. C. Ho, p. 359.
- Ho et al. (1997) Ho, L.C., Filippenko, A.V., Sargent, W.L.W., 1997, ApJ, 487, 568
- Ho (2004) Ho, L., 2004, in Coevolution of Black Holes and Galaxies, from the Carnegie Observatories Centennial Symposia. Published by Cambridge University Press, ed. L. C. Ho, p. 292.
- Horne et al. (2004) Horne, K., Peterson, B.M., Collier, S.M., Netzer, H., 2004, PASP, 116, 465
- Kaspi et al. (2000) Kaspi, S., Smith, P.S., Netzer, H., Maoz, D., Jannuzi, B.T., Giveon, U. 2000, ApJ, 533, 631
- Kollatschny & Bischoff (2002) Kollatschny, W. & Bischoff, K. 2002, A&A, 386, L19
- Kollatschny (2003) Kollatschny, W. 2003, A&A, 407, 461
- Koratkar & Blaes (1999) Koratkar, A. & Blaes, O. 1999, PASP, 111, 1
- Korista et al. (1995) Korista, K. T., et al. 1995, ApJS, 97, 285
- Kriss et al. (1992) Kriss, G. A.; Davidsen, A. F.; Blair, William P. et al. 1992, A&A, 392, 485
- Kriss et al. (2003) Kriss, G. A.; Blustin, A.; Branduardi-Raymont, G.; Green, R. F.; Hutchings, J.; Kaiser, M. E. 2003, A&A, 403, 473
- Laor et al. (1997) Laor, A., Fiore, F., Elvis, M., Wilkes, B. J., & McDowell, J. C. 1997, ApJ, 477, 93
- Magorrian et al., (1998) Magorrian J., et al., 1998, AJ, 115, 2285 L13
- Mathews & Ferland (1987) Mathews, W. G. & Ferland , G. J. 1987, ApJ, 323, 456
- Maoz et al. (1999) Maoz D. et al., 1999, AJ, 116, 55
- Narayan (1998) Narayan R., Mahadevan R., Grindlay J.E., Popham R.G., Gammie C., 1998, ApJ, 492, 554
- Netzer (1990) Netzer,H. 1990, in Active galactic nuclei, Saas-Fee advanced course 20., T.J.-L. Courvoisier et al. eds, p.57
- O’Brien et al. (1998) O’Brien, P. T. et al. 1998, ApJ, 509, 163O
- Osmer & Smith (1980) Osmer, P. S. & Smith, M. G. 1980, ApJS, 42, 333
- Peterson et al. (2004) Peterson, B. M., Ferrarese, L., Gilbert, K.M., Kaspi, S. et al. 2004, ApJ, 613, 682
- Peterson & Wandel (1999) Peterson, B. M. & Wandel, A. 1999, ApJ, 521, L95
- Quatert et al. (1999) Quataert E., di Matteo T., Narayan R., Ho L.C., 1999, ApJ, 525, L89
- Rees (1984) Rees M., 1984, ARA&A, 22, 471
- Scott et al. (2004) Scott, J. E., Kriss, G. A., Brotherton, M., Green, R. F., Hutchings, J., Shull, J. M., & Zheng, W. 2004, ApJ, 615, 135
- Shields (1976) Shields, G. A. 1976, ApJ, 204, 330
- Telfer, Zheng, Kriss, & Davidsen (2002) Telfer, R. C., Zheng, W., Kriss, G. A., & Davidsen, A. F. 2002, ApJ, 565, 773
- Urry & Padovani (1995) Urry, C. M. & Padovani, P. 1995, PASP, 107, 803
- Veron & Veron (2000) Veron, M. P. & Veron, P. 2000, Astron.Astrophys Rev., 10, 81
- Wang et al. (2000) Wang, T. G., Brinkmann, W., Yuan, W., Wang, J. X., & Zhou, Y. Y. 2000, ApJ, 545, 77
- Wang & Zhang (2003) Wang T.G., Zhang X.G., 2003, MNRAS,340,793
- Welsh & Horne (1991) Welsh, W. F. & Horne, K. 1991, ApJ, 379, 586
- White et al. (2003) White, R. L., Helfand, D. J., Becker, R. H., Gregg, M. D., Postman, M., Lauer, T. R., & Oegerle, W. 2003, AJ, 126, 706