Deep GMOS Spectroscopy of Extremely Red Galaxies in GOODS-South: Ellipticals, Mergers and Red Spirals at
Abstract
We have performed a deep (35.5 hours exposure) spectroscopic survey of extremely red () galaxies (ERGs) on the GOODS-South Field, using the GMOS spectrograph on the 8m Gemini South Telescope. We present here spectra and redshifts for 16 ERGs at , to a limit of . In the spectra of 10 of these galaxies we find emission lines of [OII], with fluxes corresponding to a mean star formation rate (uncorrected for dust) of . For 3 ERGs we detect no emission lines and the remaining 3 lie at where this line would be outside our wavelength range. Absorption features are seen in most ERG spectra.
We examine the morphologies of these ERGs on HST-ACS images and fit radii and Sersic indices. We find three broad classes: (i) spheroidals; (ii) mergers at a variety of stages (some are spheroidal-disk pairs, some have tidal tails), often with a high surface brightness, and (iii) red spirals (which may have star-forming regions in their outer disks).
We perform an age-dating analysis by fitting the spectra and 9-band photometry (, plus 3.6/4.5 fluxes from Spitzer) of the ERGs with two-component models, consisting of passively evolving, old stellar populations combined with a younger, continuously star-forming component, for which the age and dust extinction are allowed to vary from 10–800 Myr and to 0.5 mag. For only one ERG is the best-fit model purely passive, for the others the best-fit is obtained by including a star-forming component, which typically forms a few (0.26–13.5) percent of the stellar mass, and is subject to dust reddening averaging . The ages of the star-forming components tend to be youngest (10–40 Myr) in the merging ERGs, and older (200–800 Myr) in spiral ERGs, with mixed ages for the spheroidals.
The best-fitting mean ages for the old stellar populations range from 0.6 to 4.5 Gyr, averaging 2.1 Gyr, with masses from to . The mean stellar formation redshifts of ERGs are spread from Gyr before the epoch of observation out to . We propose that most ERGs are galaxies, or mergers of galaxies, formed some Gyr earlier, in an early () phase of massive galaxy formation, which since then have experienced a wide variety of merger and star-formation histories, accounting for the wide range of observed stellar ages.
Finally, we examine the clustering of the ERGs on this field, as a function of the photometric redshifts estimated by Caputi et al. (2004). The comoving correlation radius is Mpc for the full sample and, dividing by redshift, is constant or increasing with redshift, thus favouring comoving () evolution over a stable () clustering model.
keywords:
galaxies: evolution, galaxies: high-redshift, galaxies: distances and redshifts1 Introduction
The ‘extremely red galaxies’ (ERGs, also known as EROs) are a population of faint and distant galaxies, appearing in large numbers faintward of , with very red optical/near-infrared colours ( or ), corresponding to galaxies which are already old and passively evolving at . The ERGs are of great importance in understanding galaxy evolution, in particular they represent an evolutionary link between the rapidly star-forming galaxies detected by SCUBA at , and present-day massive E/S0 galaxies.
A key property of ERGs is their strong clustering, as revealed by measurements of their angular correlation function, (e.g. Daddi et al. 2000; Firth et al. 2002; Roche et al. 2002; Roche, Dunlop and Almaini 2003). Assuming a comoving model of clustering evolution, these observations give for ERGs a correlation radius – Mpc (where ), which supports their interpretation as the progenitors of giant ellipticals.
However, ERGs are actually a very diverse population of galaxies. Spectroscopic observations find that some are indeed old, passive galaxies at (e.g. Dunlop 1996); however, at least half of the ERGs show emission lines (Cimatti et al. 2002; Yan et al. 2004a) indicating ongoing star formation. Radio, X-ray (Daddi et al. 2004) and mid-IR (Yan et al. 2004b) observations indicate that many emission-line ERGs are actually undergoing major starbursts, with star-formation rates (SFRs) as high as –100 . Secondly, deep X-ray surveys reveal at least per cent of ERGs to host obscured AGN (Alexander et al. 2002; Roche et al. 2003). Thirdly, ERGs are morphologically diverse; a mixture of bulges, disks, irregulars and mergers (e.g. Yan and Thompson 2003; Cimatti et al. 2003).
Initially we (Roche et al. 2002) colour-selected a sample of 158 ERGs with on the ELAIS N2 field. We found evidence of strong clustering and a mixture of morphologies, and identified 7 ERGs as radio sources (either AGN or powerful starbursts). We also fitted the ERG number counts with a model in which they evolve into the present-day E/S0 population, through a combination of passive luminosity evolution, merging, and a gradual increase with time in the comoving number density of red galaxies.
For our second study (Roche, Dunlop and Almaini 2003, hereafter RDA03), deeper optical (HST-ACS) and near-IR (VLT-ISAAC) data enabled us to colour-select 198 ERGs to a fainter limit of , on a central region of the Chandra/GOODS Deep Field South. For the clustering of these ERGs we estimated Mpc, and we identified 17 ERGs with X-ray sources in the 1-Msec Chandra survey (Giacconi et al. 2002), from the X-ray fluxes diagnosing 13 as obscured AGN and the other 4 as probable starbursts.
In our third study, Caputi et al. (2004) fitted template spectra to the 7-band optical/near-IR photometry of these same ERGs to derive photometric redshift estimates, which in turn were used to estimate stellar masses and luminosity functions. Caputi et al. (2005) then extended this analysis to the full sample of galaxies on this field (see Section 6).
In this paper we further investigate the CDFS ERGs by means of a deep optical spectroscopic survey, with the Gemini Multi-object Spectrograph (GMOS). We aim to measure redshifts and emission lines for a sample of ERGs to a limit –21, and furthermore to estimate the ages of these galaxies by fitting evolving models to their spectra and broad-band fluxes (including new 3.6/4.5 fluxes from Spitzer). We shall interpret and discuss these results and make comparisons with the photometrically-based analysis of Caputi et al. (2004, 2005) and the recent spectrographic surveys of ERGs presented by Yan et al. (2004a), McCarthy et al. (2004), Daddi et al. (2004 and 2005) Doherty et al. (2005) and Longhetti et al. (2005).
In Section 2 of this paper we describe the optical/NIR data from RDA03 and our new GMOS observations, and in Section 3 the reduction and calibration of the spectroscopic data. In Section 4 we present spectra for the ERGs where we have secure or probable redshifts, fit models to estimate ages and masses, and measure emission-line fluxes. In Section 5 we describe the morphology of the ERGs and estimate their size and surface brightness. In Section 6 we re-examine the clustering of the RDA03 ERGs as a function of spectroscopic and photometric redshift, and in Section 7 conclude with interpretation and discussion.
Throughout this paper the assumed cosmology is , , and km , in accord with the recent (3 year WMAP) estimates of Spergel et al. (2006). This gives the age of the Universe as 14.16 Gyr. Magnitudes are given in the Vega system except where labelled by subscript as AB magnitudes, the conversion between the two being .
2 Observations
2.1 Optical/NIR Imaging
The Chandra Deep Field South forms one of the two fields of the publically available European Southern Observatories (ESO) Great Observatories Origins Deep Survey (GOODS). As an early part of GOODS, deep imaging in the near-IR , and bands was obtained for a central region of the CDFS, covering 50.4 and centered at RA , Dec. (equinox 2000.0), using the ISAAC camera on the ‘Antu’ Very Large Telescope (at the ESO site at Cerro Paranal, Chile). Also as part of GOODS, the central CDFS was mapped in four bands () with the Hubble Space Telescope Advanced Camera for Surveys (ACS) (Giavalico et al. 2004). Most recently, the GOODS Field South is currently being surveyed with Spitzer at 3.6–24 . For this paper we have available 3.6 and 4.5 fluxes for the galaxies on this field, derived from the ‘epoch 2’ data release of May 2005.
Firstly, to define our ERG sample, we ran the source detection program SExtractor on the mosaiced ISAAC -band data, to obtain a sample of galaxies (with completeness limit ). For more details of this, see RDA03. With SExtractor we measured for these galaxies both total and aperture (2.0 arcsec diameter circular) magnitudes.
These galaxies were positionally matched to the corresponding detections on the ISAAC and mosaics and the ACS images. Colours were measured for each as the differences in the 2.0 arcsec aperture magnitudes, and the ERG sample was then selected as the galaxies redder than , which numbered 198 in the 50.4 area. We numbered these objects 1 to 2555 using their order of detection in the catalog.
For the galaxies studied in this paper we also measure 3.6 and 4.5 fluxes from the Spitzer ‘epoch 2’ data release of May 2005. The Spitzer data has a lower resolution of arcsec. Because of this, larger apertures of 2.8 arcsec diameter were employed to measure the Spitzer fluxes, and to these fluxes aperture corrections of 0.5 mag for and 0.55 mag for were applied, as derived from the point-spread function.
2.2 Spectroscopic Observations
The target galaxies for our GMOS survey form a subset of the RDA03 sample, consisting primarily of the brighter, , ERGs within a arcmin area that can be covered by a single GMOS mask. A spectrograph mask was prepared with 47 slitlets (each of length 2.0 arcsec and width 1.0 arcsec) devoted to our target ERGs. Figure 1 shows their positions within the larger area of our CDFS sample.

Observations were performed with GMOS on the Gemini South telescope in Chile, over the period from 24 September 2003 to 21 February 2004, using the low-dispersion, R150 grating and central wavelengths in the region of . In total we were able to obtain 70 exposures, totalling 35.5 hours, through the ERG slit mask. These science observations were interspersed with CuAr arc lamp and standard star exposures, for wavelength and flux calibration.
These observations utilized GMOS in the the ‘nod-and-shuffle’ mode described in detail by Abraham et al. (2004). The sky background is a serious problem for ground-based spectroscopy, especially at redder, , wavelengths where there are strong emission lines. The ‘nod-and-shuffle’ mode was designed to provide improved subtraction of the sky background, even where this is subject to considerable spatial and time variation. Essentially, the telescope is ‘nodded’ (by 1 arcsec in this case) along the spectroscopic slit, observing at each position alternately in a rapid one-minute cycle. In position A the object will be towards one side of the slit and the adjacent sky on the other, in position B the object will be on the other side. With each cycle, the charges stored on the CCD from the two positions are ‘shuffled’ (by 2 arcsec) into adjacent strips on the CCD frame, where they are accumulated over the course of each half-hour exposure. In this way the sky is observed simultaneously with, and as close as possible in position to, each individual target galaxy.
3 Data Reduction
GMOS data reduction was carried out using IRAF routines, including some specifically written for this instrument. Firstly, bias frames were subtracted from the target galaxy, arc-lamp and standard star exposures. The next step was sky subtraction, performed individually for each of the 70 exposures. The nod-and-shuffle mode produces a CCD frame showing two adjacent strips for each spectrograph slit, corresponding to the two nod positions. To sky subtract, the frame is shifted by the shuffle step and subtracted it from itself (using the IRAF ‘gnsskysub’ task). This produces a positive and a negative sky-subtracted spectrum for each target galaxy.
Small dithers in the spectral and spatial directions between the 70 exposures (introduced intentionally for the removal of charge traps; Abraham et al. 2004) were removed by registering the 70 exposures in both axes. The 70 sky-subtracted frames could then be combined, using IRAF ‘imcombine’ with a ‘sigclip’ rejection to remove most of the cosmic rays, into a single 35.5 hour image, from which we extract the spectra.
IRAF tasks (e.g. ‘apall’) were then employed to extract the 2D spectra from each slit, summing each in the spatial direction to give a 1D spectrum. With nod and shuffle it is necessary to extract both the positive and a negative spectrum for each object, and then subtract one from the other.
The galaxy spectra were wavelength calibrated using the CuAr lamp calibration spectrum as observed through the same slit of the mask. Each pixel is approximately and the resolution of our spectra Flux calibration was performed using a co-added spectrum of the calibration standard star LTT1020, and the spectral energy distribution of this star as tabulated by Hamuy et al. (1994), to derive (using IRAF ‘sensfunc’) a sensitivity function for the spectrograph (Fig 2a).
Corrections were also applied to the spectra for the telluric (Earth’s atmosphere) absorption bands, using our calibration spectrum of a white-dwarf standard star (these having few intrinsic spectral features), EG131. This was divided by a fit to its own continuum, giving a function almost flat at unity except for four telluric absorption bands, centred at 6560, 6875, 7610 and . These were extracted, converted into magnitude units, and inserted into a function to give a telluric correction function.
The ERG spectra were divided by this correction function and by the sensitivity function, to give spectra calibrated in (in units of ergs , i.e. ), and (in units ergs ), ready for further analysis.

4 Spectra of the ERGs
4.1 Defining the Redshift Sample
On examining the GMOS spectra we found that our survey had a good rate of success for ERGs to , but failed to reach the fainter limit of the target list. Of our 47 spectra of ERG targets, 16 were galaxy spectra of sufficient quality that we were able to determine good or, at least, likely redshifts. 17 showed no significant signal, 13 had some signal in the continuum but we were unable to confidently identify any spectral features above the noise, and one was identified as a red Galactic star. The 16 ‘successful’ spectra include 13 of the 18 target ERGs with , 3 of the 6 target ERGs with but none fainter than this.
Redshifts were estimated by a combination of (i) fitting models to the continuum, by the method described below, (ii) identifying absorption features, and (iii) from emission lines such as [OII] , where present. For galaxies with an emission line we determine both an emission () and a continnum-fit/absorption-line () redshift. In all cases we found the two consistent within the statistical error on . Where both are given is likely to be more precise.
Two of these redshifts, for the galaxies 1843 and 1158, are based on spectral features of poor signal-to-noise and must be regarded as less reliable than the other 14. However these two redshifts are supported by very good fits of our model spectra to the 7-band photometry.
We therefore define a redshift sample comprised of these 16 ERGs. The 16 redshifts range from to , with 6 in a ‘spike’ at , which may be indicative of large-scale structure. One of the 16 ERGs, ID no. 1843, corresponds to a Chandra source. This is XID:253 in the list of Giacconi et al. (2002), with a flux and hardness ratio () indicative of an obscured AGN (see RDA03).
4.2 Comparison with Spectroscopy of Other Authors
Some of the objects in our redshift sample were recently observed spectroscopically by other authors, in separate and independent studies, published during the writing of this paper – Vanzella et al. (2005), who used FORS2 on the VLT, and Doherty et al. (2005), using DEIMOS on Keck. For objects in the overlap between these surveys, we make a brief comparison of the spectra.
(i) Our object 1152 is in Vanzella et al. (2005) as GDS J033239.64-274709.1. The FORS2 spectrum gave , consistent with our , and similarly shows weak [OII] emission, and absorption lines. 1152 is also object 2800 in Doherty et al. (2005), observed with DEIMOS giving , with absorption.. Neither spectrum goes far enough into the red to see well the Balmer lines.
(ii) Object 1029 was observed as GDS J033235.79-274734.7. The FORS2 spectrum gave , consistent with our , and is very similar to ours, with strong [OII] emission and some absorption features, including (weak) Balmer lines.
(iii) Object 1412 is GDS J033235.78-274627.5. The FORS2 spectrum gave , consistent with our , and like ours shows [OII] emission. The H8 and H9 lines we find are not identified on the FORS2 spectrum, but it extends further into the red to reveal and absorption. Thus on the basis of both spectra this seems to be a strong Balmer absorption galaxy.
(iv) Object 1777 was not observed in the FORS2 survey.
(v) Object 2536 is GDS J033231.83-274356.2. The FORS2 spectrum gave , slightly higher than our . Like our GMOS spectrum it features MgII () absorption, and extends a little further redwards, detecting an [OII] emission line.
(vi) Object 1064 is GDS J033230.02-274726.8. The FORS2 spectrum gave , a close match to our , and detects MgII () absorption, and a weak [OII] emission line at the reddest extreme,
(vii/viii/ix) Objects 1143 and 1565 and 2401 were not observed in the FORS2 survey.
(x) Object 1876 is GDS J033230.34-274523.6. The FORS2 spectrum gave , slightly higher than our . The FORS2 spectrum, like ours, shows MgII () absorption, [OII] emission and Balmer lines, extending further redwards to . 1876 is also number 2158 in the Doherty et al. (2005) DEIMOS sample, where it has and , absorption, very weak [OII], and is classed as
(xi) Object 2246 is GDS J033229.82-274510.8. The FORS2 spectrum gave , slightly greater than our . Like our spectrum it shows [OII] emission and absorption, the spectra are very similar but ours has better signal-to-noise.
(xii/xiii) Objects 1823 and 1955 were not observed in the FORS2 survey.
(xiv) Object 1762 is GDS J033227.02-274407.2. The FORS2 spectrum gave , slightly higher than our , and like ours shows moderate [OII] emission and weak Balmer absorption. The authors mark but it is barely visible.
(xv) Objects 1843 and 1158 were not observed in the FORS2 survey. However, the AGN 1843 was observed with VLT FORS in an earlier survey of Chandra sources. Szokoly et al. (2004) initially proposed on the basis of a single unidentified line. Zheng et al. (2004) claimed on the basis of a single line, this time supported by photometric redshifts from COMBO-17 and hyper-. However, for our 9-band photometry we obtain a hyper- solution of , and our continuum is significantly better fitted for than . Considering that photometric redshifts are uncertain by at least , we retain as a provisional and approximate estimate. Near infra-red spectroscopy should detect multiple emission lines and give an unambiguous answer.
In summary, out of our redshift sample of 16, 8 objects were also observed by Vanzella et al. (2005) and/or Doherty et al. (2005), who obtained very similar spectra similar spectra (although in two cases with a redshift discrepancy that might be larger than expected from statistical error). Seven of our redshifts appear to be new. Finally, for the AGN, more data is needed.
4.3 Model-fitting
We fit our ERG spectra, at where the signal-to-noise is greatest, with a series of 40 template spectra from Jimenez et al. (2004). These represent passively evolving stellar populations, with a Salpeter IMF and solar metallicity, at ages from 0.001 to 14 Gyr. We experimented with models of lower and higher metallicity but found no indication that these fitted any better. Furthermore the colours (Caputi et al. 2004) of our ERGs and the ultraviolet spectroscopy of de Mello et al. (2004) support the assumption that ERGs have approximately solar metallicity, even to .
From the scatter between the 17 ‘blank’ (i.e. no signal) slit spectra, we derived a function representing the noise per pixel produced by the sky background within the area of a single spectroscopic slit (Fig 2b). This is much worse at the red end due to strong sky emission lines and the declining detector response.
We fit models to a combination of the GMOS spectra and the 9-band (, ) photometry, using a least-squares (minimum ) method, with each pixel of the spectrum weighted using this noise function. The GMOS spectrum and the 9-band photometry make similar contributions to to the combined , which is minimized in the fitting.
An initial series of fits as a function of redshift provided the continuum-fit redshift for each ERG. We then fixed the redshift at this value and fit with a two-component model, this being the sum of a single-age passively evolving model, of age , and a ‘starburst’ component of much younger stars, represented by the Jimenez et al. (2004) model, integrated with a constant SFR for a time interval prior to the time of observation. It is important to note that this component is not a single-age population, but contains stars of all ages from zero to . The young component is subject to dust-reddening, following the extinction curve of Calzetti et al. (2000), parameterized in terms of . The normalization of the young component is parameterized as the fraction of the emitted flux it contributes in the rest-frame -band, . Hence it is described by three parameters, , and .
For each ERG, we searched for the best-fitting model, by calculating a for the GMOS spectrum, plus the 9-band photometry compared with a set of model spectra, forming a grid of 18000 points in the 4-dimensional (, , , ) parameter space. was allowed to vary from 10 to 800 Myr and from 0 to 0.5 mag ( mag). The best-fit model was taken as the position within this grid where has the minimum value .
Error intervals were estimated for the fitted parameters, as follows. Using our grid of models and their associated , we find the surface in parameter space, enclosing the best-fit model, on which takes the value , where is the number of degrees of freedom, approximately 900 here. This surface defines an approximately confidence interval. The error on a given parameter, e.g. , is then taken as the projection of this entire surface onto the axis ( just its intercept with the axis). This projected interval will then take into account any degeneracies between the fitted parameters, which would produce an elongated surface and hence widen the projected error interval.
The Jimenez et al. (2004) models are normalized in units of solar masses and so the normalizations of the model fits can provide estimates of the stellar mass in each galaxy, for both the passive () and the young () stellar components. However, the model fits to the 9-band aperture photometry always gave higher normalizations than fits to the spectra (by factors 1.1–2.5), the reason being that a 2.0 arcsec diameter aperture admits a greater fraction of the light from an extended galaxy than the 1.0 arcsec spectrograph slit. We therefore give stellar mass estimates with the higher normalization given by fitting models to the aperture photometry.
4.4 Spectra and Ages of the Redshift Sample
Figure 3 shows plots of our 16 GMOS spectra, the 9-band photometry and best-fit models. Spectra and models are normalized to fit the aperture (rather than slit) photometry.
Table 1 lists co-ordinates of the 16 galaxies and Table 2 the best-fit parameters , , and , with approximately 90 per cent confidence interval error bars. Also given are a flux-weighted mean star-formation redshift, , which corresponds to the look-back time earlier than the redshift of observation, the masses of the passive and starburst components in the best-fit model, plus the fraction of the total stellar mass in the starburst/young component. Table 3 gives the 9-band aperture photometry, absolute magnitude (AB system) in the rest-frame -band, derived from the best-fit model normalized to the 2.0 arcsec aperture magnitudes, and an absolute magnitude with an approximate correction to total magnitude given by adding the (small) difference between aperture and total magnitudes.
We find a wide variation in within the sample, from 0.6 Gyr to 4.5 Gyr, with a mean of Gyr, and in the mass , from to almost , with a mean . Note that we have performed two independent reductions of the GMOS data, and the other reduction was independently fit with both Jimenez et al. (2004) and Bruzual and Charlot (2003) models. These analyses gave age estimates closely similar to, and consistent with, those presented here.
Only for one ERG was the best-fit obtained for a purely passive model, . For the 15 where is smaller with , the best-fit star-forming component made up anything from 0.26 to 13.5 per cent of the total stellar mass (mean per cent) The best-fit ages and dust-reddenings for the star-forming components vary widely between individual ERGs, and cover the full range allowed in this model, 10–800 Myr (mean Myr) and 0-0.5 mag (mean ).
For 6 ERGs, the best-fit star-forming component is a short-term, Myr starburst, always with some dust reddening varying from to 0.5. For 9 others, the best-fit is with a longer period (100–800 Myr) of continuous star-formation, in 3 cases with little/no dust but in the other 6 with heavy extinction of . In Section 7.3 we discuss how age and recent SF history is related to morphology.
4.5 Spectral Lines
Ten of the 16 ERG spectra show a single emission line, which in all cases is assumed to be [OII]. In most cases this identification is supported by the position of other spectral features. [OII] emission is an indicator of ongoing or very recent (within yr) star-formation, and according to Kennicutt (1998), a luminosity ergs in this line corresponds to a SFR .
For 3 ERGs we find no emission at , indicating that star-formation has ceased, is at a very low level, and/or is heavily obscured. One of these (2401) has a spectrum fit by a purely passive model, but the photometry of the other two (1701 and 1955) is best-fit with the inclusion of a heavily reddened young component, suggesting these are dusty post-starbursts. Three ERGs lie at where [OII] would not be visible in our wavelength range, but two of these have [OII] visible at the red extreme of the FORS2 spectra (which have a slightly redder limit), and all three have strong fluxes at the blue end.
Absorption features are prominent in almost all ERG spectra, the MgII close doublet at and/or (3934, ), and the break is generally a prominent feature.indicating the presence of old stellar populations. Three emission-line ERGs (1412, 1823, 1876) show H8 and H9 Balmer absorption lines indicating a large intermediate-age (– yr) component.
The [OII] line fluxes were measured from the GMOS spectra (using IRAF ‘splot’), and multiplied by the ratio of the continuum flux in the 2.0 arcsec aperture to that in the GMOS slit, so as obtain a line flux more representative of the entire galaxy. The [OII] line fluxes are listed in Table 4, with errors calculated by summing the sky noise function (Figure 2b) over the resolution element () centred on the observed line wavelength. From this flux and the spectroscopic redshift we derive the [OII] luminosity of the galaxy, which is uncorrected for dust, and from this a star-formation rate , using the relation of Kennicutt (1988).
These SFRs, which again are uncorrected for dust extinction, average . There are two ways in which we can estimate a very approximate dust-corrected SFR. Firstly, if the emission lines are assumed to be subject to the same dust extinction as the continuum, then from the Calzetti (2000) reddening curve the [OII] extinction . If we apply this correction to the SFRs in Table 4, using the value of best-fit to the spectrum of each galaxy, the mean SFR of the 10 emission-line galaxies increases to
Secondly, if we assume that the SFR and dust extinction in the star-forming component is truly constant, we can estimate . This will correct for dust, as this is taken into account in calculating , but for an individual ERG this is very approximate due to the large error bars on . For the full sample of ERGs (but excluding the AGN), the mean is .
| ID no. | R.A. | Dec. | |
|---|---|---|---|
| (deg.) | (deg.) | ||
| 1152 | 53.165199 | -27.785870 | 19.14 |
| 1029 | 53.149200 | -27.792976 | 20.21 |
| 1412 | 53.149109 | -27.774279 | 19.23 |
| 1777 | 53.144367 | -27.735580 | 18.87 |
| 2536 | 53.132652 | -27.732313 | 19.60 |
| 1064 | 53.125080 | -27.790777 | 18.98 |
| 1143 | 53.106606 | -27.787319 | 20.23 |
| 1565 | 53.116936 | -27.768448 | 19.77 |
| 2401 | 53.109440 | -27.764095 | 18.93 |
| 1876 | 53.126465 | -27.756538 | 18.24 |
| 2246 | 53.124275 | -27.752996 | 19.68 |
| 1823 | 53.107304 | -27.741930 | 18.61 |
| 1762 | 53.112560 | -27.735302 | 18.66 |
| 1955 | 53.123837 | -27.736311 | 18.91 |
| 1843 | 53.083546 | -27.746445 | 20.00 |
| 1158 | 53.075893 | -27.785822 | 19.78 |
![[Uncaptioned image]](/html/astro-ph/0604383/assets/x3.png)
![[Uncaptioned image]](/html/astro-ph/0604383/assets/x4.png)
![[Uncaptioned image]](/html/astro-ph/0604383/assets/x5.png)
![[Uncaptioned image]](/html/astro-ph/0604383/assets/x6.png)
![[Uncaptioned image]](/html/astro-ph/0604383/assets/x7.png)
![[Uncaptioned image]](/html/astro-ph/0604383/assets/x8.png)
![[Uncaptioned image]](/html/astro-ph/0604383/assets/x9.png)
![[Uncaptioned image]](/html/astro-ph/0604383/assets/x10.png)
![[Uncaptioned image]](/html/astro-ph/0604383/assets/x11.png)
![[Uncaptioned image]](/html/astro-ph/0604383/assets/x12.png)
![[Uncaptioned image]](/html/astro-ph/0604383/assets/x13.png)
![[Uncaptioned image]](/html/astro-ph/0604383/assets/x14.png)
![[Uncaptioned image]](/html/astro-ph/0604383/assets/x15.png)
![[Uncaptioned image]](/html/astro-ph/0604383/assets/x16.png)
![[Uncaptioned image]](/html/astro-ph/0604383/assets/x17.png)

| ID no. | (Gyr) | (Myr) | |||||||
| 1152 | 1.310 | 0.0046 | |||||||
| 1029 | 1.221 | 0.0199 | |||||||
| 1412 | 1.092 | 0.1168 | |||||||
| 1777 | 1.223 | 0.1355 | |||||||
| 2536 | 1.512 | 0.0131 | |||||||
| 1064 | 1.548 | 0.0089 | |||||||
| 1143 | 1.254 | 0.0026 | |||||||
| 1565 | 1.108 | 0.0087 | |||||||
| 2401 | 1.200 | - | - | 0 | 0 | ||||
| 1876 | 1.196 | 0.0256 | |||||||
| 2246 | 1.195 | 0.0032 | |||||||
| 1823 | 0.868 | 0.1100 | |||||||
| 1955 | 1.180 | 0.0695 | |||||||
| 1762 | 1.102 | 0.0094 | |||||||
| 1843 | 2.017 | 0.0193 | |||||||
| 1158 | 1.379 | 0.0183 |
∗ Host galaxy of obscured AGN – age/mass estimates may be affected by non-stellar component.
| ID no. | |||||||||||
|---|---|---|---|---|---|---|---|---|---|---|---|
| 1152 | 26.06 | 25.13 | 23.83 | 22.88 | 21.83 | 21.43 | 21.16 | 20.21 | 19.93 | -21.51 | -21.69 |
| 1029 | 25.85 | 25.56 | 24.58 | 23.62 | 22.79 | 22.32 | 22.11 | 21.27 | 21.00 | -20.43 | -20.49 |
| 1412 | 26.03 | 24.94 | 23.70 | 22.84 | 22.06 | 21.65 | 21.21 | 20.29 | 20.02 | -20.77 | -20.91 |
| 1777 | 25.13 | 24.07 | 23.11 | 22.06 | 21.75 | 20.90 | 20.04 | 19.79 | -20.95 | -21.14 | |
| 2536 | 25.71 | 25.04 | 24.07 | 23.47 | 22.48 | 22.10 | 21.51 | 20.79 | 20.52 | -21.70 | -21.77 |
| 1064 | 25.14 | 24.76 | 23.92 | 23.12 | 21.78 | 21.57 | 20.94 | 20.08 | 19.81 | -22.06 | -22.18 |
| 1143 | 27.28 | 25.47 | 25.40 | 24.78 | 23.33 | 22.76 | 22.15 | 21.37 | 21.10 | -19.73 | -19.81 |
| 1565 | 27.08 | 25.92 | 24.50 | 23.73 | 23.11 | 22.56 | 21.69 | 20.88 | 20.61 | -19.79 | -19.87 |
| 2401 | 27.42 | 25.71 | 24.18 | 22.97 | 21.97 | 21.23 | 20.95 | 20.43 | 20.16 | -21.03 | -21.21 |
| 1876 | 25.64 | 24.25 | 23.20 | 22.23 | 21.29 | 21.13 | 20.39 | 19.60 | 19.31 | -21.75 | -22.06 |
| 2246 | 26.81 | 25.81 | 24.39 | 23.41 | 22.38 | 22.22 | 21.54 | 20.90 | 20.63 | -20.53 | -20.55 |
| 1823 | 27.07 | 24.74 | 23.21 | 22.58 | 21.78 | 20.99 | 20.53 | 20.15 | 19.88 | -20.86 | -20.94 |
| 1955 | 27.35 | 25.69 | 24.01 | 22.81 | 21.70 | 21.52 | 20.89 | 20.06 | 19.78 | -20.99 | -21.13 |
| 1762 | 25.21 | 24.23 | 23.29 | 22.43 | 21.87 | 21.34 | 20.74 | 20.12 | 19.86 | -21.06 | -21.06 |
| 1843 | 25.62 | 25.16 | 24.55 | 24.15 | 23.05 | 22.36 | 22.02 | 21.27 | 21.00 | -21.96 | -22.14 |
| 1158 | 26.99 | 25.09 | 24.16 | 23.46 | 22.54 | 21.85 | 20.65 | 20.38 | -20.35 | -20.58 |
(n.d) not detected (too faint) in this passband.
| ID no. | ||||
|---|---|---|---|---|
| ergs | ||||
| restframe | ergs | |||
| 1152 | 5 | |||
| 1029 | 46 | |||
| 1412 | 9 | |||
| 1777 | ||||
| 2536 | ? | ? | ? | ? |
| 1064 | ? | ? | ? | ? |
| 1143 | 21 | |||
| 1565 | 31 | |||
| 2401 | ||||
| 1876 | 5 | |||
| 2246 | 12 | |||
| 1823 | 10 | |||
| 1955 | ||||
| 1762 | 8 | |||
| 1843 | ? | ? | ? | ? |
| 1158 | 40 |
?: Galaxy is at where would not be visible in GMOS range.
5 Morphology and Size of ERGs in the Redshift Sample
The HST-ACS images, in the stacked form used here (version V1.0 from the STScI), have a pixelsize 0.03 arcsec and resolution arcsec kpc at ). Figure 5 shows all 16 galaxies as they appear on the -band ACS image, and Figure 6 the -band images (), which have poorer signal-to-noise but provide extra information by highlighting regions of star-formation (SF).
The appearance of each ERG is described briefly below (by ‘high-SB’ we mean an -band central surface brightness of about 0.033 counts AB mag , a value typical of the spheroidal ERGs).
1152 ([OII] emitter) is a high-SB spheroidal surrounded by a much fainter ring (post-merger?). Only the central nucleus is visible in the image.
1029 ([OII] emitter) appears in to be a normal spheroidal, with a bulge profile. However, the image shows spots within the galaxy which could be SF regions.
1412 ([OII] emitter) is a large ( arcsec diameter) disk with spiral arms and a small central nucleus. In the nucleus cannot be seen but two brighter regions in the outer arms are just visible.
1777 (no [OII]) is a barred spiral of large diameter ( arcsec) and relatively low SB. A nucleus and two spiral arms are clearly visible in . It does not appear disturbed. In the image the nucleus and arms cannot be seen and all that is visible is a tiny bright spot within the N spiral arm.
2536 (; UV-bright) is a merging pair of separation arcsec. The NW component is smaller but higher in SB, the SE is irregular with bright regions on the W and SE sides. In the band both galaxies are visible, but only the W and SE parts of the irregular component and the centre of the NW galaxy are prominent. Both galaxies appear to contain bright SF regions within redder disks/spheroids. This ERG has the youngest of our sample combined with a young ongoing starburst.
1064 (; UV-bright) appears in the band to be a high-SB elliptical. However, in the -band the nucleus disappears and is replaced by bright regions on either side of it, forming a bar. This bar is very asymmetric and there is no sign of spiral arms, implying that this galaxy is not a barred spiral but a merger.
1143 ([OII] emitter) is a very small speroidal, without visible features (in both and ) but appears to be a dusty starburst.
1565 ([OII] emitter) is a complex system, with four separate intensity peaks. The southernmost galaxy has the highest SB in and could be a spheroid. Only one of the 4 components, an amorphous galaxy at the NW, is visible in . This could be a multiple merger of a star-forming and 3 passive galaxies.
2401 (no [OII]) is a small, roundish, high-SB spheroid. It is not visible in the -band. The spectrum gives no evidence of ongoing or recent SF.
1876 ([OII] emitter) appears to be a large, face-on spiral with a high-SB nucleus, and two arms reaching to a radius arcsec. The galaxy is ringed by bright regions, presumably star-forming hotspots on the basis of their visibility in the image, with gaps in the ring at the N and S. This galaxy has a strong colour gradient; the nucleus ( arcsec) has a ‘passive’ colour of , but the ring ( arcsec) has , a colour similar to the bluest galaxies in this sample (1029, 1064 and the AGN 1843) and indicating an observer-frame visible flux dominated by young stars. This very interesting object is a red spiral with ongoing SF, apparently of long duration, concentrated in the outermost rim.
2246 ([OII] emitter) is a small, roundish, high-SB spheroid. In the band it looks even more smaller, and asymmetric, suggesting a central SF region. The SF appears to be prolonged and this is probably a post-merger.
1823 ([OII] emitter) is a merger of nuclear separation arcsec, apparently of a spheroid (N) and a more irregular galaxy (S) with a lower -band SB and three intensity peaks. In the N spheroid is barely visible (passive?) but the S irregular is bright (starburst?).
1955 (no [OII]) is a high-SB spheroid with slight asymmetry in the outer regions, possibly due to perturbation by a smaller neighbouring galaxy separated by 0.8 arcsec separation. morphology is similar but faint.
1762 ([OII] emitter) resembles several of the disk mergers in the Arp catalog. The image shows two nuclei separated by 0.34 arcsec, of which the larger (N) is at the centre of a partial ring or curved tail of radius arcsec, and the smaller (S) has a long ( arcsec) straight tail. In the band the system appears much more fragmented, the large nucleus is less prominent but the S nucleus is bright and parts of the tails are visible, together with a bright region in the SW. This is a merger with extensive SF, and some of the bright clumps in the tails might be new dwarf galaxies being formed in the interaction.
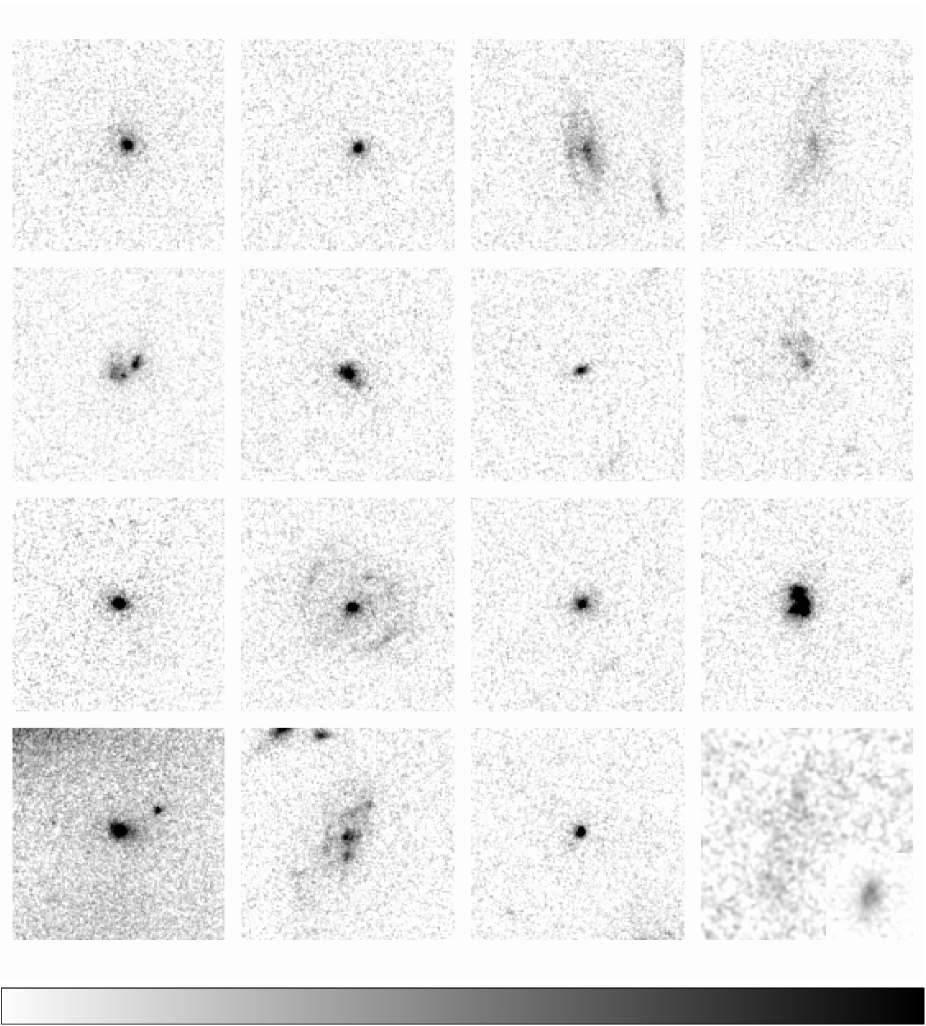
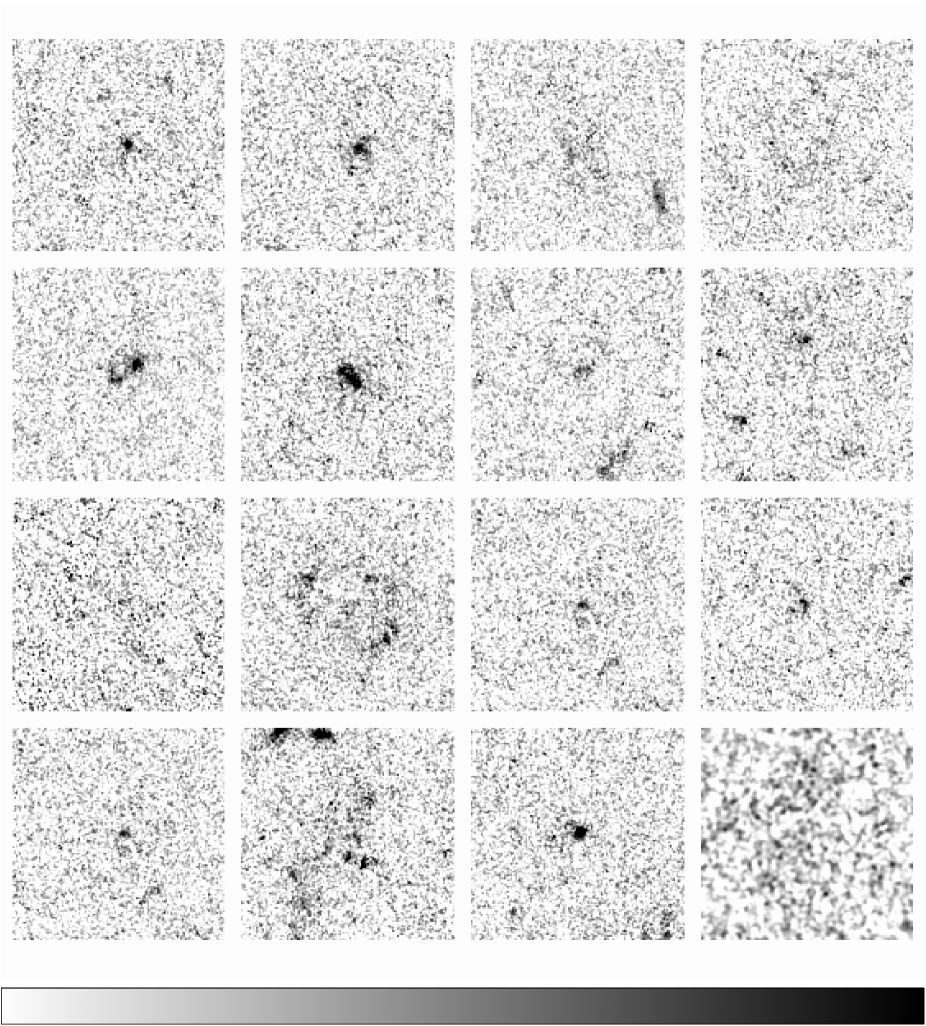
1843 (, Chandra source, AGN) has a central SB twice that of the other spheroidals in this sample. It appears to be a bright point-source within a faint extended host galaxy visible in both and .
1158 ([OII] emitter) is of very low SB in the -band. It is more prominent on the -band image. It appears to be an almost edge-on disk or ring some 1.6 arcsec in long-axis diameter, without a bright nucleus and without much asymmetry. In it is even fainter and almost invisible, even with smoothing, but probably of similar size and shape. It is most likely a red spiral galaxy with the ‘ring’ appearence suggesting that most SF is in the outer regions rather than the nucleus (as in 1876?).
| ID no. | Sersic Index | (arcsec) | (kpc) |
|---|---|---|---|
| 1152 | 4.8 | 0.969 | 8.43 |
| 1029 | 5.1 | 0.330 | 2.84 |
| 1412 | 1.2 | 0.402 | 3.39 |
| 1777 | 1.0 | 0.543 | 4.68 |
| 2536 | 1.4 | 0.321 | 2.83 |
| 1064 | 3.5 | 0.360 | 3.18 |
| 1143 | 2.4 | 0.054 | 0.47 |
| 1565 | 1.4 | 0.384 | 3.25 |
| 2401 | 5.8 | 0.411 | 3.53 |
| 1876 | (85%) 1.0 | 0.969 | 8.32 |
| (15%) 4.0 | 0.060 | 0.52 | |
| 2246 | 4.2 | 0.261 | 2.24 |
| 1823 | 1.2 | 0.258 | 2.05 |
| 1955 | 4.4 | 0.807 | 6.92 |
| 1762 | 1.4 | 0.582 | 4.92 |
| 1843 | (60%) 4.0 | 0.675 | 5.91 |
| (40%) 0.0 | - | - | |
| 1158 | 1.0 | 0.864 | 7.56 |
Sizes (half-light radii, ) were estimated for the ERGs by fitting the profile of each in the HST-ACS -band (approximately the rest-frame -band) with the Sersic profile , using a method in which this was convolved with the detailed form of the HST-ACS point-spread function (see Floyd et al. 2004). In this equation is the Sersic index, for an exponential (pure disk) profile and for a de Vaucouleurs bulge profile. The half-light radius is a function of and . Table 4 gives PSF-corrected and for the 16 ERGs; note that two galaxies were not well-represented by a single Sersic profile and have been fitted with two component models.
Morphologically, these ERGs can be placed into three broad classes: (i) spheroidals of high Sersic index (1152, 1029 1143, 2401, 2246, 1955, 1843), (ii) red disk or spiral galaxies, of low Sersic index (exponential profiles) and without much sign of disturbance (1412, 1777, 1876, 1158), and (iii) merging or highly disturbed galaxies (2536, 1064, 1565, 1823, 1762) typically with intermediate Sersic indices .
Figure 6 shows the Sersic model for the 16 ERGs plotted against the estimated total absolute magnitude (the from Table 3). Also plotted for comparison are, firstly, a mean relation for local galaxies, as derived from the Driver et al. (2005) relation of -band effective surface brightness to absolute magnitude for the Millenium Galaxy Catalog, converted to and AB magnitudes (). This sample is composed predominantly of spirals. Secondly, to represent local spheroidals we plot the best-fit size-luminosity relation of early-type (Sersic ) galaxies in the Sloan Digital Sky Survey (Shen et al. 2003), with an approximate conversion (Driver et al. 2005).
Amongst spheroidal and disk ERGs, there is considerable scatter in the size-luminosity relation, but generally little, or moderate ( mag) enhancement in SB relative to local galaxies of the same type. This would be consistent with the passive evolution of ellipticals which formed Gyr earlier, or with the exponetially declining SFRs of early-type spirals. One ERG, the disk 1158, has a significantly lower SB than a typical local galaxy and on the basis of its spectrum (Figure 3) this is likely due to heavy internal dust extinction, as well as a diffuse morphology. Merging ERGs, in contrast, show in their size-luminosity relation a marked (1–2 mag) SB brightening relative to local galaxies, especially in the case of the mergers 2536 and 1064, presumably due to intense, short-term starbursts.

6 ERG Clustering vs. Photometric Redshift
We rexamine the clustering of ERGs in the CDFS sample using the photometric redshift estimates of Caputi et al. (2004, 2005), which will allow us to obtain a more reliable and less model-dependent estimate of their clustering properties than given in RDA03.
The angular correlation function, , is a measure of the clustering of galaxies as projected on the plane of the sky. It is related to the intrinsic clustering in three dimensions, parameterised by the correlation radius , by means of an integration known as Limber’s formula (see e.g. Efstathiou et al. 1991, RDA03)
If the two-point correlation function, expressed in proper co-ordinates, is represented by the simple model
where (observationally) and represents the clustering evolution ( is stable and is comoving clustering), then Limber’s formula gives , where
where is the proper distance and for .
Hence in order to estimate from the observable ,a model or observed is required, and for deep samples, the will also depend on . However, we can also express the clustering measured at any redshift in terms of a comoving correlation radius , without any assumptions about , as in comoving space
In this system comoving clustering would be a constant and stable clustering would be .
Previously (RDA03) we calculated the angular correlation function, of the CDFS ERGs.We obtained a detection of clustering at the completeness limit of , which appeared consistent with the ERG measurements of Daddi et al. (2000), Firth et al. (2002) and Roche et al. (2002). By combining all these we estimated Mpc for ERGs. However, this estimate is dependent on a model , taken from a ‘merging and negative density evolution’ model, fitted to the ERG number counts without any redshift data. Furthermore the clustering evolution remains undetermined.
We can now obtain a less model-dependent estimate of , and investigate , by including redshift data. We assign to each ERG a redshift estimate, which for the 16 galaxies in our redshift sample is the GMOS spectroscopic redshift and for the remainder, the photometric redshift estimate from Caputi et al. (2004, 2005). Objects with are assigned redshifts following Section 4.6 of Caputi et al. (2004), in which only two ERGs with (one with ) are accepted as probable galaxies, and four of our original sample are reclassified as stars.
Figure 7 shows the distribution of true/estimated redshifts for the 175 ERGs brighter than the approximate completeness limit . The photometric is quite close to the RDA03 model, especially at the peak, although more dispersed to lower and higher redshifts, presumably as real galaxies are more varied in their evolution.

The angular correlation functions were calculated for the CDFS ERGs using the same methods as in RDA03. Each was fitted with the function ‘’ (see RDA03), to obtain a power-law amplitude, . The errors on the were estimated using the same ‘bootstrap’ method as RDA03 (essentially repeating the analysis for a series of data catalogs with small regions excluded and finding the scatter in the resulting estimates).
We first consider the full sample of 175 ERGs. From its amplitude measurement (Table 6) and photometric/spectroscopic (Figure 7), Limber’s formula gives the comoving correlation radius Mpc. This is consistent with the RDA03 estimate based on a model . Alternatively if we set this result can be fit with a stable clustering model with Mpc (at ).
We then recalculate for the ERGs divided into two subsamples in phot/spec redshift. For both the low and high redshift subsamples, the and are used to derive a comoving (Table 6). Dividing the sample reduces the significance of clustering detection, but in most cases it remained . We repeat this analysis for redshift divides at , 1.6 and 1.8.
The subset amplitudes are given in Table 6 and plotted on Figure 8. It can immediately be seen that the mean of the we derive for the low and high-redshift subsamples is a little lower than that of the full -limited sample, by about 19 per cent, which corresponds to 32 per cent in the . The reason for this is that photometric redshifts are not always accurate and thus the low and high redshift subsamples will both experience some contamination from galaxies in the other redshift range, which are not correlated with the correctly selected galaxies and dilute the observable clustering. If, for example, the true of the lower redshift ERGs is and of the high , and we examine a low subsample with a contamination , the we calculate will be . The observed shortfall could be accounted for by . We have not attempted to correct for this is deriving a , and thus the low and high redshift will both be slight underestimates, (by similar amounts, as here the two subsamples have similar size and clustering).
Secondly, it can be seem that the higher redshift subsamples have a comoving similar to or even a little greater than the lower redshift ERGs. This is clearly more consistent with comoving clustering rather than stable clustering. The slight increase in with redshift, if real could reflect a stronger clustering for more massive/luminous ERGs.
| No. of | amp. | |||
|---|---|---|---|---|
| range | ERGs | Mpc | ||
| All | 1.742 | 175 | ||
| 1.125 | 72 | |||
| 2.187 | 103 | |||
| 1.231 | 101 | |||
| 2.458 | 74 | |||
| 1.273 | 111 | |||
| 2.577 | 64 |

Comoving clustering of – Mpc is consistent with the clustering of both shallower (Daddi et al. 2000) and deeper ERG samples, e.g. Daddi et al (2004) estimate – Mpc at . Extrapolated to lower redshifts, this model would overpredict the clustering of local passive galaxies of all luminosities, Mpc (Madgwick et al. 2003), but be consistent with the clustering of the most luminous () early-types at , Mpc comoving (Brown et al. 2003). This can be explained if (i) many of the ERGs undergo further merging to become very massive ellipticals, (ii) only some ( half) of the moderate-luminosity E/S0s found locally have evolved directly from ERGs and the others are formed at from mergers of less strongly clustered spirals, thus diluting the clustering.
To better understand the evolution of ERGs it will be useful to compare their clustering with that of their their likely progenitors at higher redshifts, such as sub-mm galaxies, for which the clustering will be measured in the ongoing SHADES survey. There is already evidence that the most massive Lyman break galaxies at have a similar comoving ( Mpc) to the –2 ERGs (Allen et al. 2005).
7 Discussion
7.1 Ages of ERGs
We perform spectroscopic age-dating of the ERGs by fitting their SEDs with passively evolving models (from Jimenez et al. 2004), and obtain mean stellar ages ranging widely from 0.6 to 4.5 Gyr, with a mean of Gyr. We can compare these results with similar age-dating analyses performed by other authors, though must be careful to consider the differences in how the sample are selected. Firstly Daddi et al. (2004) give ages (from FORS2 spectra) for 9 -selected () very massive star-forming galaxies at – note that not all of these are red enough to be called ERGs. Daddi et al. (2005) give ages from low-resolution ACS spectra of 7 ERGs at , of which 5 are passive ellipticals and 2 weakly star-forming. McCarthy et al. (2004) using Gemini Deep Deep Survey spectra, give ages for a varied sample of 20 red () galaxies at . Finally, Longhetti et al. (2005) using low-resolution NIR spectra (observed with NICS on the La Palma TNG), estimate mass-weighted ages for 10 of the most bright (–18.4) and massive ERGs () present at .
Figure 9 plots stellar age against spectroscopic redshift for all these samples, with loci of the redshifts corresponding to time before observation.

For the first four samples the mean stellar ages of ERGs at all are spread over the range between and shortly (a few yr) before the epoch of observation. They seem to divide into two groups with and –4.
The Longhetti et al. (2005) sample of very luminous ERGs differs from the others in that it seems to be concentrated towards higher formation redshifts – it contains 5 galaxies with . These have stellar masses 3.8–, more than twice the mass of any ERG in our sample. Hence their ages may be evidence that the very most massive spheroidals formed significantly earlier and/or formed their stars most quickly, as in the model of Granato et al. (2004).
It is also notable that the formation redshifts appear to trace the plotted loci. The ages of the oldest galaxies at each redshift, as a function of redshift, is an important tracer of the expansion of the universe and hence the cosmological model (e.g. Jimenez and Loeb 2002). We would expect for the oldest galaxies to be constant with observed redshift, and the agreement with the plotted loci would support a cosmological constant () model.
As represents a flux-weighted mean stellar age, the true age of a galaxy since formation must always be greater, to a degree dependent on the detailed form of the star-formation history. One interpretation may therefore be that most or all of the red galaxies observed as ERGs at –2 are galaxies, or mergers of galaxies, which formed at –5, and that the spread in their stellar ages up to this maximum redshift can be attributed to differences in their individual evolution, i.e. the mergers and starbursts they have experienced.
Caputi et al. (2004, 2005), using photometric redshift estimates derived from seven-band photometry of ERGs and other galaxies in this field, found the comoving number density of massive () galaxies in a full -selected sample to fall only slowly from to , where a significant fraction, 20–25 per cent, of today’s massive galaxies were already in place. However, the comoving number density of the reddest subset of these galaxies, the ERGs, evolves much more rapidly, steadily increasing with time from to , and following a trend which extrapolates to the present-day E/SO population at . At –1.5, the rising comoving number density of ERGs approached that of all -selected galaxies at the higher redshift of .
Hence, this suggests that a substantial population of massive galaxies formed at and were initially starbursting and relatively blue, but with increasing age many became red enough to be classed as ERGs. Interestingly, for the brightest () Lyman break galaxies at , Allen et al. (2005) measure strong clustering of Mpc comoving, consistent with these evolving into the ERGs at –2.
To produce the evolution in ERG number density these galaxies must have entered the ERG class over a wide redshift range , again implying much variation in their star-formation histories. The formation of so many massive galaxies at places significant constraints on models of galaxy formation (e.g. Fontana et al. 2004) and may favour models with feedback between the star-formation in formative spheroidals and the growth of supermassive black holes within them (Granato et al. 2004; Silva et al. 2005).
7.2 Ongoing Star-formation Activity in ERGs
Yan et al. (2004a) and Doherty et al. (2005), found that per cent of ERG spectra have prominent absorption features and breaks, while per cent also show some [OII] emission. We find the same for our slightly deeper sample. For only 3 ERGs do we find neither [OII] emission nor any indication of a young stellar population from a blue excess in the SED. This is consistent with the Doherty et al. (2005) estimate that 28 per cent of ERGs show no evidence of recent star-formation.
For a clear majority of ERGs, 10/13 at , we detect a emission line. This includes two galaxies where the line only just detected with an equivalent width , while at the other extreme we have 3 ERGs with [OII] equivalent widths . For the 10 emission-line galaxies, the fluxes - uncorrected for dust - correspond to a mean SFR of 1.63 , intermediate between the 2.8 mean of Yan et al. (2004a) and the 1.1 of the Doherty et al. (2005) ERGs.
Of course the true SFRs of the emission-line ERGs will be higher. On the basis of the dust extinction estimated from our model fits, we estimate the real mean SFR will be about 12–24 . This may still be an underestimate as emission line regions of current SF may suffer more extinction than the continuum produced by SF over a longer period. Spitzer mid-IR observations (Yan et al. 2004b) of ERGs similarly selected to those in our sample indicate that about half have , and for these the mean SFR . We should be able to obtain genuinely dust-independent measurements of the SFRs for the individual ERGs in the GOODS-S from the deep Spitzer survey of this field scheduled for later this year.
7.3 Morphology and Star-formation History
Examining the HST-ACS images of ERGs we find ERGs to be a mixture of spheroidals, spirals and merging systems. The classifications by eye are confirmed by Sersic model fits to the radial profiles (Table 5). We discuss the nature and SF activity of the ERGs within each of these morphological categories.
7.3.1 Spheroidals
We class 7 ERGs, almost half the sample, as spheroidals. Spectroscopically they are varied, and this may be related to whether or not they have recently undergone a merger event or the accretion of a gas-rich galaxy. One spheroidal (2401) appears to be old and purely passive, with no evidence of SF in the last 2.5 Gyr. Another (1955) shows no [OII] emission but its near-IR colours suggest it may be a dust-reddened post-starburst galaxy. One of the spheroidal ERGs hosts an obscured AGN, it may also be star-forming. One is old with a young, dusty starburst (1143). The final three (2246, 1152, 1029) are relatively young (1–2 Gyr) with the model fits suggesting prolonged, low-level, non-dusty SF; and appear to show post-merging features.
7.3.2 Mergers
Of these 16 ERGs 5 are obvious mergers, with multiple nuclei, and all of these are star-forming galaxies, on the basis of [OII] emission. The two mergers also have a high surface brightness (Figure 6). Presumably the SFRs and dust content are both increased by the interactions. Some appear to be mixed mergers of passive spheroidals with bluer irregulars (e.g. 1565 and 1823), and one (1762) has prominent tidal tails. On the basis of our model fits, four of the 5 mergers are relatively young (0.6–2.0 Gyr) and undergoing short-term (10–40 Myr) dusty starbursts. Notably, in our sample; 4 of the 5 galaxies with Myr are mergers (the other is an AGN). This would be expected from the current interaction acting to tidally trigger an intense but short-term starburst. The fifth merger, a close irregular/spheroidal pair, (1823) differs in that it is Gyr old with a long and Balmer absorption. This may be explained if it is a late-stage merger where most starbursting occurred at earlier encounters of the two galaxies, and the elliptical is already very old.
7.3.3 Spirals
Perhaps a more surprising discovery is that of a third morphological class of ERGs which are neither ellipticals nor mergers, but red spirals. We find four of these. One explanation for the red colours of these galaxies is that they are very dusty, the ERG colour criterion selecting out the spirals at the very top end of the range of internal dust extinctions, the other is that they long ago ceased forming stars. According to our model, the four spirals differ widely in age (1.0–3.5 Gyr) but in all cases contain a young component with a long (200–800 Myr) and heavy dust extinction (). Three show [OII] emission, the fourth (1777) may therefore have ceased forming stars. Strong Balmer lines are seen in two of the spirals, 1412 and 1876, and this reinforces the evidence from model fits that spiral ERGs tend to contain large intermediate-age (0.1–1.0 Gyr) populations.
It is also notable that spiral 1876 has a luminous red (passive?) nucleus ringed by blue star-forming regions, producing a strong colour gradient. Indeed, for 3 of the spiral ERGs, a comparison of the and images shows that (in contrast to the merging ERGs), their star-formation is not predominantly nuclear but in the outer disks. The ERG #4950 of Daddi et al. (2005), classed as type Sa, also has a red nucleus with a blue outer ring.
The existence and spectral properties of very red spirals can be explained if they are galaxies with continuous star-formation which has been gradually slowed or completely truncated. This explains the long , Balmer absorption, and the absence of emission lines in one spiral (already truncated?). In addition to this, they are very dusty, as the ERG colour criterion would select out the spirals at the very top end of the wide range of internal dust extinctions.
Very red spiral galaxies also occur at lower redshifts, where they make up some 0.3 per cent of all galaxies (Yamauchi and Goto 2004), and tend to be found in the outer regions of clusters (Couch et al. 2002; Goto et al. 2003). In the model of Bekki, Couch and Shioya (2002) a spiral galaxy, infalling into a cluster, experiences a truncation of star-formation activity, as its gas content is removed through ram-pressure stripping by the intra-cluster medium and/or by cluster tidal fields. Following this the galaxy would become very red in Gyr but could retain a spiral appearence, with visible arms, for Gyr, although would ultimately evolve into an S0 type. This mechanism could give rise to red spirals at ERG redshifts, as both spiral galaxies (Dawson et al. 2003) and large ERG-rich clusters (e.g. Kurk et al. 2004) are already in place at . However, some spiral ERGs e.g. 1876, must be in relatively early stages of this process as much SF is still ongoing in their outer regions.
More information on the nature of spiral ERGs and the relative importance of dust and ‘truncation’ will soon be available from Spitzer data, giving a dust-independent SFR, and spectroscopy at 1–, showing Balmer lines and . It is likely that some sort of environmental effect is involved because ERGs in general are very much more clustered than typical spirals.
7.4 Further investigations
Ongoing surveys of the CDFS with the Spitzer infra-red telescope will, when complete, provide accurate, dust-independent measurements of the SFRs in our redshift sample. The ongoing SHADES survey of bright, , sub-mm galaxies will provide a measurement of the clustering of these probable progenitors of the ERGs (Dunlop 2005; Mortier et al. 2005). We have planned further and more extensive spectroscopic surveys, including in the near-IR, of high redshift galaxy clusters and large-scale structure.
Acknowledgements
This paper is based on observations obtained at the Gemini Observatory, which is operated by the Association of Universities for Research in Astronomy on behalf of the Gemini partnership. This paper also makes use of publically available GOODS data from the Advanced Camera for Surveys on the NASA Hubble Space Telescope and from the Infrared Spectrometer and Array Camera on the Very Large Telescope operated by the European Southern Observatory. We thank the GOODS team for providing reduced data products. JSD and NDR acknowledge PPARC funding. NDR acknowledges funding from the Universidad Nacional Autonoma de Mexico.
References:
Abraham R.G., Glazebrook K., McCarthy P.J., Crampton D., Murowinski R., Jorgensen I., Roth K., Hook I. M., Savaglio S., Chen, H.-W., Marzke R. O., Carlberg R.G., 2004, AJ, 127, 2445.
Alexander D.M., Vignali C., Bauer F.E., Brandt W. N., Hornschemeier . E., Garmire G.P., Schneider D.P., 2002, AJ, 123, 1149.
Allen P.D., Moustakas L.A., Dalton G., MacDonald E., Blake C., Clewley L., Heymans C., Wegner G., 2005, MNRAS, in press.
Afonso J., Georgakakis A., Hopkins A.M., Sullivan M., Mobasher B., 2005, ApJ, submitted.
Bekki K., Couch W. and Shioya Y. 2002, ApJ, 577, 651
Brown, M.J.I., Dey A., Jannuzi B.T., Lauer T. R., Tiede G.P., Mikles V.J.,2003, ApJ, 597, 225.
Bruzual G., Charlot S., 2003, MNRAS, 344, 1000.
Calzetti D., Armus L., Bohlin R.C., Kinney A.L., Koornneef J., Storchi-Bergmann T., 2000, ApJ, 533, 682.
Caputi K.I., Dunlop J.S., McLure R.J., Roche N.D., 2004, MNRAS, 353, 30.
Caputi K.I., Dunlop J.S., McLure R.J., Roche N.D., 2005, MNRAS, in press.
Cimatti A., et al., 2002, A&A, 381, 68.
Cimatti A., et al., 2003, A&A, 412, L1.
Couch W.J., Balogh M.L., Bower R.G., Smail I., Glazebrook K., Taylor M., 2001, ApJ, 549, 820.
Daddi E., Cimatti A., Pozzetti L., Hoekstra H., Röttgering, H., Renzini A., Zamorani G., Mannucci F, 2000, A&A, 361, 535.
Daddi E., et al, 2004, ApJ., 600, L127.
Daddi E., et al., 2005, ApJ, 626, 680.
Dawson S., McCrady N., Stern D., Eckart M.E., Spinrad H., Liu M.C, Graham J.R., 2003, AJ, 125, 1236.
Doherty M., Bunker A.J., Ellis R.S., McCarthy P.J., 2005, MNRAS, 361, 525.
Driver S.P., Liske J., Cross N.J.G., De Propris R., Allen P.D., 2005, MNRAS, 360,81.
Dunlop J.S., Peacock J., Spinrad H., Dey A., Jimenez R., Stern D., Windhorst R., 1996, Nature, 381, 581.
Dunlop J.S., ‘Starbursts: From 30 Doradus to Lyman Break Galaxies’, Astrophysics & Space Science Library, Vol. 329. Dordrecht: Springer, 2005, p.121
Efstathiou G., Bernstein G., Katz N., Tyson J.A., Guhathakurta P., 1991, ApJ, 380, L47.
Firth A.E., et al., 2002, MNRAS, 332, 617.
Floyd, D.J.E., Kukula, M.J., Dunlop J.S., McLure R.J., Miller L., Percival W.J., Baum S.A., O’Dea C.P., 2004, MNRAS, 355, 196.
Fontana A., et al., 2004, A&A, 424, 23.
Giacconi R., et al., 2002, ApJS, 139, 369.
Giavalisco et al., 2004, ApJ, 600, L93.
Goto T., et al, 2003, PASJ, 55, 757.
Granato G.L, De Zotti G., Silva L., Bressan A., Danese, L., 2004, ApJ, 600, 580.
Hamuy M., Suntzeff N., Heathcote S., Walker A., Gigoux P., Phillips M., 1994, PASP, 106, 700, 566.
Jimenez R., Loeb A., 2002, ApJ, 573, 37.
Jimenez R., MacDonald J., Dunlop J.S., Padoan P., Peacock J.A., 2004, MNRAS, 349, 240.
Kennicutt R., 1998, ARA&A, 36, 189.
Kurk J.D., Pentericci L., R‘̀ottgering H.J.A., Miley G.K., 2004, A&A, 428, 793.
Longhetti M., et al., 2005, MNRAS, 361, 897.
McCarthy P.J., et al., 2004, ApJ, 614, L9.
Madgwick D.S., et al., 2003, MNRAS, 344, 847.
de Mello D., Daddi E., Renzini A., Cimatti A., di Serego Alighieri A., Pozzetti L., Zamorani G., 2004, ApJ, 608, L29-L32.
Mortier A.M.J., et al. 2005, MNRAS, 363, 509.
Roche N.D., Almaini O., Dunlop J.S., Ivison R.J., Willott C.J., 2002, MNRAS 337, 1282.
Roche N.D, Dunlop J.S., Almaini O., 2003, MNRAS, 346, 803. [RDA03]
Shen S., Mo H.J., White S.D.M., Blanton M.R., Kauffmann G., Voges W., Brinkmann J., Csabai1 I., 2003, MNRAS, 343, 978.
Silva L., De Zotti G., Granato G.L., Maiolino R., Danese L., 2005, MNRAS, 357, 1295.
Spergel D.N., et al, 2006, preprint.
Szokoly G.P., et al., 2004, ApJS,155, 271.
Vanzella E., et al., 2005.
Yamauchi C., Gotu T., 2004, MNRAS, 352, 815.
Yan L., Thompson D.J, 2003, Ap.J. 586, 765.
Yan L., Thompson D.J, Soifer B.T., 2004a, AJ, 127, 1274.
Yan L., et al., 2004b, ApJS,154, 75.
Zheng W., et al., 2004, ApJS,155, 73.