Detailed Study of the Ursa Major Supercluster of Galaxies Using the 2MASS and SDSS Catalogs
Flera Kopylova∗ and Alexander Kopylov
Special Astrophysical Observatory, Russian Academy of Sciences, Nizhnii Arkhyz, Karachai-Cherkessian Republic, 369167 Russia
Abstract
We study the infrared ( band) properties of clusters of galaxies in the Ursa Major supercluster using data from 2MASS (Two-Micron All-Sky Survey) and SDSS (Sloan Digital Sky Survey). We identified three large filaments with mean redshifts of = 0.051, 0.060, and 0.071. All clusters of the supercluster are located in these filaments. We determined the total -band luminosities and masses for 11 clusters of galaxies within comparable physical regions (within a radius close to the virial radius) using a homogeneous method. We constructed a combined luminosity function for the supercluster in this region, which can be described by the Schechter function with the following parameters: = and . The infrared luminosities of the clusters of galaxies correlate with their masses; the ratios of the systems increase with their masses (luminosities), with most of the Ursa Major clusters of galaxies (particularly the richer ones) closely following the relations derived previously for a large sample of clusters and groups of galaxies. The total mass-to-infrared-luminosity ratio is 52 for six Abell clusters and 49 for all of the clusters, except Anon2.
Key words: galaxies, groups and clusters of galaxies.
Introduction
The Ursa Major (UMa) supercluster ( ) is one of the closest , compact (in projection onto the celestial sphere) superclusters. The apparent overdensity of the system, if defined with respect of the number of Abell clusters in the surrounding region of about 150 Mpc in size, is 30. Being fairly isolated (there are no large Abell clusters nearby), the supercluster shows an example of how the systems of galaxy clusters evolve in space and time in the absence of external effects. Our studies (Kopylov and Kopylova 2001; Kopylova and Kopylov 2001) revealed that the UMa system is not a supermassive supercluster like the Corona Borealis system and the Shapley Concentration, and, in general, obeys the Hubble radial velocity-distance relation.
In this paper, we used data from two large surveys, 2MASS and SDSS. The main advantages of infrared (IR) photometric studies is their relative insensitivity to dust and to the last starburst; therefore, the stellar masses of the galaxies are traced better. Recently, using different approaches and methods for different samples of galaxy clusters and groups, Lin et al. (2003, 2004) (93 systems), Rines et al. (2004) (9 systems), Ramella et al. (2004) (55 systems), Karachentsev and Kut’kin (2005) (groups of galaxies) have found an increase in for the clusters and groups with mass (luminosity) of the system in the band. In this paper, we are going to test all these conclusions using the UMa supercluster of galaxies as an example — not a random set of galaxy clusters, but a system, though not a virialized one.
The paper is structured as follows. First, we describe the technique for determining the virial mass of a galaxy cluster using the galaxy velocity dispersion. Subsequently, we consider the features of the large-scale structure in the region of the supercluster using galaxies from the 2MASS XSC catalog and their measurements from SDSS. Next, we describe the technique for determining the total IR luminosities of clusters using 2MASS data; we present the relation between the derived virial masses and IR luminosities and the relation between the mass-to-luminosity ratio and the mass for the UMa clusters of galaxies. In conclusion, we summarize our main results. The following cosmological parameters are used in this paper: , , .
Spectroscopic data
The third data release of the SDSS catalog (DR3; Abazajian et al. 2005) allowed us to compile a sample of galaxies in the supercluster region () with 2MASS measurements. Previously (Kopylov and Kopylova 2001; Kopylova and Kopylov 2001), we measured the radial velocities only for galaxies in each cluster. We found 2480 2MASS XSC galaxies in the field of the UMa supercluster: 109 of them are foreground galaxies, 1011 galaxies belong to the supercluster (), 939 are background galaxies, 421 galaxies have no measured .
Before selecting the galaxies that belong to each of the clusters, we determined the cluster centers. In general, these are the brightest galaxies of the clusters (or one of the brightest galaxies, if there were a few of them), except two cases: we selected the centers of the clusters A1270 and A1436, respectively, between two concentrations of galaxies and between two bright galaxies. X-ray radiation was detected rather confidently from the clusters A1291, A1377, A1436, and Anon1 (Bohringer et al., 2000); the clusters A1270, A1318, and A1383 were measured less reliably (Ledlow et al., 2003). In all cases, the discrepancies between the centers we selected and those determined from the X-ray radiation do not exceed .
For each cluster, we selected galaxies from SDSS and 2MASS XSC within of the derived centers (for the supercluster’s mean distance, corresponds to 70 kpc). It turned out that, on average, the number of galaxies in SDSS is larger by one third. The data for them were taken from the 2MASS Point Source Catalog (PSC). We determined the mean radial velocity of the cluster, , and its dispersion, , iteratively: first, we used all of the galaxies with measured radial velocities, except those deviating by more than . Subsequently, having assumed that all of the clusters are in virial equilibrium and their masses crease linearly with radius, we calculated in Mpc for the derived velocity dispersion (Carlberg et al., 1997) and redetermined the cluster’s mean radial velocity, , and its dispersion, , within . is the cluster radius within which the density is a factor of 200 higher than the critical density; it is approximately equal to the virial radius. The virial mass within is .
All of the data obtained for the clusters within R200 are presented in the table. Column 1 gives the cluster names (Kopylov and Kopylova 2001); columns 2 and 3 list the equatorial coordinates for the epoch J2000.0; column 4 gives the cluster’s heliocentric redshift (SDSS); column 5 contains the velocity dispersion within , with the cosmological correction ; columns 6, 7, 8, and 9 present the number of galaxies in the cluster with IR data and measured , the radius of the region under study, mass, total luminosity within (determined below); and column 10 gives the mass-to-luminosity ratio for the cluster.
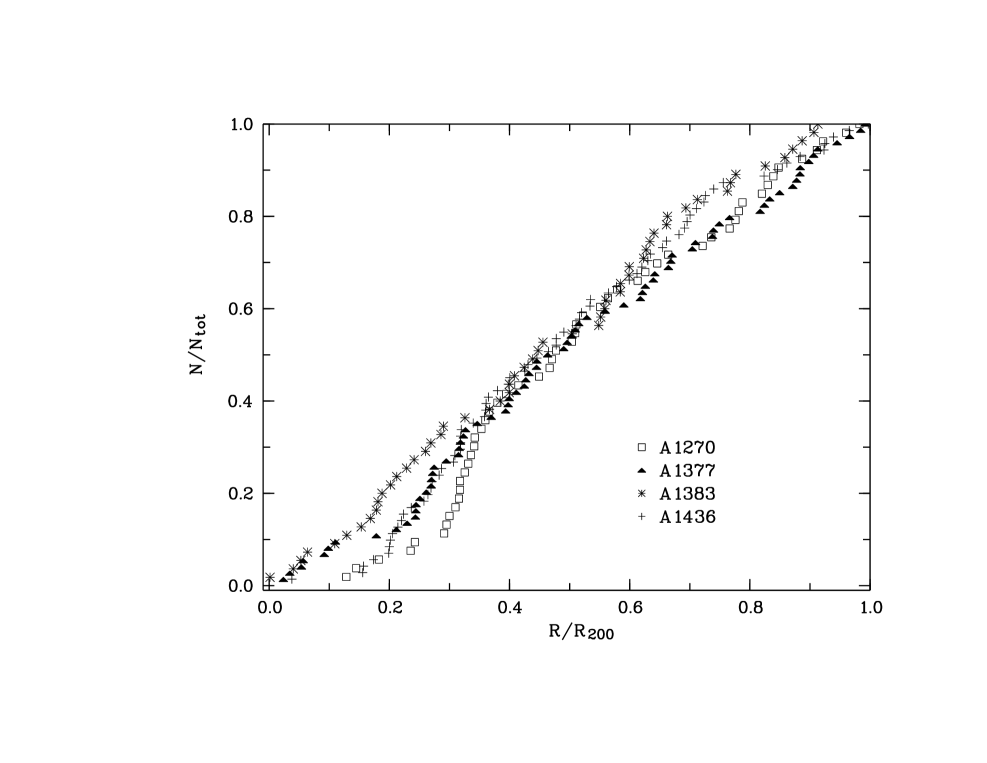
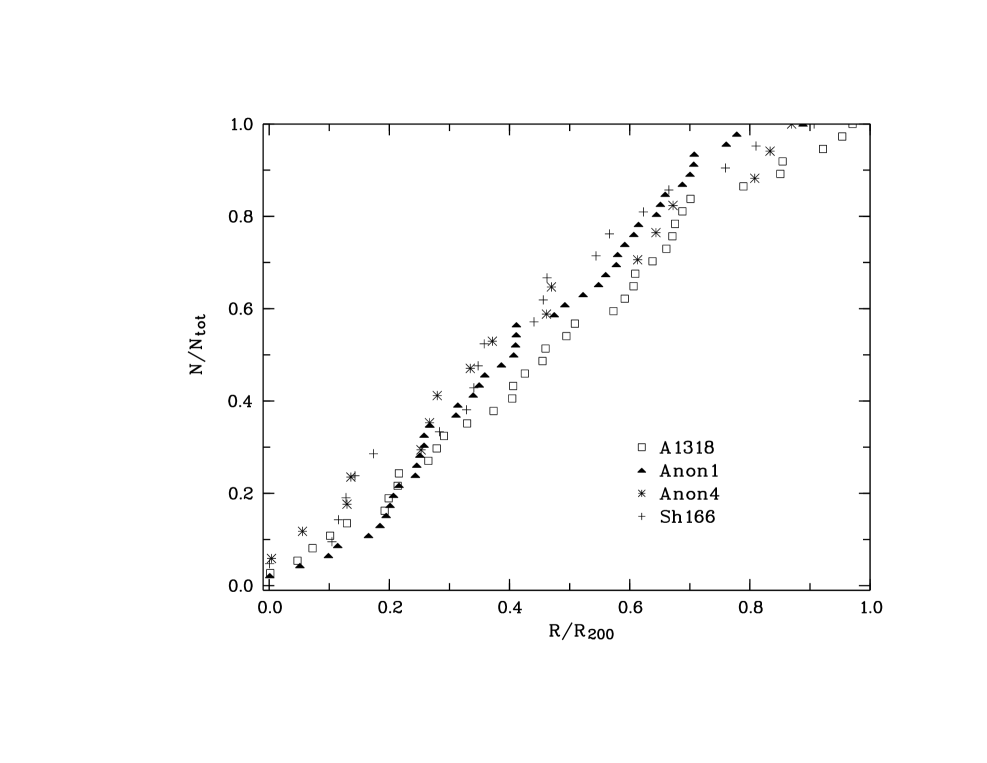
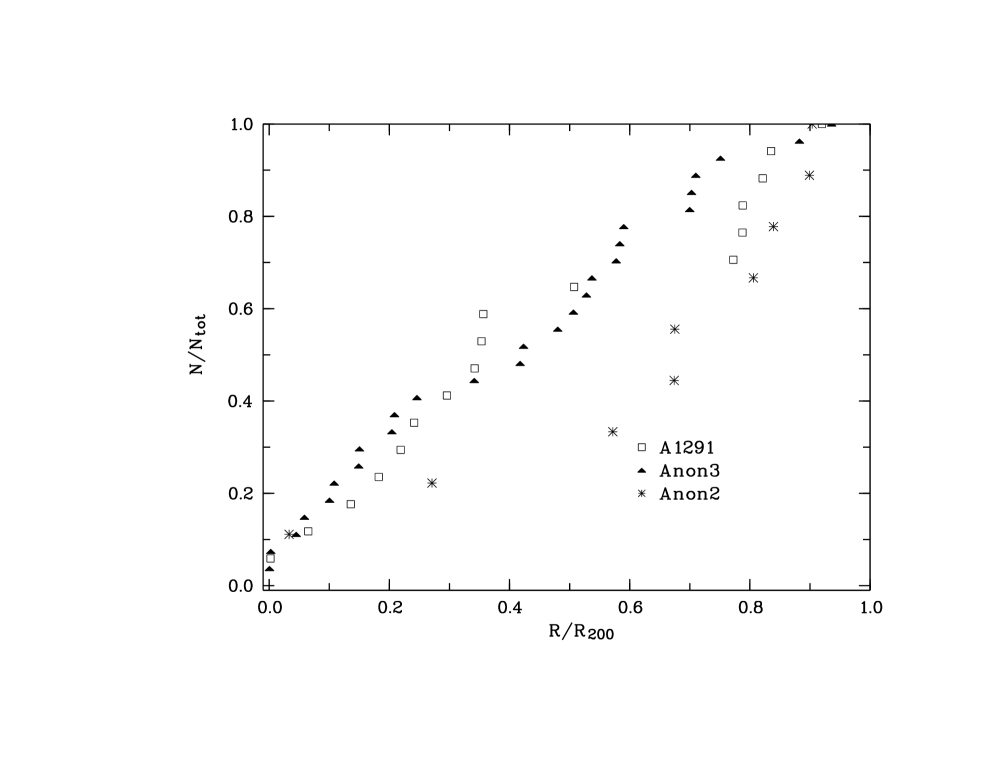
Figure 1 shows the integral distributions of galaxies in projected distance from the cluster center normalized to . The Abell clusters, the richer ones in the UMa supercluster (Figs. 1a and 1b), have similar distributions with galaxies within , especially in the range of distance from their centers. The remaining clusters (Figs. 1b and 1c) are poor, the agreement between them is poorer, and the cluster Anon2 deviates significantly from the mean distribution. The density of galaxies in this cluster is lower than that needed within for virial equilibrium to occur.
The Large-Scale Structure in the Region of the Supercluster
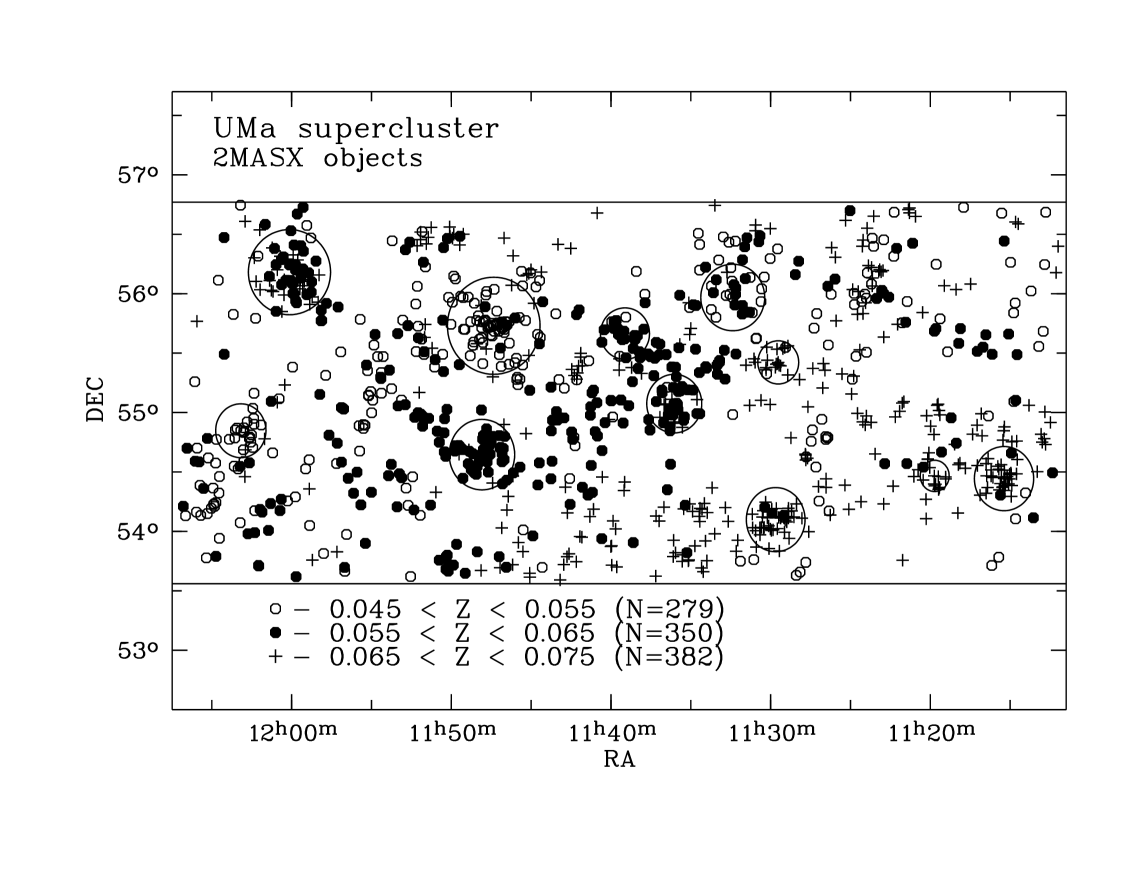
The measured radial velocities of galaxies (more than 1000 within the supercluster) make it possible to study the large-scale structure in the system. The distribution of galaxies is known to have a filamentary structure: in general, the clusters are connected by filaments, and the richest clusters are usually located at the points of intersection between the filaments. Three large filaments that contain almost all of the clusters are identified in the UMa supercluster. The galaxies belonging to each of the filaments are indicated by different symbols in Fig. 2. The large circles mark the virialized regions of the galaxy clusters ().
Data on the distribution of galaxies near clusters make it possible to reveal cases where the field galaxies projected onto the cluster can distort significantly the velocity dispersion. Since the filaments in the UMa supercluster are located roughly in the plane of the sky, do not overlap, and are fairly far apart along the line of sight, the velocity dispersions and, hence, virial masses of the clusters are determined rather reliably for all of the clusters, except A1291.
The filament in the region of the cluster A1291, classified by Abell as a cluster of richness class 1, is oriented roughly along the line of sight. Several peaks in the radial-velocity distribution from 14000 to 18500 are present here (in this region, the data completeness in in SDSS DR3 is lower than the mean). We determined A1291 as the cluster related to the strongest peak (the velocity range ) that includes the cluster’s brightest galaxy, A129174 (Kopylov and Kopylova 2001). This is an unusual, strongly deformed elliptical galaxy, a radio source with a head-tail structure (Kopylov et al. 2005). The cluster Anon2 is in the immediate vicinity () of Anon1, has a low velocity dispersion, and, contains mostly bright galaxies. Anon2 is most likely a cluster that has not yet been formed completely, but is still at an early virialization stage.
Photometric data
2MASS presents complete homogeneous all-sky photometry in three infrared bands (, , ). is a modified K band; below, we will denote it by omitting the subscript. We used the photometry presented in the final version of the extended source catalog (XSC; Jarrett et al. 2000) and in the point source catalog (PSC). From the magnitudes of galaxies measured in XSC, we took, as recommended by Jarrett et al. (2000), the isophotal magnitudes corresponding to the surface brightness (we determined the total magnitudes by subtracting from the isophotal magnitudes, as prescribed by Kochanek et al. (2001)). The mean error of the isophotal magnitudes in our sample is .
The errors in the K magnitudes of galaxies in the PSC are rather large; for example, they were estimated by Bell et al. (2003) to be . In this paper, we found the difference between the (XSC) and (PSC) magnitudes for 80 galaxies (brighter than and fainter than ); it turned out to be and , respectively. In addition, galaxies without measured were found in the field of each cluster; on average, there are of them, with 11 in A1436, 12 in A1377, 26 in A1291. Their cluster membership was determined from the () color-magnitude diagram. Their contribution to the luminosity was derived as being proportional to the fraction of the cluster members with measured in the total number of 2MASS galaxies with known within .
The K -Band Luminosity of the Supercluster
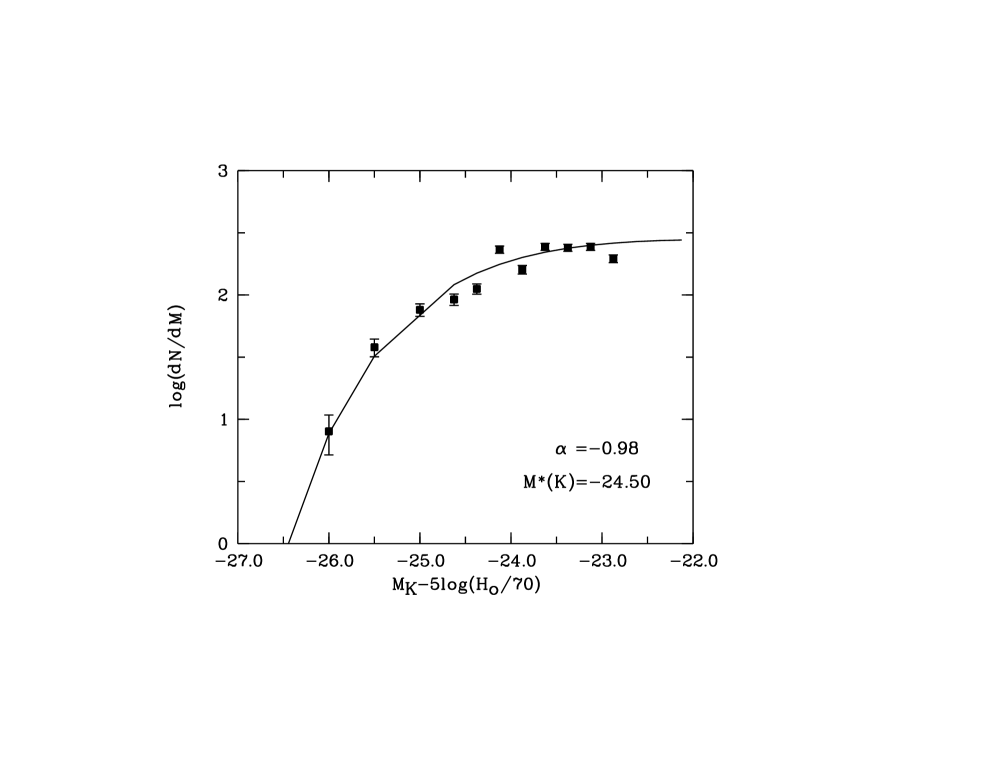
For the UMa supercluster, the photometric limit corresponding to the XSC limit () is about , where is the characteristic value of the field luminosity function (LF) equal to (Kochanek et al. 2001). To construct the LF, we converted the observed galaxy magnitudes to their absolute magnitudes using the formula:
| (1) |
where is the luminosity distance, is the extinction in the Galaxy, and (Kochanek et al. 2001) is the K-correction. The galaxies were counted in and bins. To find the parameters () at , we used the Schechter (1976) function to fit the observed LF. We normalized the LF to the total observed number of galaxies. Figure 3 is the combined LF for the UMa supercluster. The curve indicates the derived Schechter function with its parameters: , . To determine the total luminosity of the cluster galaxies within , we added the luminosities of all the individually measured galaxies by taking for the solar luminosity (Bell et al. 2003) and then used the derived parameters of the Schechter function for extrapolation to faint galaxies. We added the luminosities of the observed members up to the catalog’s limit () and integrated the luminosity function in the region of faint magnitudes according to the expression
| (2) |
where .
Bright galaxies give a major contribution to the
cluster’s luminosity. The calculated luminosities of the clusters correspond
to a cylinder of radius . The correction to the spherical volume
reduces the cluster luminosities, on average, by 20% (Ramella et al. 2004),
but this correction can be smaller, depending on the distribution of galaxies
in the vicinity of the cluster. In most cases the correction for the UMa
supercluster will be at a minimum, because the filaments are oriented in
the plane of the sky (Fig. 2).
Relations Between the IR Luminosity and Dynamical Parameters of the Supercluster
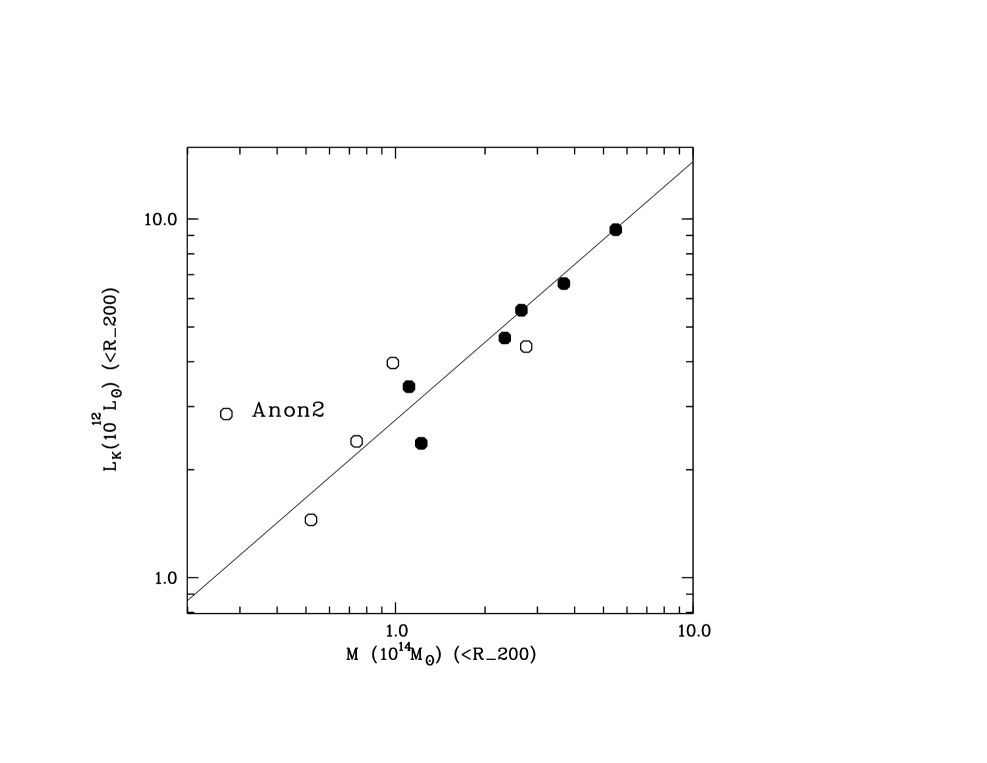
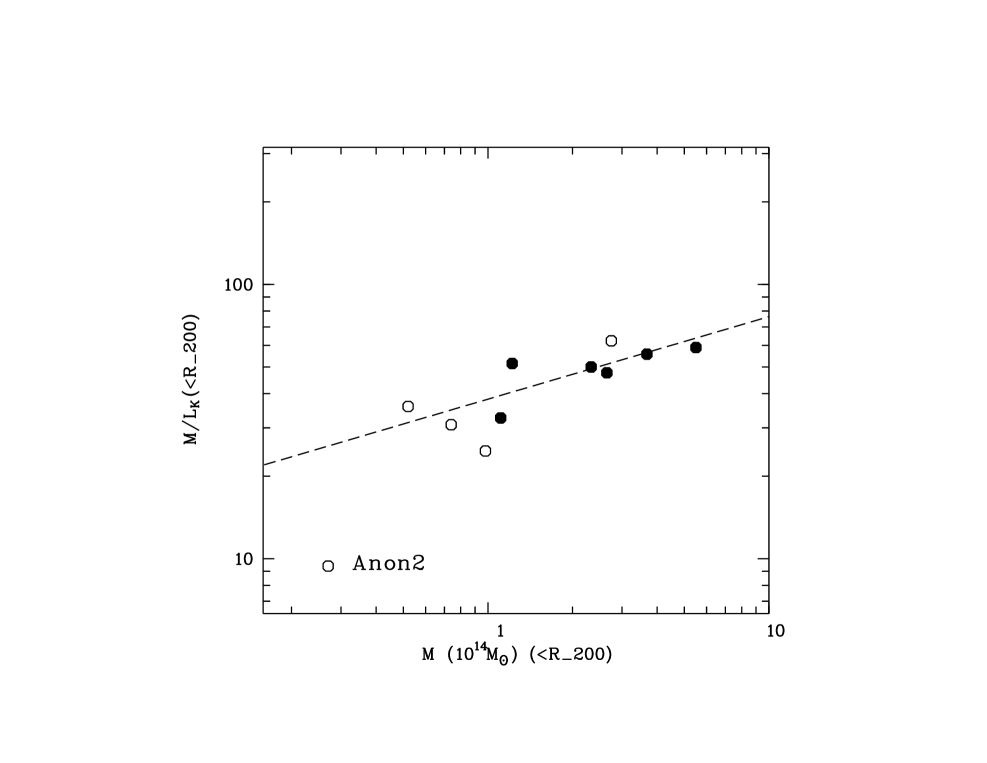
Figure 4 shows the correlation between the masses and luminosities of the UMa clusters in the infrared (the K band). The filled circles highlight the Abell clusters. The line corresponds to , derived by Lin et al. (2004) for a sample of 93 clusters and groups of galaxies with X-ray temperatures from 0.8 to keV and masses from to . We found a similar correlation between the luminosity ( ) and radial-velocity dispersion (): . This relation for virialized structures is estimates to be (Girardi et al. 2000), in agreement with our result. Figure 5 shows the dependence of the mass-toluminosity ratio on the cluster mass. The dashed line is (Lin et al. 2004). There is also a similar dependence on the luminosity. The UMa supercluster consists of 11 clusters with different properties, from very poor, in fact, groups to rather rich; it can be noticed (Figs. 4 and 5) that the rich Abell clusters (A1270, A1377, A1383, and A1436) deviate from the relation by Lin et al. (2004) only slightly, whereas some of the poorer clusters deviate significantly. If it is considered that we studied all clusters in the same way, the masses and luminosities were estimated by assuming virialization within , then the deviations of some of the clusters (open circles) in the diagram may stem from the fact that they have not yet been virialized within this radius. The ratio of the total mass to the total IR luminosity within for the Abell clusters (filled circles) is 52 (49 for all of the clusters, except Anon2). These values for the clusters forming the UMa supercluster are close to those found (a) for the Coma cluster (A1656) within : (Rines et al. 2001); (b) for 27 clusters of galaxies within : (Lin et al. 2003); (c) for 8 CAIRNS clusters within : (Rines et al. 2004). The mass-to-infrared- luminosity ratios derived from different ensembles of galaxy clusters is always smaller than the universal ratio of , as determined by Lin et al. (2004) for (WMAP) and the mean luminosity density in the Universe measured by Bell et al. (2003).
Conclusions
As the most massive gravitationally bound and virialized (in the central regions) objects in the Universe, the clusters of galaxies are the main systems for studying the distribution of total dynamical mass and luminous matter. The infrared radiation from galaxies is most suitable for these purposes. For the UMa supercluster, which consists of 11 clusters with masses from to and luminosities from to , we determined the cluster masses within close to and total luminosities using the combined luminosity function of the clusters. Our analysis of the relations between the mass and IR luminosity and between the mass-toluminosity ratio and mass (Figs. 4, 5) and comparison of them to the relations derived by Lin et al. (2003, 2004) for a large sample of galaxy clusters shows that our data for the UMa cluster confirm the results obtained by Lin et al. (2003, 2004) with a rather small scatter. Some, mostly poorer clusters of galaxies exhibit appreciable deviations. This may be because the system deviates from virial equilibrium (see, e.g., Ramella et al. 2004), since the masses of the system is determined under this assumption.
Our main conclusions are as follows. (1) The five Abell clusters (except A1291) in the UMa supercluster demonstrate similar integral distributions of their galaxies in projected distance from the cluster center within the region under study, . The remaining clusters show various deviations. The strongest deviation is found for the cluster Anon2, most probably because of its considerable deviation from the dynamic equilibrium. (2) The infrared (-band) luminosities of the galaxy clusters correlate with their masses; the ratio also increases with both mass and luminosity, in a good agreement with the relations derived by Lin et al. (2003, 2004) for a large sample of clusters and groups of galaxies. (3) The total ratio of the mass of the Abell galaxy clusters to their IR luminosity is . For all the clusters, except Anon2, this ratio is 49 .
Acknowledgments
This work was supported in part by the ”Astronomy” Federal Science and Technology Program.
References
K. Abazajian, R. Abazajian, I. K. Adelman-McCarthy, et al.,
Astron. J. 129, 1755 (2005).
E. F. Bell, D. H. McIntosh, N. Katz, and M. D. Weinberg,
Astrophys. J., Suppl. Ser. 149, 289 (2003).
H. Bohringer, W. Voges, J. P. Huchra, et al.,
Astrophys. J., Suppl. Ser. 129, 435 (2000).
R. G. Carlberg, H. K. C. Yee, E. Ellingson, et al.,
Astrophys. J. 485, L13 (1997).
M. Girardi, S. Borgani, G. Guiricin, et al.,
Astrophys. J. 530, 62 (2000).
T. H. Jarrett, T. Chester, R. Cutri, et al.,
Astron. J. 119, 2498 (2000).
I. D. Karachentsev and A. M. Kut’kin,
Astron. Lett. 31, 299 (2005).
C. S. Kochanek, M. A. Pahre, E. E. Falco, et al.,
Astrophys. J. 560, 566 (2001).
A. I. Kopylov and F. G. Kopylova,
Astron. Lett. 27, 140 (2001).
A. I. Kopylov and F. G. Kopylova,
Astron. Lett. 27, 345 (2001).
A. I. Kopylov, F. G. Kopylova, and A. G. Gubanov,
Astron. Astropys., submitted (2005).
M. J. Ledlow, W. Voges, F. N. Owen, and J. O. Burns,
Astron. J. 126, 2740 (2003).
Y.-T. Lin, J. J. Mohr, and S. A. Stanford,
Astrophys. J. 591, 749 (2003).
Y.-T. Lin, J. J. Mohr, and S. A. Stanford,
Astrophys. J. 610, 745 (2004).
M. Ramella, W. Boschin, M. Geller, et al.,
Astron. J. 128, 2022 (2004).
K. Rines, M. J. Geller, M. J. Kurtz, et al.,
Astrophys. J. 561, L41 (2001).
K. Rines, M. J. Geller, A. Diaferio, et al.,
Astron. J. 128, 1078 (2004).
P. Schechter,
Astrophys. J. 203, 297 (1976).
Translated by N. Samus’
Table. Data for clusters in the Ursa Major supercluster
| Cluster | RA | DEC | z | ||||||
|---|---|---|---|---|---|---|---|---|---|
| J2000 | J2000 | Mpc | |||||||
| A1270 | 11 29 42.0 | +54 05 56 | 0.06890 | 53 | 1.24 | ||||
| A1291 | 11 32 23.2 | +55 58 03 | 0.05092 | 17 | 0.97 | ||||
| A1318 | 11 36 03.5 | +55 04 31 | 0.05647 | 37 | 0.94 | ||||
| A1377 | 11 47 21.3 | +55 43 49 | 0.05170 | 74 | 1.40 | ||||
| A1383 | 11 48 05.8 | +54 38 47 | 0.05979 | 55 | 1.20 | ||||
| A1436 | 12 00 08.8 | +56 10 52 | 0.06517 | 71 | 1.60 | ||||
| Anon1 | 11 15 23.8 | +54 26 39 | 0.06944 | 41 | 1.25 | ||||
| Anon2 | 11 19 46.0 | +54 28 02 | 0.07056 | 13 | 0.60 | ||||
| Anon3 | 11 29 32.3 | +55 25 20 | 0.06806 | 23 | 0.81 | ||||
| Anon4 | 11 39 08.5 | +55 39 52 | 0.06118 | 24 | 0.89 | ||||
| Sh166 | 12 03 11.9 | +54 50 50 | 0.04996 | 18 | 0.73 |