Two extremely metal-poor emission-line galaxies in the Sloan Digital Sky Survey††thanks: Based on observations collected at the European Southern Observatory, Chile, ESO program 76.B-0739.
We present spectroscopic observations with the 3.6m ESO telescope of two emission-line galaxies, J21040035 and J01130052, selected from the Data Release 4 (DR4) of the Sloan Digital Sky Survey (SDSS). From our data we determine the oxygen abundance of these systems to be respectively 12 + log O/H = 7.26 0.03 and 7.17 0.09, making them the two most metal-deficient galaxies found thus far in the SDSS and placing them among the five most metal-deficient emission-line galaxies ever discovered. Their oxygen abundances are close to those of the two most metal-deficient emission-line galaxies known, SBS 0335–052W with 12 + log O/H = 7.12 0.03 and I Zw 18 with 12 + log O/H = 7.17 0.01.
Key Words.:
galaxies: fundamental parameters – galaxies: starburst – galaxies: abundances1 Introduction
Extremely metal-deficient emission-line galaxies at low redshifts are the most promising young galaxy candidates in the local Universe (Guseva et al., 2003; Izotov & Thuan, 2004b). The studies of their nearly pristine interstellar medium (ISM) can also shed light on the properties of the primordial ISM at the time of galaxy formation. It appears now that even the most metal-deficient galaxies in the local Universe formed from matter which was already pre-enriched by a previous star formation episode, e.g. by Population III stars (Thuan et al., 2005). It is thus quite important to establish firmly the level of this pre-enrichment by searching for the most metal-deficient emission-line galaxies. Because they have not undergone much chemical evolution, these galaxies are also the best objects for the determination of the primordial He abundance and for constraining cosmological models (e.g. Izotov & Thuan, 2004a).
However, extremely metal-deficient emission-line galaxies are very rare. Many surveys have been carried out to search for such galaxies without a large success. For more than three decades, one of the first blue compact dwarf (BCD) galaxies discovered, I Zw 18 (Sargent & Searle, 1970) continued to hold the record as the most metal-deficient emission-line galaxy known, with an oxygen abundance 12 + log O/H = 7.17 0.01 in its northwestern component and 7.22 0.02 in its southeastern component (Thuan & Izotov, 2005). Only very recently, has I Zw 18 been displaced by the BCD SBS 0335–052W. This galaxy , with an oxygen abundance 12 + log O/H = 7.12 0.03, is now the emission-line galaxy with the lowest metallicity known (Izotov et al., 2005).
| Name | R.A. | DEC. |
|---|---|---|
| J21040035 | 21 04 55.3 | 35 22 |
| J01130052 | 01 13 40.4 | 52 39 |
Because of the scarcity of extremely low-metallicity galaxies such as I Zw 18 and SBS 0335–052W, we stand a better chance of finding them in very large spectroscopic surveys. One of the best surveys suitable for such a search is the Sloan Digital Sky Survey (SDSS) (York et al., 2000). However, despite intensive studies of galaxies with the definitely detected temperature-sensitive [O iii] 4363 emission line in their spectra, no emission-line galaxy with an oxygen abundance as low as that of I Zw 18 has been discovered in the SDSS Data Release 3 (DR3) and earlier releases. The lowest-metallicity emission-line galaxies found so far in these releases have oxygen abundances 12 + log O/H 7.4 (Kniazev et al., 2003, 2004; Izotov et al., 2004, 2006).
In order to find new candidates for extremely metal-deficient emission-line galaxies we carried out a systematic search for such objects in SDSS Data Release 4 (DR4), on the basis of the relative fluxes of emission lines. All extremely metal-deficient emission-line galaxies known are characterized by relatively weak (compared to H) [O ii] 3727, [O iii] 4959, 5007 and [N ii] 6583 emission lines (e.g. Izotov & Thuan, 1998a, b; Izotov et al., 2005; Pustilnik et al., 2005). These spectral properties select out uniquely low-metallicity dwarfs since no other type of galaxy possesses them. At variance with previous studies (Kniazev et al., 2003, 2004; Izotov et al., 2004, 2006) we additionally considered spectra where the [O iii] 4363 emission line is weak or not detected. Since the [O ii] 3727 line is out of the observed wavelength range in the SDSS spectra for all galaxies with a redshift lower than 0.02, we use the [O iii] 4959, 5007 and [N ii] 6583 emission to pick out extremely low-metallicity galaxy candidates. Following this strategy we selected 20 galaxies with [O iii]4959/H 1 and [N ii]6583/H 0.05.
2 Observations and Data Reduction
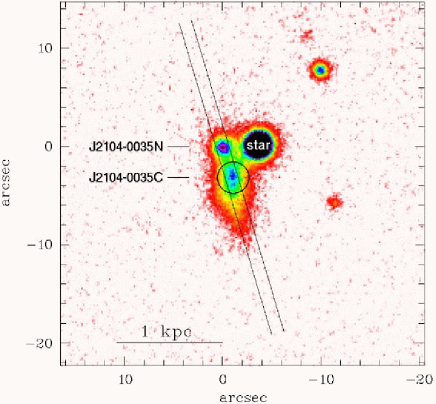
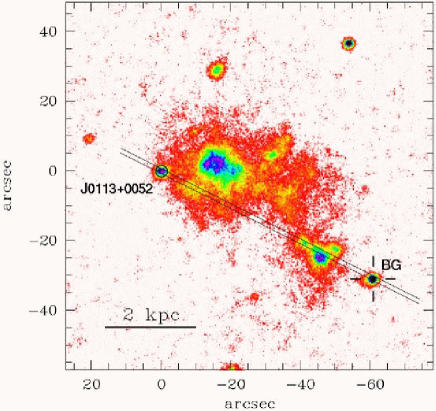
We present here new spectroscopic observations of two galaxies, J2104–0035 and J0113+0052 (Fig. 1), from the list of extremely low-metallicity candidates selected from the SDSS. We use these new observations, together with SDSS spectra to show that both galaxies have oxygen abundances nearly as low as those of the most metal-deficient emission-line galaxies known. The coordinates of the two galaxies are shown in Table 1.

Both galaxies have low redshifts, therefore the [O ii] 3727 emission line is blueward of the spectral range of the SDSS spectra (Fig. 2). This fact, in conjunction with the non-detection of the weak [O ii] 7320,7331 emission lines in the SDSS spectra, has prevented an oxygen abundance determination using publicly available SDSS data.

| SDSS | 3.6m | |||||
| Line | J21040035C | J01130052 | J21040035C | J21040035N | J01130052 | |
| 3727 [O ii] | … | … | 0.6900.068 | 0.2270.011 | 0.6880.074 | |
| 3835 H9 | … | … | … | 0.0820.012 | … | |
| 3869 [Ne iii] | … | 0.2610.045 | … | 0.2220.009 | 0.2780.044 | |
| 3889 He i + H8 | … | 0.1900.057 | … | 0.2170.010 | 0.2970.044 | |
| 3968 [Ne iii] + H7 | … | 0.1630.057 | … | 0.2010.010 | 0.1780.044 | |
| 4101 H | 0.2620.092 | 0.2520.058 | 0.2670.051 | 0.2640.009 | 0.2690.041 | |
| 4340 H | 0.4740.091 | 0.4870.077 | 0.4670.057 | 0.4770.011 | 0.4820.048 | |
| 4363 [O iii] | … | 0.0750.035 | … | 0.0970.005 | 0.0860.016 | |
| 4471 He i | … | … | … | 0.0340.004 | … | |
| 4861 H | 1.0000.107 | 1.0000.109 | 1.0000.058 | 1.0000.018 | 1.0000.056 | |
| 4959 [O iii] | 0.4050.064 | 0.6160.076 | 0.3340.033 | 0.9510.017 | 0.7100.048 | |
| 5007 [O iii] | 1.1430.113 | 1.8520.169 | 0.9620.048 | 2.8760.046 | 2.0450.090 | |
| 5876 He i | … | 0.1750.046 | … | … | … | |
| 6563 H | 2.8860.259 | 2.6170.255 | … | … | … | |
| 6583 [N ii] | 0.0510.038 | 0.0330.032 | … | … | … | |
| 6717 [S ii] | 0.0890.038 | … | … | … | … | |
| 6731 [S ii] | 0.0660.034 | … | … | … | … | |
| (H) | 0.365 | 0.000 | 0.025 | 0.000 | 0.000 | |
| EW(H)a | 21 | 41 | 42 | 203 | 193 | |
| (H)b | 9.7 | 6.4 | 6.4 | 16.7 | 2.8 | |
| EW(abs)a | 1.2 | 0.0 | 1.6 | 0.8 | 0.0 | |
a In Å.
b In units of 10-16 erg s-1 cm-2.
| SDSS | 3.6m | |||
|---|---|---|---|---|
| Property | J01130052a | J21040035N | J01130052 | |
| (O iii), K | 225207360 | 20060620 | 228802990 | |
| (O ii), K | 154804510 | 15610450 | 154101780 | |
| O+/H+, (105) | 0.5670.421 | 0.1820.016 | 0.5750.179 | |
| O2+/H+, (105) | 0.8360.593 | 1.6300.116 | 0.9060.256 | |
| O/H, (105) | 1.4030.727 | 1.8120.117 | 1.4810.313 | |
| 12+log O/H | 7.150.23 | 7.260.03 | 7.170.09 | |
| N+/H+, (107) | 2.4792.041 | … | … | |
| (N) | 2.49 | … | … | |
| N/H, (107) | 5.6625.049 | … | … | |
| log N/O | –1.390.45 | … | … | |
| Ne2+/H+, (106) | 2.5421.649 | 2.7940.211 | 2.6240.771 | |
| (Ne) | 1.17 | 1.04 | 1.17 | |
| Ne/H, (106) | 2.9812.768 | 2.9140.235 | 3.0581.260 | |
| log Ne/O | –0.670.46 | –0.790.05 | –0.690.20 | |
aO+/H+ is obtained adopting the [O ii] 3727 emission line flux from the 3.6m observations.
New spectra of six extremely low-metallicity candidates were obtained on 7 and 8 October, 2005 with the EFOSC2 (ESO Faint Object Spectrograph and Camera) mounted at the 3.6m ESO telescope at La Silla. Here we present the results for the two most metal-deficient emission-line galaxies J2104–0035 and J0113+0052 with 12 + log O/H 7.3. The spectroscopic properties of the remaining four emission-line galaxies with slightly higher oxygen abundance in the range 12 + log O/H = 7.3 – 7.6 will be discussed in a separate publication.
The observing conditions were photometric during those two nights. All 3.6m observations were performed with the same instrumental setup. We used the grism (3200–5200) with the grating 600 gr/mm. The long slit with a width of 12 was placed as it is shown in Fig. 1. The spatial scale along the slit is of 0157 pixel-1, and the spectral resolution is 6.2 Å (FWHM).
Both galaxies were observed at low airmass 1.2, therefore no corrections for atmospheric refraction are needed. The cometary galaxy J2104–0035 was observed with the slit oriented in the position angle P.A. = +16.5∘, so as to obtain simultaneously the spectra of the central region of the galaxy (J2104–0035C) and the northern H ii region (J2104–0035N). Note that only the J2104–0035C spectrum is present in the SDSS DR4 and no public data are available for the northern component, located at 6″ from the central part of the galaxy. The total exposure time was 5400 s. The galaxy J0113+0052 was observed with the slit oriented in the position angle +64∘. The total exposure time was 3600 s.
The 3.6m data were reduced with the IRAF111IRAF is the Image Reduction and Analysis Facility distributed by the National Optical Astronomy Observatory, which is operated by the Association of Universities for Research in Astronomy (AURA) under cooperative agreement with the National Science Foundation (NSF). software package. This includes bias–subtraction, flat–field correction, cosmic-ray removal, wavelength calibration, night sky background subtraction, correction for atmospheric extinction and absolute flux calibration of the two–dimensional spectrum. We extracted one-dimensional spectra of J2104–0035C and J2104–0035N respectively within apertures of 1225 and 1206, and the one-dimensional spectrum of J0113+0052 within a 1206 aperture. The slit in Fig. 1 (right panel) crosses several other knots with weak emission lines in their spectra at the same redshift as those in J0113+0052 except for the background galaxy labeled BG in Fig. 1 (right panel). The 3.6m and SDSS spectra were corrected for interstellar extinction using the reddening curve by Whitford (1958) and for redshift , derived from the observed wavelengths of the emission lines. From the 3.6m spectra, we obtained = 0.00438 0.00025 for J2104–0035C, = 0.00479 0.00014 for J2104–0035N and = 0.00400 0.00014 for J0113+0052. These values compare well with the redshifts derived from the SDSS spectra: 0.00468 for J2104–0035C and 0.00376 for J0113+0052. Redshift-corrected one-dimensional SDSS and 3.6m spectra of the two emission-line galaxies are shown in Figs. 2 and 3, respectively.
Emission line fluxes in the 3.6m and SDSS spectra were measured using Gaussian profile fitting. The errors of the line fluxes in the 3.6m spectra were calculated from the photon statistics in the non-flux-calibrated spectra. As for SDSS spectra, the errors of emission-line fluxes were obtained using the files with errors in each pixel accompanying every SDSS spectrum. The flux errors have been propagated in the calculations of the elemental abundance errors.
The observed fluxes of all hydrogen Balmer lines except for the H7 and H8 lines were used to determine the interstellar extinction and the underlying stellar absorption. The two excluded lines are blended with other strong emission lines and could not therefore be used for the determination of interstellar reddening. The extinction coefficient (H) and the equivalent width of absorption hydrogen lines EWabs are derived by minimizing deviations of corrected hydrogen emission line fluxes from the theoretical recombination values. In this procedure we assumed that EWabs is the same for all hydrogen lines. The corrected emission line fluxes () relative to the H fluxes, the extinction coefficients (H), the equivalent widths EW(H), the observed H fluxes (H), and the equivalent widths of the hydrogen absorption lines are listed in Table 2 both for 3.6m and SDSS spectra.
3 Results
The electron temperature , ionic and total heavy element abundances were derived following Izotov et al. (2006). In particular, for the O2+ and Ne2+ ions we adopt the temperature (O iii) derived from the [O iii] 4363/(4959 + 5007) emission line ratio. The N+ and O+ abundances were derived with the temperature (O ii). The latter was obtained from the relation between (O iii) and (O ii) of (Izotov et al., 2006).
The [O iii] 4363 emission line was not detected in J2104–0035C. Therefore, no abundance determination was possible for this region. The [O ii] 3727 line is beyond the wavelength range of the SDSS spectrum of J0113+0052 while [O ii] 7320, 7331 emission lines are too weak. In principle, the flux of the former could be estimated from the [N ii] 6583 emission line assuming the N/O abundance ratio typical for the low-metallicity galaxies. However, the [N ii] 6583 emission line is weak and its flux is derived with a large error (Table 2). On the other hand, the fluxes relative to the H of common emission lines in the 3.6m and SDSS spectra of J0113+0052 are similar despite the different apertures used in both observations. Therefore, to derive the oxygen abundance of this galaxy from the SDSS spectrum, we have adopted the relative flux [O ii] 3727/H determined from the 3.6m spectrum.
The 3.6m spectra covered the blue wavelength region, so that the [S ii] 6717, 6731 emission lines, usually used for the determination of the electron number density, were not observed. In the SDSS spectra, these lines are weak in both galaxies. Therefore for abundance determinations, we have adopted = 100 cm-3. The precise value of the electron number density makes little difference in the derived abundances since in the low-density limit ( 103 cm-3) which holds for the H ii regions considered here, the element abundances do not depend sensitively on .
The electron temperatures (O iii) and (O ii) for the high and low-ionization zones in H ii regions respectively, the ionization correction factors (s) and the ionic and total heavy element abundances for oxygen, neon, and nitrogen are shown in Table 3 for J2104–0035N (3.6m data) and for J0113+0052 (SDSS and 3.6m data).
The oxygen abundance in J2104–0035N is 12 + log O/H = 7.26 0.03, slightly higher than in I Zw 18, but lower than the abundance 12 + log O/H = 7.31 0.01 of the brightest part of the BCD SBS 0335–052E (Thuan & Izotov, 2005). Thus, J2104–0035 belongs to the very rare emission-line galaxies with an oxygen abundance below 7.3 (Sargent & Searle, 1970; Izotov et al., 2005; Pustilnik et al., 2005). No galaxy with comparable metallicity has been found in previous studies of the SDSS by Kniazev et al. (2003, 2004) and Izotov et al. (2004, 2006). The oxygen abundance derived for J0113+0052 is more uncertain because of its noisier spectra. However, the abundances 12 + log O/H = 7.15 0.23 and 7.17 0.09 derived independently from the SDSS and 3.6m spectra, are consistent and suggest that this galaxy is also extremely metal-poor. Its oxygen abundance compares well with that of the northwest component of I Zw 18. However, new higher signal-to-noise observations are necessary to draw more definite conclusions about the metallicity of this galaxy. The N/O and Ne/O abundance ratios in the two galaxies are consistent within the errors with the ratios obtained for other extremely metal-deficient galaxies (Izotov & Thuan, 1999).
4 Summary
We present 3.6m ESO telescope spectroscopic observations of the two extremely metal-deficient galaxies J2104–0035 and J0113+0052 selected from the Data Release 4 (DR4) of the Sloan Digital Sky Survey (SDSS). The oxygen abundances of J2104–0035 and J0113+0052 are 12 +log O/H = 7.26 0.03 and 7.17 0.09, respectively, making them the most metal-deficient emission-line galaxies found thus far in the SDSS. The two galaxies belong to the same very scarce class of BCDs with 12 +log O/H below 7.3 consisting of SBS 0335–052W (12 + log O/H = 7.12 0.03, Izotov et al., 2005), I Zw 18 (12 + log O/H = 7.17 0.01, Thuan & Izotov, 2005) and DDO 68 (12 + log O/H = 7.21 0.03, Pustilnik et al., 2005). In the future we plan to carry out spectroscopic observations for the whole sample of 20 candidates selected from the SDSS DR4. We hope to increase the number of the extremely low-metallicity galaxies and to put limits on their spatial density in the local universe.
Acknowledgements.
Y. I. I. and N. G. G. thank the hospitality of the Institute for Astrophysics (Göttingen), the support of the DFG grant No. 436 UKR 17/25/05 and of the grant No 02.07.00132 from the Ukrainian Fund of Fundamental Investigations. P.P. would like to thank Gaspare Lo Curto, Lorenzo Monaco, Carlos La Fuente, Eduardo Matamoros and the whole ESO staff at the La Silla Observatory for their support. Y. I. I. and T. X. T. acknowledge the partial financial support of NSF grant AST 02-05785. T. X. T. thanks the hospitality of the Institut d’Astrophysique in Paris and of the Service d’Astrophysique at Saclay during his sabbatical leave. He is grateful for a Sesquicentennial Fellowship from the University of Virginia. The research described in this publication was made possible in part by Award No. UP1-2551-KV-03 of the US Civilian Research & Development Foundation for the Independent States of the Former Soviet Union (CRDF). All the authors acknowledge the work of the Sloan Digital Sky Survey (SDSS) team. Funding for the SDSS has been provided by the Alfred P. Sloan Foundation, the Participating Institutions, the National Aeronautics and Space Administration, the National Science Foundation, the U.S. Department of Energy, the Japanese Monbukagakusho, and the Max Planck Society. The SDSS Web site is http://www.sdss.org/.References
- Guseva et al. (2003) Guseva, N. G., Papaderos, P., Izotov, Y. I., et al. 2003, A&A, 407, 105
- Izotov & Thuan (1998a) Izotov, Y. I., & Thuan, T. X. 1998a, ApJ, 497, 227
- Izotov & Thuan (1998b) Izotov, Y. I., & Thuan, T. X. 1998b, ApJ, 500, 188
- Izotov & Thuan (1999) Izotov, Y. I., & Thuan, T. X. 1999, ApJ, 511, 639
- Izotov & Thuan (2004a) Izotov, Y. I., & Thuan, T. X. 2004a, ApJ, 602, 200
- Izotov & Thuan (2004b) Izotov, Y. I., & Thuan, T. X. 2004b, ApJ, 616, 768
- Izotov et al. (2004) Izotov, Y. I., Stasińska, G., Guseva, N. G., & Thuan, T. X. 2004, A&A, 632, 210
- Izotov et al. (2005) Izotov, Y. I., Thuan, T. X., & Guseva, N. G. 2005, ApJ, 415, 87
- Izotov et al. (2006) Izotov, Y. I., Stasińska, G., Meynet, G., Guseva, N. G., & Thuan, T. X. 2006, A&A, 448, 955
- Kniazev et al. (2003) Kniazev, A. Y., Grebel, E. K., Hao, L., Strauss, M. A., Brinkmann, J., & Fukugita, M. 2003, ApJ, 593, 73
- Kniazev et al. (2004) Kniazev, A. Y., Pustilnik, S. A., Grebel, E. K., Lee, H., & Pramskij, A. G. 2004, ApJS, 153, 429
- Pustilnik et al. (2005) Pustilnik, S. A., Kniazev, A. Y., & Pramskij, A. G. 2005, A&A, 443, 91
- Sargent & Searle (1970) Sargent, W. L. W., & Searle, L. 1970, ApJ, 162, L155
- Thuan & Izotov (2005) Thuan, T. X., & Izotov, Y. I. 2005, ApJS, 161, 240
- Thuan et al. (2005) Thuan, T. X., Lecavelier des Etangs, A., & Izotov, Y. I. 2005, ApJ, 621, 269
- York et al. (2000) York, D. G., et al. 2000, AJ, 120, 1579
- Whitford (1958) Whitford, A. E. 1958, AJ, 63, 201