X-ray number counts of normal galaxies
Abstract
We use the number counts of X-ray selected normal galaxies to explore their evolution by combining the most recent wide-angle shallow and pencil-beam deep samples available. The differential X-ray number counts, , for early and late-type normal galaxies are constructed separately and then compared with the predictions of the local X-ray luminosity function under different evolution scenarios. The of early type galaxies is consistent with no evolution out to . For late-type galaxies our analysis suggests that it is the sources with X-ray–to–optical flux ratio that are evolving the fastest. Including these systems in the late-type galaxy sample yields evolution of the form out to . On the contrary late-type sources with are consistent with no evolution. This suggests that the population comprises the most powerful and fast evolving starbursts at moderate and high-. We argue that although residual low-luminosity AGN contamination may bias our results toward stronger evolution, this is unlikely to modify our main conclusions.
1 Introduction
In the last few years surveys carried out by the XMM-Newton and Chandra missions provided the first X-ray selected samples of normal galaxies out to cosmologically interesting redshifts (Hornschemeier et al. 2003; Bauer et al. 2004; Georgakakis et al. 2004; Norman et al. 2004; Georgantopoulos et al. 2005). This development has opened the opportunity to explore the evolution at X-ray wavelengths of the dominant population of the Universe: normal galaxies powered by stellar processes rather than accretion on a supermassive black hole. The unique feature of X-rays is that they are the only tool available to directly probe the X-ray binaries and the hot gas in galaxies, providing complementary information on their evolution compared to other wavelengths (e.g. Ghosh & White 2001).
The evidence above has motivated a number of studies which use different approaches to constrain the evolution of X-ray selected normal galaxies. Stacking of optically selected spirals in the Chandra Deep Field North provided the first evidence for evolution of these systems at X-ray wavelengths (Brandt et al. 2001; Hornchemeier et al. 2002). A more direct method, which however requires the detection of individual systems, is to estimate the X-ray luminosity function at different redshift bins (e.g. Norman et al. 2004). A simpler but equally instructive technique uses the observed number counts in comparison with model predictions assuming different forms of evolution (e.g. Ranalli, Comastri & Setti 2005). The general consensus from the complementary methods above is that the X-ray evolution of normal galaxies to is similar to that obtained from other wavelengths (e.g Hopkins 2004).
In addition to the studies above, which mainly concentrate on deep surveys (e.g. Chandra Deep Fields) aiming to select high- normal galaxies, there have also been efforts to identify such systems at low redshifts (Georgakakis et al. 2004; Georgantopoulos et al. 2005; Georgakakis et al. 2006). These samples are complementary to deep surveys, providing a tight anchor point at low- that is essential for any conclusions on evolution. Despite the significant progress in the field however, there is still limited number of studies that exploit all the complementary low and high- samples available to constrain the evolution of normal galaxies over as a wide redshift range as possible.
In this paper we expand on previous results on the X-ray evolution of normal galaxies by combining the most up to date wide-angle shallow surveys (probing on average lower-) with the latest compilation of normal galaxies in the Chandra Deep Field North and South (Bauer et al. 2004). These samples are used to construct the differential X-ray number counts of normal galaxies over about 4 dex in flux and to compare against different evolution models. We further improve on previous studies by splitting the sample into early and late-type galaxies to explore their evolution separately. This is particularly important since different galaxy types are expected to follow different evolution patterns. Throughout this paper we adopt , and .
2 Sample selection
In this paper we combine normal galaxy samples compiled from independent wide-area shallow and pencil-beam deep surveys spanning a wide range of fluxes, .
At the bright flux end we use galaxies identified in (i) the Needles in the Haystack Survey (NHS; Georgakakis et al. 2004; Georgantopoulos et al. 2005), (ii) the 1st release of the XMM-Newton Serendipitous Source Catalogue (1XMM) prodcued by the XMM-Newton Survey Science Centre (see Georgakakis et al. 2006 for the galaxy selection) and (iii) public Chandra observations, analysed as part of the XAssist project (Ptak & Griffiths 2003), that overlap with the Sloan Digital Sky Survey (SDSS; Schneider et. al. 2005). For the latter sample, full details on the field selection and normal galaxy identification will be presented in a future publication. The galaxy catalog for this sample is electronically available from the web (http://www.astro.noa.gr/xray/XAssist-SDSS.txt). In brief, sources are detected in the 0.3-8 keV band of ACIS pointings with exposure times ks, to avoid observations that are too shallow to be useful for our purposes. Fluxes in the 0.5-2 keV band are estimated from the 0.3-8 keV count-rates in the XAssist catalogue assuming a power-law spectral energy distribution with . The sensitivity curve in the 0.5-2 keV band for these observations is constructed using methods described in Georgakakis et al. (2006).
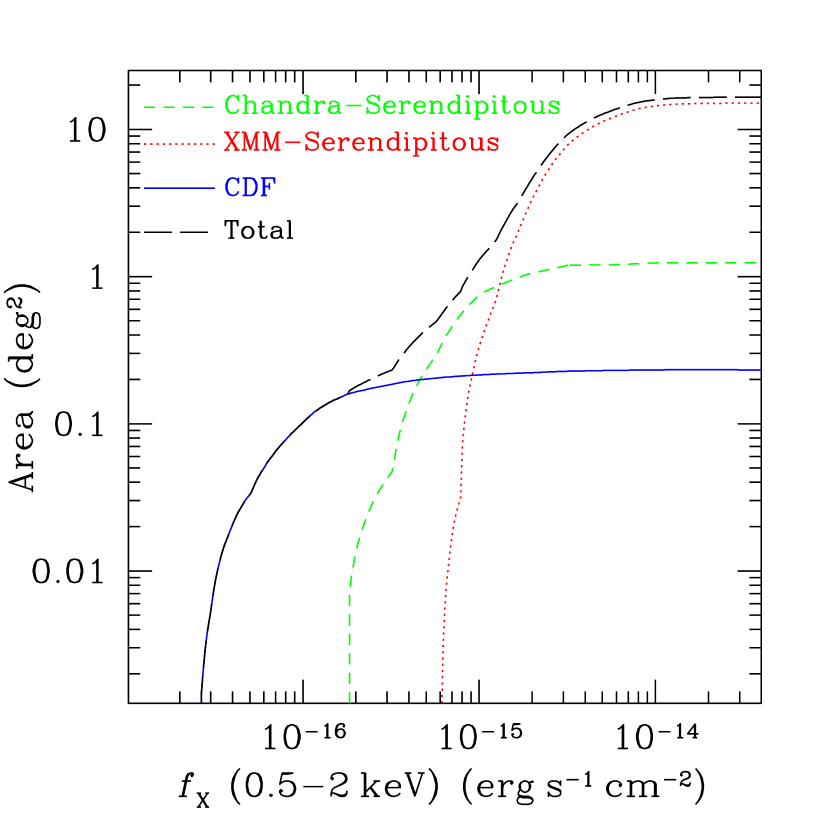
The total area of the combined bright sample (1XMM+NHS+XAssist) is about 15 deg2 with a sensitivity curve shown in Figure 1. A total of 68 normal galaxy candidates are selected by searching for sources with , soft X-ray spectral properties to avoid type-II Seyferts and optical spectra (available for 55 of the 68 sources) consistent with stellar emission rather than AGN activity. For the calculation we adopt the definition of Stocke et al. (1991) assuming and .
At faint fluxes, , we use the CDF-North and South (Alexander et al. 2003; Giacconi et al. 2002) to identify normal galaxy candidates. We focus in particular, on a total of 104 sources (28 in CDF-S and 76 in CDF-N) classified normal galaxies by Bauer et al. (2004) on the basis of their X-ray and optical properties (e.g. hardness ratios, X-ray luminosity, optical emission lines), which appear consistent with stellar processes. This sample has a less stringent X-ray–to–optical flux ratio cut, , compared to the galaxies identified in the shallow surveys above. Because of evolution and/or differential X-ray/optical k-corrections, a more stringent X-ray–to–optical flux ratio cut (e.g. ) is likely to affect more seriously these deeper samples which probe on average higher redshifts, resulting in incompleteness. On the contrary, the cut is likely to has little impact in the brighter lower- samples described above (e.g. Georgantopoulos et al. 2005; Tzanavaris et al. 2006; see section 4).
3 Galaxy classification
The normal galaxies identified in the surveys above are classified into early and late types by fitting galaxy templates to their broad band colours. For the X-ray bright samples presented here we use primarily the SDSS-DR4 photometry for spectral fitting. A total of 12 systems from the 1XMM catalogue do not have SDSS observations available, in which case we rely on visual inspection of their optical spectra for classification. For the CDF-South we use the COMBO-17 photometry (e.g. Wolf et al. 2003) while for the CDF-North we also employ the SDSS-DR4 photometry. The exception are 7 CDF-North systems fainter than the SDSS limit, for which we use the multiwaveband observations of Barger et al. (2003) .
The template SEDs are constructed by smoothly interpolating between the 4 galaxy types of Coleman, Wu & Widman (1980; E/S0, Sbc, Scd, Im) extended in the UV and IR wavelengths using the GISSEL98 code (e.g. Bruzual & Charlot 2003). This method provides a total of 60 SEDs from ellipticals (spectral classification 0) to extreme starbursts (spectral classification 60). Sources with best-fit SEDs in the range 0–25 are classified early type. This spectral range is in good agreement with the visual classification of the optical spectra (e.g. absorption lines), when available.
Table 1 summarizes the galaxy types found in the four different surveys. It is evident that the bright 1XMM, NHS and XAssist samples which include only low redshift galaxies (), consist of roughly equal numbers of early and late type galaxies. In contrast, the fainter CDF surveys consist primarily of late-type galaxies. This suggests that late and early type galaxies have different evolution with cosmic time. A quantitative analysis and a detailed discussion of this point are presented in the next section.
| sample | early | late | all |
|---|---|---|---|
| CDF (full) | 35 | 69 | 104 |
| CDF (restricted) | 12 | 22 | 34 |
| XAssist | 13 | 9 | 22 |
| 1XMM+NHS⋆ | 23 | 21 | 46 |
| total (full) | 71 | 99 | 172 |
| total (restricted) | 48 | 52 | 102 |
-
⋆2 systems in the 1XMM sample remain unclassified. See Georgakakis et al. (2006) for details.

4 The galaxy X-ray number counts
In this section we discuss the number density of X-ray selected normal galaxies over 4 decades of flux in the context of evolution models. We choose to use the differential galaxy counts, , instead of the cumulative , frequently employed in X-ray astronomy, because of the independence of individual flux bins simplifying the estimation of errors and the interpretation of the results.
Some contamination from low-luminosity AGN is expected in the ultra-deep Chandra fields used here, which comprise, on average, higher- systems that are harder to study in detail. Therefore, the full Bauer et al. (2004) sample used here (total of 104 galaxies) likely represents close to the upper bound in the number density of X-ray selected normal galaxies. We also independently consider galaxies in the Bauer et al. (2004) sample with low X-ray–to–optical flux ratio, . The AGN contamination in this restricted subsample is expected to be minimal, in the expense of possibly missing powerful starbursts or massive ellipticals, suggested to occupy the region of parameter space (e.g. Alexander et al. 2002; Bauer et al. 2002). More recently, Tzanavaris et al. (2006) cross-correlated the 2dF Galaxy Redshift Survey with public XMM-Newton and Chandra observations and found a non-negligible fraction normal galaxies at , mostly early types however, with . The evidence above suggests that the Bauer et al. (2004) CDF-North and South restricted subsample with is likely to represent the lower bound in the number density of normal galaxies.
Figure 2 presents the 0.5-2 keV differential counts for all normal galaxy candidates in the flux range identified in the surveys described in section 2. The in this figure is constructed using the sensitivity curve shown in Figure 1. We consider separately the two samples that include (i) all the Bauer et al. (2004) galaxies and (ii) only those systems in the CDF-North and South with . The former is hereafter referred to as the full sample while, the latter is dubbed the restricted sample. We fit the unbinned data for these two galaxy samples with a power-law using the parametric Maximum Likelihood method. This yields slopes of and for the full and restricted samples respectively. Using the full sample and adopting the combined early and late-type X-ray luminosity function (XLF) of Georgakakis et al. (2006) assuming luminosity evolution of the form we find . This is consistent with the evolution derived by Norman et al. (2004) and Ranalli et al. (2005). The of the restricted sample with is best fit with negative values of , implying no-evolution. The evidence above suggests that in the case of the total sample (both early and late types) the evolution is driven by the systems.


In addition to the total galaxy counts we also consider early and late-type galaxy subsamples independently. Figure 3 plots the for evolved galaxies according to the classification presented in section 3. The full and restricted subsamples for early-type galaxies are plotted separately, delineating the upper and lower X-ray number density limit of evolved galaxies. In the case of the full subsample, using the parametric maximum likelihood method and assuming luminosity evolution of the form for the Georgakakis et al. (2006) early-type XLF we constrain consistent with no evolution. The restricted subsample requires negative values of implying either incompleteness of the CDFs due to the cutoff or uncertainties in the early/late type classification. Nevertheless the evidence above suggests that optically classified early-type galaxies show little (if any) evolution at X-ray wavelengths, at least out to , the median redshift of evolved galaxies in the CDFs.
In Figure 4 we plot the differential counts for late-type galaxies. These are compared with the estimated by integrating the late-type galaxy XLF of Georgakakis et al. (2006) assuming different scenarios for the evolution of this population. The restricted subsample, comprising systems with , appears in agreement with the no evolution model. Indeed, a maximum likelihood fit to the data, parameterising the evolution as for the Georgakakis et al. (2006) late-type XLF, yields consistent with no evolution. On the contrary, a similar analysis for the full subsample gives , suggesting evolution out to , the median redshift of the late-type subsample. This suggests that it is the galaxy population that evolves the faster. Indeed, these sources are suggested to comprise a large fraction of starburst galaxies expected to show most dramatic evolution with redshift (e.g. Alexander et al. 2002). The evolution derived here for the late-type sample is comparable within the uncertainties to this of the full sample. This is not surprising as most of the galaxies at high redshift, which drive the evolution, are late-types. The derived evolution at X-ray wavelengths is consistent with that estimated for star-forming galaxy samples selected at other wavelengths (e.g. Hopkins 2004). Therefore, the late-type X-ray population studied here closely maps the star-formation history of the Universe, at least out to the median redshift of the sample, . The evolution rate derived here, , is consistent with those models of Ghosh & White (2001) that adopt a slow evolution timescale for the low-mass X-ray binary population, Gyr. Shorter timescales predict exponents much higher than that derived here, almost independent of the star-formation history of the Universe at higher redshift.
Finally, we caution that low-luminosity AGN contamination may be present in our sample. This problem is likely to be more severe for higher- systems, where weak AGN optical signatures are harder to identify against the stellar continuum (e.g. Severgnini et al. 2003). Although, the presence of low-luminosity AGN may bias our results to higher values for the evolution parameter, , we argue that this is unlikely to modify the main conclusions presented here. The X-ray spectra of many low luminosity AGN are indeed, dominated by thermal emission below about 2 keV (Levenson, Weaver & Heckman 2001; Terashima et al. 2002), suggesting stellar processes. Even if the late-type galaxy sample used in this paper has some level of residual AGN contamination, this is likely to have only a minor contribution to the 0.5-2 keV, employed here.
5 Acknowledgments
This work has been supported by the program ‘Studying Galaxies with NASA’s mission Chandra’ of the Hellenic General Secretariat for Research and Technology. We acknowledge use of data from the Sloan Digital Sky Survey and the XAssist Chandra source catalogue. This work has used data from the CXC data archive.
References
- (1) Alexander D., et al., 2003, AJ, 126, 539
- (2) Alexander D. M., Aussel H., Bauer F. E., Brandt W. N., Hornschemeier A. E., Vignali C., Garmire G. P., Schneider D. P., 2002, ApJ, 568L, 85
- (3) Bauer, F.E., Alexander, D.M., Brandt, W.N., Schneider, D.P., Treister, E., Hornschemeier, A.E., Garmire, G.P., 2004, AJ, 128, 2048
- (4) Brandt W. N., et al., 2001, AJ, 122, 1
- (5) Bruzual G. & Charlot S., 2003, MNRAS, 344, 1000
- (6) Georgakakis, A., Chavushyan V., Plionis M., Georgantopoulos, I., Koulouridis E., Leonidaki I., Mercado A., 2006, MNRAS, in press (astro-ph://0601212)
- (7) Georgakakis, A.E., Georgantopoulos, I., Basilakos, S., Plionis, M., Kolokotronis, V., 2004, MNRAS, 354, 123
- (8) Georgantopoulos I., Georgakakis A., Koulouridis E., 2005, MNRAS, 360, 782
- (9) Ghosh P. & White N. E., 2001, ApJ, 559, 97L
- (10) Giacconi R., et al., 2002, ApJS, 139, 369
- (11) Hopkins, A., 2004, ApJ, 615, 209
- (12) Hornschemeier A. E. et al., 2003, AJ, 126, 575
- (13) Hornschemeier A. E., Brandt W. N., Alexander D. M., Bauer F. E., Garmire G. P., Schneider D. P., Bautz M. W., Chartas G., 2002, ApJ, 568, 82.
- (14) Levenson N. A., Weaver K. A., Heckman T. M., 2001, ApJ, 550, 230
- (15) Norman C., et al., 2004, ApJ, 607, 721
- (16) Ptak A., & Griffiths R., 2003, ASPC, 295, 465
- (17) Ranalli, P., Comastri, A. Setti, G., 2005, A&A, 440, 23
- (18) Severgnini P. et al., 2003, A&A, 406, 483
- (19) Schneider D., et al., 2005, AJ, 130, 367
- (20) Stocke, J.T. et al., 1991, 76, 813
- (21) Terashima Y., Iyomoto N., Ho L. C., Ptak A. F., 2002, ApJS, 139, 1
- (22) Tzanavaris P., Georgantopoulos I., Georgakakis A., 2006, in preparation.
- (23) Zezas A., 2000, PhD Thesis, University of Leceister