HST/STIS SPECTRA OF NUCLEAR STAR CLUSTERS IN SPIRAL GALAXIES: DEPENDENCE OF AGE AND MASS ON HUBBLE TYPE11affiliation: Based on observations made with the NASA/ESA Hubble Space Telescope, obtained [from the Data Archive] at the Space Telescope Science Institute, which is operated by the Association of Universities for Research in Astronomy, Inc., under NASA contract NAS 5-26555. These observations are associated with proposals #9070 and #9783.
Abstract
We study the nuclear star clusters in spiral galaxies of various Hubble types using spectra obtained with STIS on-board HST. We observed the nuclear clusters in 40 galaxies, selected from two previous HST/WFPC2 imaging surveys. At a spatial resolution of the spectra provide a better separation of cluster light from underlying galaxy light than is possible with ground-based spectra. Approximately half of the spectra have a sufficiently high signal-to-noise ratio for detailed stellar population analysis. For the other half we only measure the continuum slope, as quantified by the color. To infer the star formation history, metallicity and dust extinction, we fit weighted superpositions of single-age stellar population templates to the high signal-to-noise spectra. We use the results to determine the luminosity-weighted age, mass-to-light ratio, and masses of the clusters. The models provide excellent fits to the data and generally require a mixture of populations of different ages. Approximately half of the sample clusters contain a population younger than 1 Gyr. The luminosity-weighted age ranges from 10 Myrs to 10 Gyrs. The stellar populations of NCs are generally best fit as a mixture of populations of different ages. This indicates that NCs did not form in a single event, but instead they had additional star formation long after the oldest stars formed. On average, the sample clusters in late-type spirals have a younger luminosity-weighted mean age than those in early-type spirals ( vs. ). The average mass-weighted ages are older by dex, indicating that there often is an underlying older population that does not contribute much light, but does contain most of the mass. The average cluster masses are smaller in late-type spirals than in early-type spirals ( vs. ), and exceed the masses typical of globular clusters. The cluster mass correlates loosely with total galaxy luminosity. It correlates more strongly with both the Hubble type of the host galaxy and the luminosity of its bulge. The latter correlation has the same slope as the well-known correlation between supermassive black hole mass and bulge luminosity. The properties of both nuclear clusters and black holes in the centers of spiral galaxies are therefore intimately connected to the properties of the host galaxy, and in particular its bulge component. Plausible formation scenarios will have to account for this. We discuss various possible selection biases in our results, but conclude that none of them can explain the differences seen between clusters in early- and late-type spirals. The inability to infer spectroscopically the populations of faint clusters does introduce a bias towards younger ages, but not necessarily towards higher masses.
1 INTRODUCTION
The centers of spiral galaxies have been studied for decades using ground-based observations. However, with the advent of high-spatial resolution observations from the Hubble Space Telescope (HST) it became clear that there was still much to be learned. A particularly exciting finding has been the fact that most spiral galaxies have a nuclear star cluster (NC) in their very center. The agreement between the positions of these NCs and the isophotal centers of the galaxies is generally better than one arcsecond and is consistent with zero to within the error bars (Böker et al., 2002). These NCs have now been studied in detail for large samples using broad-band imaging with HST’s Wide Field and Planetary Camera (WFPC; Phillips et al., 1996), Wide Field and Planetary Camera 2 (WFPC2; Carollo et al., 1997, 1998; Matthews et al., 1999; Böker et al., 2002, 2004) and Near-Infrared Imaging Camera and Multi Object Spectrometer (NICMOS; Carollo et al., 2001, 2002). These projects have shown that at least 50% of early-type spirals and at least 75% of late-type spirals host a NC. These NCs could hold important clues to the formation and evolution of spiral galaxies in general. And, in particular, they may be closely associated with the secular evolution processes that form pseudo-bulges and destroy bars (e.g., Athanassoula, 1992a, b; Norman et al., 1996; Carollo, 1999; Kormendy & Kennicutt, 2004). The imaging studies have shown that the NC luminosities typically range from – and that their effective radii typically range from 2–. About 50% of the NCs has an effective radius in the range of 2.4–5.0 pc (Böker et al., 2004). The dependence of these properties on Hubble type, galaxy luminosity, bulge type, bar class, nuclear environment, and other quantities has also been studied in some detail. The next logical step is to build a more detailed understanding of physical properties such as the NC mass, age, and stellar populations. These quantities are difficult to derive from multi-band imaging, due to various well-known degeneracies between age, metallicity, dust, and population mixtures. Spectroscopic observations are therefore called for to make further progress.
Up to a few years ago only NCs in a few individual nearby galaxies had been studied spectroscopically in some detail, including M33 (Kormendy & McClure, 1993; Long et al., 2002), IC 342 (Böker et al., 1999) and NGC 4449 (Böker et al., 2001). More recently data have become available for some larger samples. Walcher et al. (2005, 2006) observed a sample of nine NCs in late-type spiral galaxies using the Ultraviolet and Visual Echelle Spectrograph (UVES) on the Very Large Telescope (VLT). The data were used to determine the cluster masses from measurements of the velocity dispersion. In addition, the stellar populations were inferred from models for the spectral absorption line features. Advantages of these VLT data included both high signal-to-noise ratio () and high spectral resolution. On the other hand, the modest spatial resolution of these and other ground-based observations are a disadvantage, since it makes it difficult to disentangle the NC light from underlying bulge and disk light. This can still be done acceptably for late-type spirals, which do not have prominent bulges. However, for early-type spirals this issue quickly becomes prohibitive. This problem can be alleviated significantly by using the Space Telescope Imaging Spectrograph (STIS) on HST, but at the expense of reduced and spectral resolution. This approach was used by Sarzi et al. (2005), who studied the centers of 23 early-type spirals. Their sample was selected to contain only galaxies for which the central regions are dominated by emission lines. These galaxies comprise a mix of H ii galaxies, LINERs and Seyfert galaxies. Their results therefore provide insight into the central regions of spiral galaxies and bulges in general, but not necessarily NCs in particular.
Common findings that have emerged from the spectroscopic studies are that the NCs span a wide range of characteristic ages, from 10 Myrs to 10 Gyrs, and that NCs typically contain a mixture of populations of different ages. What has remained less clear is how and to what extent cluster ages and masses depend on the Hubble type of the galaxy. Such a dependence would not be surprising, given that many other characteristic properties of galaxy nuclei vary strongly as a function of Hubble type, including e.g.: bulge/disk ratio; bulge brightness profile shape (de Vaucouleurs law or exponential; e.g., Courteau et al, 1996; de Jong, 1996); AGN fraction (e.g., Ho et al., 1997); and black hole mass (e.g., Tremaine et al., 2002; Marconi & Hunt, 2003; Häring & Rix, 2004). Any dependence of NC properties on Hubble type would provide new constraints on theories for both NC formation and spiral galaxy evolution.
Motivated by the aforementioned considerations we present here the results of a comprehensive study of the properties of NCs as a function of Hubble type. We selected galaxies with known NCs from previous HST imaging surveys. The galaxies range from Hubble type Sa to Sm. They were observed with HST/STIS to ensure sufficient spatial resolution to allow a meaningful separation of NC light from underlying bulge and disk light, even for the earliest Hubble types. As in Sarzi et al. (2005) and Walcher et al. (2006) we fit the spectra with weighted superpositions of single-age stellar population templates from Bruzual & Charlot (2003). This yields for each NC the star formation history, metallicity, dust extinction, luminosity-weighted age, mass-to-light ratio, and mass.
The paper is laid out as follows. Section 2 describes the selection and characteristics of the sample. Section 3 discusses the acquisition and reduction of the HST/STIS spectra. Section 4 discusses the spectral population fitting procedure used for analyzing the spectra, as well as the robustness of its results. Section 5 discusses the methodology used for inferring total NC luminosities and broad-band colors from the spectra. Section 6 presents all the results, while Section 7 discusses various systematic effects that could potentially influence the results, including contamination from AGN emission, uncertainties in the subtraction of underlying bulge and disk light, and sample biases. Section 8 analyzes how the NC properties correlate with the global properties of the host galaxy, and in particular its Hubble type. Section 9 presents a summary of the main conclusions.
2 SAMPLE SELECTION
For the current spectroscopic survey we selected galaxies from the two imaging studies of NCs in spiral galaxies with HST/WFPC2. We chose early-type spirals from the sample of Carollo et al. (1998) and late-type spirals from the sample of Böker et al. (2002, 2004).
Carollo et al. (1998) imaged a sample of 40 spiral galaxies. The parent sample was selected from the UGC Catalog (Nilson, 1973) and the ESO-LV catalog (Lauberts & Valentijn, 1989) with the following primary selection criteria: (1) Hubble type between Sa and Scd (Hubble T-type between 1 and 6); (2) heliocentric velocity less than ; (3) inclination angle, estimated from the apparent axial ratio, smaller than ; and (4) angular diameter larger than 1′. The 40 galaxies presented in Carollo et al. (1998) form the random subset that were observed between 1996 March and 1997 February. NCs were detected in 23 of the 40 galaxies. For spectroscopic follow-up with HST/STIS we selected only the 16 galaxies in which a NC had been detected with a magnitude brighter than in the WFPC2 F606W filter (similar to the -band). Other NCs were considered too faint to obtain a spectrum with a reasonable with STIS in the available exposure time. We did not include the galaxy ESO 205G7, although it has a central source of magnitude . Ground-based spectra that we obtained of this object with the UVES spectrograph on the ESO/VLT in 2001 (unpublished) reveal a broad H line with a FWZI of 200 Å, indicating that it is an AGN.
Böker et al. (2002) imaged a sample of 77 spiral galaxies. The parent sample was selected from the RC3 catalog of bright galaxies (de Vaucouleurs et al., 1991) with the following primary selection criteria: (1) Hubble type between Scd and Sm (Hubble T-type between 6 and 9); (2) heliocentric velocity less than ; and (3) inclination angle, estimated from the apparent axial ratio, smaller than . The 77 galaxies presented in Böker et al. (2002) form a subset that was randomly selected from a “snapshot” pool to fill gaps in the HST observing schedule. NCs were detected in 59 of the 77 galaxies. For spectroscopic follow-up with HST/STIS we selected only the 40 galaxies in which a NC had been detected with a magnitude brighter than . Other NCs were considered too faint to obtain a spectrum with a reasonable with STIS in the available exposure time. Our spectroscopic program for the late-type spirals was also a snapshot program, so not all 40 galaxies were actually observed with STIS. In the end, data were successfully obtained for a randomly selected subset of 24 galaxies111The galaxy ESO 138 was also observed in the context of program GO#9070, but this galaxy is not included in the sample for the present paper. Due to a pointing error no spectrum was obtained of the nucleus.. One additional galaxy from the 40 (namely NGC 4411B) was observed together with the early-type galaxies (to fill the observing time vacated by ESO 205G7).
Some important properties and quantities of the sample galaxies are listed in Tables 1 and 2. The 15 early-type spirals are listed in Table 1 and the 25 late-type spirals are listed in Table 2. The listed properties include position coordinates, galaxy type, heliocentric velocity, and the apparent and absolute magnitude of the NC. Our spectroscopic sample contains some bias in the sense that we are not including the faintest NCs detected in imaging studies. We discuss the impact of this bias on our scientific results in Section 7.3.
3 OBSERVATIONS AND DATA REDUCTION
3.1 Observational Strategy
We obtained longslit spectra with STIS on-board the HST. All observations used the CCD of the instrument, which is a SITe, thinned, backside illuminated 10241024 pixel array, with a pixel size of mm. A detailed description is given in the STIS instrument handbook (Kim Quijano et al., 2003). The early-type spirals were observed in the context of HST GO program #9783 and the late-type spirals in the context of HST Snapshot program #9070 (PI on both programs: Böker). Except for the adopted exposure times, both programs used a similar observing strategy.
The observation sequence for each target started with a standard STIS point-source acquisition, in which a arcsecond image is first obtained. For the acquisition image, the telescope was pointed at the location of the galaxy center as determined from the existing WFPC2 images, and the image exposure time was chosen to provide sufficient for accurate centroiding using the brightest pixels. After adjusting the pointing based on the result, we used the grating G430L to obtain low resolution spectra, with the aim to study the stellar populations of the NCs. The resulting spectra cover the wavelength range from – Å with a pixel scale of Å in the dispersion direction. The pixel scale in the spatial direction is 005071 pix. We used the slit. The FWHM of the resulting line-spread function is pixels for a point source and pixels for a constant surface brightness extended source (Kim Quijano et al., 2003). The NCs are generally barely resolved spatially with HST (Böker et al., 2004) and fall between these two extremes. For a pixel FWHM at 4000 Å the spectral resolution is . The spectroscopic exposure time was divided over two exposures, with a 5 pixel offset along the slit in order to correct for hot pixels and cosmic ray events during data reduction. For GO program #9783 each of the two exposures was itself composed of two individual sub-exposures. The journal of observations, including the integration times and the per pixel values, is listed in Table LABEL:t:exp. The observations of the late-type spirals generally had shorter exposure times than those of the early-type spirals (by a factor ). This is due to the fact that the former were obtained in the context of a snapshot program.
3.2 Data reduction
To start the data reduction we downloaded the latest instrument calibration files from the HST Data Archive. For each target we then applied the basic pipeline process to each of the two exposures. This includes overscan subtraction and trimming, bias correction, dark correction, and flat-fielding. We then aligned the two exposures by shifting one of the two by 5 pixels in the spatial direction. Subsequently, the task ocrreject in the IRAF222IRAF is distributed by the National Optical Astronomy Observatory, which is operated by the Association of Universities for Research in Astronomy, Inc. (AURA) under cooperative agreement with the National Science Foundation. STSDAS package was used to combine the images with rejection of both cosmic rays and hot pixels. After this step there remained both some positive and negative outliers in the combined data (the former are due to improperly removed cosmic rays and hot pixels; the latter are due to pixels that are hotter in the dark frame than in the science data). To correct these outliers we applied the task cosmicrays, first on the image itself and then on a negative version of itself. Following this, we performed a two-dimensional rectification and a flux calibration. For the wavelength calibration we used arc-lamp spectra obtained in the same HST orbit. The spectra were resampled logarithmically to a scale of per pixel to facilitate the spectral fitting discussed below.
For each galaxy we extracted and co-added the central four rows of the two-dimensional spectrum. This yields a one-dimensional spectrum for a region of around the galaxy center. This translates to 17 pc17 pc at the mean distance to our galaxies. The extracted spectra contain primarily light from the bright NC, but there is also some contribution from the underlying galaxy (bulge and disk). To estimate this contribution we also extracted and co-added the rows on the two-dimensional spectrum at distances between and from the center. We subtracted the result (after proper scaling to the same number of rows) from the nuclear spectra. This also subtracts a small non-zero background count-rate that we found on most of the reduced two-dimensional spectra. The resulting one-dimensional nuclear spectra are the ones that we have used for the analysis in the remainder of this paper. It should be noted that even before subtraction the galaxy light makes only a relatively modest contribution to the nuclear spectrum. For the late-type spirals the median galaxy light contribution to the nuclear spectrum is 12%, and for the early-type spirals it is 29%. After the subtraction any remaining galaxy light contamination is probably much smaller than these percentages, although not quite zero. This is discussed further in Section 7.2. Most of the NCs have effective radii below , but there are a few with larger sizes (Böker et al., 2004). So in some cases our approach also subtracts a small amount of NC light. This is discussed further in Section 5.
4 SPECTRAL POPULATION FITTING
4.1 Modeling Approach
There are several possible approaches for using our spectra to constrain the age, metallicity, and dust extinction for the NCs in our sample. We will use here the fact that a population with arbitrary star formation history can be written as a sum of single-age stellar populations. Due to continued advances in stellar population synthesis modeling, the spectra of single-age stellar populations are now reasonably well known at a spectral resolution of a few Angstroms (e.g., Bruzual & Charlot, 2003). By fitting a weighted superposition of the spectra of single-age stellar populations to an observed spectrum one can infer the population characteristics and star formation history of the object. We will refer to this approach as “spectral population fitting”. Sarzi et al. (2005) and Walcher et al. (2006) previously used this approach to study the centers of spiral galaxies and their NCs. An alternative approach would be to extract and model individual line strength indices. This is advantageous because different absorption lines are sensitive to different properties of the stellar population. For example, some lines are mostly sensitive to age, while others are mostly sensitive to metallicity. However, we do not use absorption line indices here. Because of the limited of our spectra we can measure individual absorption lines only with limited accuracy. By contrast, the technique of spectral population fitting has the advantage that all pixels in the spectrum are modeled at the same time, so that the effect of noise is mitigated considerably. It also allows for a more straightforward interpretation of spectra with mixed populations of different age and/or metallicity. Walcher et al. (2006) used both line strength indices and spectral population fitting to analyze their ground-based VLT data of NCs, which have higher and spectral resolution than our data, but lower spatial resolution. Broadly speaking, it was found that the two methods gave consistent results.
We developed new software that fits an observed galaxy spectrum as a linear sum of population templates. The fit also allows for differences in redshift and line width between the galaxy and template spectra. The code is based on the Gauss-Hermite Pixel Fitting software for analyzing galaxy kinematics (van der Marel, 1994). It is similar to the code used by Walcher et al. (2006), which is based on the code for analyzing galaxy kinematics developed by Rix & White (1992). The best-fit is defined as the one that minimizes the difference between the observed and model spectra. It is found as the matrix solution of a non-negative least squares (NNLS) problem. This enforces the fact that none of the templates can have negative weight in the solution. To find the solution we used the fast and efficient algorithm of Lawson & Hanson (1974). Mathematical proofs exist that this algorithm will always find a global minimum (instead of a spurious local minimum). We verified the accuracy of our code by analyzing a small sub-sample of our survey with both our own code and that of Walcher et al. (2006) and found excellent agreement between the results.
As templates we used the models of single-age stellar populations prepared by Bruzual & Charlot (2003). From their collection we used the model spectra based on the Padua 1994 evolutionary tracks, utilizing a Chabrier (2003) initial mass function (IMF) with lower and upper mass cut-offs of = and = . We used model spectra for four different metallicities 0.004, 0.008, 0.02 and 0.05 and 14 different ages 6.00, 6.48, 6.78, 7.00, 7.48, 7.78, 8.00, 8.48, 8.78, 9.00, 9.48, 9.78, 10.00 and 10.30.333The age is expressed in years throughout this paper, unless noted otherwise. The metallicity value is traditionally referred to as the “solar metallicity” (). For historical consistency we will use this terminology here. However, it should be noted that it has recently been argued that the metallicity of our Sun is actually lower, namely (Asplund et al., 2005). The models have solar abundance ratios. To address the effect of dust we made versions of each template spectrum with different amounts of extinction , using the extinction law of Cardelli et al. (1989). The templates have a spectral resolution of Å, which is better than the resolution of the STIS data. All templates were rebinned to the same logarithmic scale with per pixel used for the galaxy spectra. We performed all fits over the wavelength range from 3540Å to 5680Å, for which galaxy data as well as model predictions are available. This region covers the prominent Balmer lines H, H, and H plus other prominent diagnostic absorption lines such as the Mg Ib, Ca and Fe lines.
4.2 Results
We applied the method of spectral population fitting to all of the NC spectra. We found that roughly half of the spectra did not have sufficient for a meaningful analysis of the absorption line properties. So we decided to retain for the spectral population fitting only those NCs for which the spectra had per pixel (see Table LABEL:t:exp). This criterion was chosen because at lower it proved impossible to even recover the known galaxy redshift (listed by NED, the NASA Extragalactic Database) from the absorption lines in the spectrum. Visual inspection of the low spectra also confirmed that little could be learned about their absorption lines. In practice the adopted limit corresponds to a magnitude limit of 20.35 mag for the NCs observed in program GO#9783 (see Section 2) and 19.55 mag for the NCs observed in program GO#9070. The cutoff is fainter for the early-type spirals observed in GO#9783 than for the late-type spirals observed in GO#9070 because the former were observed with longer exposure times. In total there are ten early- and nine late-type galaxies brighter than the adopted cutoffs. They are listed in Table LABEL:t:age. For the NCs that are fainter than the adopted magnitude cutoffs we use the STIS spectra only for a study of the continuum shape, and not of the absorption lines. This is discussed in Section 5 below.
To model the spectra we performed fits of different fixed metallicity and extinction . We used a grid with the four available metallicity values and extinctions increasing from zero upwards in steps mag. For each fixed combination we used our code to find the weighted mix of populations of different ages that fits the observed spectrum with the minimum , which we denote . Subsequently, we identified the best-fitting extinction and metallicity by finding the combination for which is lowest. This yields for each galaxy the best-fit model that we use in the remainder of the paper.
In principle we could have fit each NC spectrum with a weighted sum of all the available templates, including templates of different age, metallicity and extinction. However, this would introduce considerable degeneracy amongst the templates, leading to a non-unique fit that would be hard to interpret. Since we did not do this, it should be kept in mind that the best-fitting metallicity and extinction should be interpreted as “average” quantities only. Our strategy provides no insight into possible variations in metallicity and extinction within each NC. One might argue though that such variations are not large. Either way, the adopted approach is sufficient for the purposes of the present paper, and is similar to that adopted by Walcher et al. (2006).
The observed spectra are shown in black in Figure 1, with the best-fit models overplotted in red. The NCs are shown in order of increasing age. The fits are generally good, as confirmed by the values of the reduced listed in Table LABEL:t:age. A few galaxies show emission lines (e.g., NGC 3277). These were masked in the fit. The best-fit metallicity and extinction for each galaxy are listed in Table LABEL:t:age. We also list NC properties that can be derived from the age-mix that best fits the data, namely: the luminosity-weighted mean value of , which we call ; the mass-weighted mean value of , ; and the -band mass-to-light ratio in solar units, . We note also that the best-fit models successfully recovered the known redshift for all galaxies, and that the inferred line broadening was found to be consistent with expectation based on the instrumental resolution of the STIS setup (see Section 3.1).
4.3 Robustness of Population Fits
With our aforementioned method we find the best-fitting metallicity and extinction for each NC. The uncertainties on these quantities can be obtained in a straightforward manner using the statistic. This yields 1 uncertainties that are generally similar to or smaller than the spacing of our grid. The inferred metallicity and extinction should therefore be fairly accurate, as judged by these formal uncertainties. On the other hand, there could be additional systematic uncertainties that are more difficult to quantify (e.g., due to uncertainties in the modeling of stellar evolution). So to be conservative we adopt throughout this paper the spacing of our grids as estimates of the uncertainties in and , i.e., and .
In the present context we are mostly interested in constraining the ages of the NCs. As it turns out, the inferred ages are not very sensitive to either or . This is illustrated by Figures 2 and 3. Figure 2 shows for all NCs the best-fit value of the luminosity-weighted mean age as a function of extinction. For this plot we determined for each NC the metallicity and age mix that give the lowest for fixed values of in the range to (this range contains the best-fit extinction for most of the galaxies in the sample; see Table LABEL:t:age). In general, the implied decreases monotonically with increasing . This is because with increased extinction, the population must be intrinsically bluer, and therefore younger, to provide the same continuum slope. However, even a change of mag in the assumed changes the best fit age only by 0.2–0.5 dex. This is much smaller than the spread in ages amongst the different NCs. Similarly, Figure 3 shows as a function of metallicity, with and the age mix at each metallicity chosen to minimize . For young populations with , the inferred age is almost independent of . For older populations the age decreases when the metallicity increases. This is because higher-metallicity populations tend to be redder, so that a younger age (i.e., bluer continuum) is needed to provide the same continuum slope. However, even a change of dex in only changes the inferred age by dex. This is also much smaller than the spread in ages amongst the different NCs. So the overall age distribution of the NC population is insensitive to possible systematic uncertainties in the inferred extinctions and metallicities. Note also in this context that Figures 2 and 3 conservatively assume that we have no knowledge of the actual and . In reality, the values of these quantities are actually well constrained by our data.
Our template library is based on models with solar abundance ratios. Of course, the NCs under study may not have exactly these same abundance ratios. This might introduce small systematic biases in our results. However, the influence on the inferred ages is probably small. Figure 3 shows that, for the purposes of the present study, the inferred ages are relatively insensitive to variations in overall metallicity. Abundance ratio variations are probably a second-order effect as compared to variations in . Our results are therefore not likely to be sensitive to them either. This argument is supported by the good agreement between the ratios inferred from our stellar population study and those from dynamical studies, as discussed in Section 6.3.
Another possible concern might be that by allowing an arbitrary mix of ages (i.e., an arbitrary star formation history) we might somehow have provided the fit too much freedom. This could in principle decrease the accuracy of the inferred ages. To address this issue we also performed single-age fits to all NC spectra. We determined the of the fit to the data for each individual template of fixed , and age, and then adopted the template with the lowest as the best fit. The ages thus inferred agree very well with the luminosity-weighted ages inferred from the composite-age fits. For the sample as a whole we find that has an average of , with an RMS scatter of 0.36. The scatter is similar to the spacing in age between the different templates in our library, which is dex.
Another approach for assessing the accuracy of the inferred ages is to perform Monte-Carlo simulations. We did this in Böker et al. (2003). In that paper we constructed artificial galaxy spectra as a superposition of randomly chosen templates from the library with randomly chosen weights. Artificial Poisson noise was then added to the spectra with values representative of the range encountered in our observations. The artificial spectra were analyzed in similar fashion as our real data, using the same library of templates (i.e., same metallicity and extinction) used to build the artificial galaxy spectra. Statistics were performed on the relation between the luminosity-weighted age of the input spectra and the values for the same quantity inferred with the code. The 1 spread in the residuals was typically found to be dex for values of , which is the age for most of the NCs in our sample. The spread decreases for older populations and is about a factor of two smaller at . The spread is larger for younger populations, but a very young population is never mistaken for an old one (). Also, young NCs (such as the one identified in NGC 2139) tend to be bright and produce spectra of high , which decreases the uncertainty.
There are five late-type spirals in our sample that we also studied in Walcher et al. (2006). For four of these galaxies (NGCs 300, 428, 1493 and 2139) the STIS data had sufficient for spectral population fitting. A cross-comparison of our results for these galaxies with the results in Walcher et al. (2006) provides a useful consistency check. The latter paper used data from the VLT, which provides higher spectral resolution but lower spatial resolution and a smaller wavelength range. Despite these differences, the luminosity-weighted ages inferred from the VLT and STIS data agree with a mean difference of dex and a RMS scatter of dex. So the agreement is excellent, and provides no reason to mistrust the results from either study. There are no early-type spirals for which a direct comparison to our STIS results is possible. Sarzi et al. (2005) performed a study with HST/STIS of the centers of early-type spiral galaxies with emission lines, but there are no galaxies in common between our samples to make a direct comparison.
5 BROAD-BAND MAGNITUDES AND COLOR
Approximately half of our spectra have insufficient for spectral population fitting. However, even for the faintest NCs the spectra have sufficient for the calculation of integrated properties. In particular, we used the spectra to estimate the apparent magnitudes of the NCs in the Johnson and passbands. These bands cover the wavelength range of our spectra and are of particular interest because they are used most frequently in stellar population studies.
The STIS pipeline calibrates spectra to absolute fluxes in erg s cm Å using reference files that are based on observations of spectrophotometric standard stars. We used the synphot package in IRAF/STSDAS to calculate integrals over the spectra, weighted with the transmission curves of the and passbands, respectively. The results were converted to magnitudes by comparison to results obtained in a similar manner for the star Vega, which has magnitude zero in all Johnson bands to within mag (Bessell et al., 1998; Bohlin & Gilliland, 2004). The random uncertainties in the magnitudes follow from propagation of the flux uncertainties calculated by the STIS pipeline. Our spectra do not quite cover the entire wavelength range of the -band. In order to calculate -band magnitudes we extended the spectra to redder wavelengths using a linear extrapolation. Any potential systematic errors thus introduced are not expected to be large. A constant flux error of 10% over the extrapolated region would change the calculated -band magnitudes by only . More generally, the relative accuracy of the inferred magnitudes (i.e. the systematic errors in the implied colors ) is expected to be mag.
The magnitudes obtained by integration over the spectra measure only the light in our STIS aperture of . To estimate the total magnitudes of the NCs we therefore need to apply a correction for NC light that falls outside the aperture. We did this in two steps. First, we added a constant correction of mag, to account for the fact that even for a point source only % of the light falls in an aperture of (Kim Quijano et al., 2003). And second, we added a correction that depends on the extent of the NC. This correction is , where and are the fractions of the light of an extended and a point source, respectively, that fall within a aperture. The fractions were calculated using a simple Gaussian model for the light distribution, with the FWHM as the only free parameter, using eq. (A3) of van der Marel et al. (1997). For we used the FWHM measured from the intensity profile along the slit and for we used the actual FWHM of the STIS PSF. The use of a simple Gaussian model for the core of the light distribution is adequate, given that the correction of mag has already accounted for the scattering of light into the extended wings of the PSF. The final NC magnitudes, including the aperture corrections, are listed in Table LABEL:t:color. The table also lists the implied color.
As a consistency check, we compared our -band magnitudes with the instrumental magnitudes in the WFPC2/F606W filter system given by Carollo et al. (1998) for the NCs in early-type spirals. We find that on average , with an RMS scatter of mag. For comparison, single-age solar-metallicity stellar populations of and yrs have and , respectively (given the from Bruzual & Charlot (2003) and the transformations given by Holtzman et al. (1995)). We also combined our -band magnitudes with the -band magnitudes given by Böker et al. (2002) for the NCs in late-type spirals to estimate colors. These colors can be used as a consistency check for those NCs for which an independent color estimate is available. This is the case for the nine NCs for which spectral population fitting was performed in Section 4. For these NCs we calculated the predicted color based on the best-fitting stellar population mix and dust extinction, as given in Table LABEL:t:age. We find that on average , with an RMS scatter of mag. These comparisons suggest that our magnitudes are probably accurate in an absolute sense to mag, when averaged over the sample. However, for individual NCs the 1 accuracy is probably no better than mag. These absolute accuracies are reasonable, given the uncertainties associated with galaxy light subtraction and aperture corrections. Of course, photometry of images generally provides a more accurate method for estimating NC magnitudes. Nonetheless, our results are useful because they augment existing results in the literature with results in bluer passbands.
6 DISCUSSION OF SPECTRAL POPULATION FITTING RESULTS
6.1 Metallicities and Extinctions
The main focus of our investigation is the determination of the ages and masses of the NCs. A study of the NC metallicities and extinctions is not the primary interest of our paper. Accurate studies of metallicities would probably benefit from an analysis of individual line strength indices in spectra of higher , and accurate studies of extinction would probably benefit from analysis of spectra that cover a larger wavelength range. Nonetheless, our results obtained from the spectral population fitting (see Table LABEL:t:age) do have fairly small formal random uncertainties. While there might be systematic uncertainties, there are no specific omissions in our analysis that would lead us to mistrust the results. So it is of some interest to examine our findings for the metallicities and extinctions listed in Table LABEL:t:age.
Figure 4 shows histograms of the metallicity distributions. The bottom panel is for the complete sample of NCs for which we performed spectral population fitting. The top two panels show the results for the early- and late-type spirals separately. The average inferred metallicity is for the early-type spirals, for the late-types, and for the complete sample. The quoted errors are formal errors, calculated as the RMS scatter among the individual datapoints divided by . Given the crudeness of our sampling in metallicity, these errors are probably optimistic. So on the whole, the primary conclusions are that the metallicities are close to solar and that the metallicities tend to be somewhat higher in early- than in late-type spirals. These results are quite consistent with what is known about the metallicities of spiral galaxies, and the dependence on Hubble type, from studies of nebular gas (e.g., Zaritsky et al., 1994).
Figure 5 is similar to Figure 4, and shows histograms of the dust extinction distributions. The average inferred extinction is for the early-type galaxies, for the late-types, and for the complete sample. The average for the early-types is influenced somewhat disproportionately by NGC 3455. Its inferred extinction of is considerably larger than the values found for all other NCs. Without this galaxy the early-types would have . Either way, the average extinction is marginally higher for the NCs in late-type galaxies than for the NCs in early-type spirals. This is as expected, given that late-type spirals are more gas rich, show enhanced star formation and radiate more FIR emission than early-type spirals (e.g., Kennicutt, 1983; Devereux et al., 1987). In general, the results from spectral population fitting become more uncertain as the amount of dust extinction increases. However, for the sample here we do not generally find the dust extinctions to be particularly high. So there is little reason to be concerned that the inferred ages are significantly impacted by any remaining uncertainties in the exact amount of extinction, or the detailed shape of the extinction law. As a consistency check on our analysis, we also compared the inferred extinctions to the known Galactic foreground value for each galaxy. In all cases we found the inferred value to be larger than the Galactic foreground value (see Tables 1 and 2) to within the accuracy dictated by our sampling of . This is what would be expected for a successful fit, given that the total extinction should never be smaller than the known foreground extinction.
It is of interest to compare our results to those of Sarzi et al. (2005) and Walcher et al. (2006). The HST study of Sarzi et al. (2005) addressed the stellar populations in the centers of 23 galactic bulges in early-type spirals for which the central regions are dominated by emission lines. These galaxies comprise a mix of H ii galaxies, LINERs and Seyfert galaxies. Sarzi et al. (2005) found that good fits could be obtained with models of either or , consistent with the results for early-type spirals in our study. Their average extinction of also agrees well with our value of . The VLT study of Walcher et al. (2006) addressed the NCs in a sample of nine late-type spirals. The average metallicity for the Walcher et al. (2006) sample is . This is consistent with the value for the late-type galaxies in our sample. The average -band extinction found by Walcher et al. (2006) corresponds to , as compared to for the late-type spirals in our sample. Our conclusion that the dust extinctions are not particularly high is also consistent with the findings of Carollo et al. (2001), who studied the and colors of NCs in spiral galaxies using HST imaging. So overall, our results agree well with those of other authors.
6.2 Cluster Ages
We have derived luminosity-weighted ages for the 19 NCs for which we performed spectral population fitting (Table LABEL:t:age). Figure 6 shows histograms of the derived ages for the early-type, late-type and total sample. The average luminosity-weighted ages are (early-type), (late-type) and (combined sample).
The inferred average luminosity-weighted ages are smaller than the typical ages of galactic disks, for which the start of star formation was typically at least 5–10 Gyrs ago (e.g., Knox et al., 1999; Binney et al., 2000; Abadi et al., 2003). This indicates that star formation has continued in the centers of spiral galaxies after the initial formation of the galaxy. We find the ages of the NCs in late-type spirals to be smaller than those in early-type spirals. This is illustrated further by Figure 7, which shows a clear relation between and the Hubble T-type of the host galaxy (the parameters of the best linear fit and the Spearman rank-order correlation coefficient are given in Table LABEL:t:fitcoeff). This result is probably not unexpected, given that late-type spirals are more gas-rich (e.g., Young & Scoville, 1991). So there might have been more gas flows towards the center from which to form stars. Also, our finding for the nuclear clusters is consistent with the fact that the underlying disks of late-type spirals formed more of their stars recently than early-type spirals (e.g., Kennicutt, 1998). The three youngest clusters in our sample are hosted in late-type spirals, and the four oldest clusters are hosted in early-type spirals.
It is again of interest to compare our results to those of Sarzi et al. (2005) and Walcher et al. (2006). The average luminosity-weighted age for nuclear clusters in early-type spirals reported here, , is similar to the value inferred from the results of Sarzi et al. (2005). The small (non-significant) difference could be due to the fact that the Sarzi et al. (2005) sample has relatively more galaxies of very early types (Sa or even S0) than our study does. Also, the galaxies in their sample do not necessarily host nuclear star clusters and are much more biased towards AGN activity. So in view of these differences, the agreement between our results is surprisingly good. In the same spirit, the average luminosity-weighted age for nuclear clusters in late-type spirals reported here, , is similar to the value inferred from the results of Walcher et al. (2006). Their VLT sample overlaps in part with our late-type sample (there are four galaxies in common with the STIS subsample for which we performed spectral population fitting: NGCs 300, 428, 1493 and 2139). The range of Hubble types in both samples is very similar, as is the range of cluster luminosities (the average absolute magnitude of the clusters in the Walcher et al. (2006) sample is , as compared to for the NCs in late-type spirals for which we performed spectral population fitting). So the agreement of the present results with those inferred from the Walcher et al. (2006) VLT spectra is more or less what was expected. The VLT spectra had much higher spectral resolution and than our data. So the agreement does indicate that there is no reason for concern that the limited spectral resolution and of our STIS spectra might have somehow biased our results.
We note that to make a fair comparison of the results of Walcher et al. (2006) and Sarzi et al. (2005) to ours we had to convert their results to the same definitions that we have used here. Our quantity is the average logarithm of the age of the population, weighted by luminosity. By contrast, Walcher et al. (2006) and Sarzi et al. (2005) quote , which is the logarithm of the average age of the population, weighted by luminosity. We prefer the former statistic, because it more clearly highlights the contributions and presence of young populations. For example, a cluster for which 50% of the light comes from a yr old population and the other 50% comes from a yr old population has and . Note also that while we and Sarzi et al. (2005) weight by luminosity in the spectral range covered by the STIS spectra, Walcher et al. (2006) weight by luminosity in the -band. We corrected for this as well in making the aforementioned comparisons.
In addition to the luminosity-weighted ages we also calculated mass-weighted ages for our own STIS spectral population fits (see Table LABEL:t:age). The sample averages are (early-type), (late-type) and (combined sample). These mass-weighted averages are considerably older than the luminosity-weighted averages, typically by dex. This is because young populations are much brighter than old populations. So while young populations contribute a significant fraction of the light, their contribution to the total NC mass is more limited. There often is an underlying older population that does not contribute much light, but does contain most of the mass.
Although it is possible to calculate average ages in various ways, it should be kept in mind that no single number can capture the complexity of mixed populations that is present in the NCs. Like Sarzi et al. (2005) and Walcher et al. (2006) before us we find that mixed populations generally give significantly better fits to the observed spectra than single-age fits. The median difference in between the best mixed-age and single-age fits for the sample galaxies is . There are a total of 16 free parameters in the mixed-age fits (metallicity, extinction, and the 14 weights of single-age templates). The standard theory of confidence level estimation using statistics (e.g., Press et al., 1992) dictates that the 1- confidence limit around the best mixed-age fit corresponds to a contour of in the 16-dimensional parameter space. Conversely, a value is statistically significant at more than the 99.999% level. The present results provide the first demonstratation that mixed-age populations are present also in the NCs of early-type spirals. Walcher et al. (2006) studied only late-type spirals. Sarzi et al. (2005) studied early-type spirals, but their galaxies did not generally or necessarily host NCs. With our new results it is now clear that all NCs, independent of host Hubble type, did not form in a single event. Instead they had additional star formation even long after the oldest stars formed. Table LABEL:t:contr lists the derived luminosity fractions for the 19 NCs for which we performed spectral population fitting. Instead of listing the contributions of each individual single-age template, we have binned the weights into three (somewhat arbitrarily chosen) age groups. The groups correspond respectively to “young populations” (), “intermediate-age” populations (), and “old” populations (). In four of the ten NCs in early-type spirals more than half of the light comes from an old population. By contrast, in the NCs in late-type spirals the light is always dominated by an intermediate-age or young population.
6.3 Cluster Masses
The spectral population fits to the STIS spectra yield the mass-to-light ratio in the -band, (Table LABEL:t:age). These values range from to roughly . The average values are (early-type sample) and (late-type sample). The smaller value for the NCs in late-type spirals is due to the fact that on average they have younger stellar populations, as discussed above.
The NC mass is obtained upon multiplication of the -band luminosity and the value of the best composite spectral population fit (Table LABEL:t:age). The former can be calculated from the apparent magnitude (Table LABEL:t:color), the extinction (which follows from the -band extinction listed in Table LABEL:t:age), and the distance in Mpc. The distance can be calculated as , where is the systemic velocity of the galaxy corrected for Virgocentric infall as listed in Tables 1 and 2. We use here a Hubble constant . This yields for the NC mass that
| (1) |
Here and are both given in solar units. The constant is equal to , where is based on the extinction law of Rieke & Lebofsky (1985). The constant is equal to , where is the -band solar absolute magnitude (Binney & Merrifield, 1998). We used equation (1) to calculate the masses for the 19 NCs for which we did spectral population fits. The results are listed in Table LABEL:t:age.
Figure 8 shows histograms of the derived masses for the early-type, late-type and total sample. The average masses are (early-type), (late-type) and (combined sample). So on average the NCs in our sample are much more massive than globular clusters (GCs) in the Milky Way, which have a characteristic mass of (e.g., Harris, 1991). On the other hand, some of the most massive GCs in the Local Group, such as Cen in the Milky Way (Meylan, 2002) and G1 in M 31 (Meylan et al., 2001), and in other nearby galaxies such as Cen A (Martini & Ho, 2004) have masses that overlap with the low-mass end of the NC mass distribution. Such massive globular clusters are also abundant in mergers and starburst galaxies. Dynamical masses for the most massive young star clusters in the Antennae (NGC 4038/39) range from (Mengel et al., 2002), with the mass distribution showing a power-law increase towards lower masses ( over the range (Zhang & Fall, 1999; Whitmore et al., 1999)). More recently, for the GC W3 in the merger remnant NGC 7252 an even higher dynamical mass of was derived (Maraston et al., 2004). The most massive star clusters in M 82 have typical masses of (McCrady et al., 2003). Although all these objects span a range of masses, they do all obey a common relation in terms of their “Fundamental Plane” properties (Walcher et al., 2005). These similarities extend also to related objects such as the nuclei of dwarf elliptical galaxies (Geha et al., 2002) and the so-called “ultra-compact dwarf” galaxies (Haşegan et al., 2005). This indicates that the formation of all these objects could be governed by similar physical processes.
One striking aspect of Figure 8 is that the mass distribution of NCs in early-type spiral galaxies is centered around much higher masses than that in late-type spirals. This is illustrated further by Figure 9, which shows a clear relation between cluster mass and the Hubble T-type of the host galaxy (the parameters of the best linear fit and the Spearman rank-order correlation coefficient are given in Table LABEL:t:fitcoeff). As many as six out of ten NCs in early-type spirals for which we performed spectral population fits have masses (the apparent bimodality in the mass distribution for the early-type sample seen in the top panel of Figure 8 is most likely due to low number statistics and not worth attaching much significance to). For comparison, this exceeds the masses of many dwarf galaxies (e.g., Binggeli et al., 1988). This result for early-type spirals connects with an earlier finding of Carollo et al. (2002). They found that NCs in early-type spirals span a much larger range in luminosity than the NCs found in late-type spirals, with luminosities extending up to in the -band. Our work shows that the luminosity of these very bright NCs is not generally the result of a very young population with a very low . Instead, most of these very bright NCs have predominantly old populations. Hence, they are not just luminous, but also very massive.
Our mass estimates agree reasonably well with the few other published estimates for NCs in spiral galaxies. Walcher et al. (2005) determined the masses of NCs in nine late-type spiral galaxies from a combination of velocity dispersion measurements and dynamical modeling. Four of the galaxies (NGCs 300, 428, 1493 and 2139) are common to the STIS subsample for which we performed spectral population fitting. For these galaxies the average residual between our two studies (our values minus theirs) is dex. This good agreement is consistent with the findings of Walcher et al. (2006), who also found that mass estimates from dynamical modeling and spectral population fitting are more or less consistent. This agreement implies, among other things, that any systematic errors due to the assumed solar abundance ratios in the spectral population fitting cannot be large. The average NC mass of all nine late-type spiral galaxies in the Walcher et al. (2005) sample is , as compared to for the late-type spirals in our sample. Dynamical mass measurements also exist for the NCs in the nearby late-type spirals M33 (Kormendy & McClure, 1993) and IC 342 (Böker et al., 1999). The inferred values of for M33 and for IC 342 fit within the range of our NC mass determinations for late-type spirals.
We have not attempted to infer formal uncertainties on the values and masses implied by the spectral population fits. One reason for this is that the large number of free parameters and the possibility of correlations between the parameters make this a difficult problem. Also, it is likely that the true errors are dominated by systematics, rather than the of the data. Either way, the average uncertainty can be estimated from the comparison of our results to the dynamical measurements of Walcher et al. (2005). Based on this we estimate that the average error in both and does not exceed dex. However, it should be noted that the errors need not be the same for the different galaxies in the sample. When the light of the NC is dominated primarily by a single population, either young or old, the inferred and should be fairly robust. But if instead the light is dominated by a young population while at the same time the mass is dominated by an old population, then the and are more uncertain. When these quantities are determined primarily by a population that forms only a small percentage of the total light then the result is obviously more susceptible to systematic uncertainties of various kinds. Similarly, the values of discussed in Section 6.2 are then also more uncertain. An additional uncertainty comes from our coarse sampling of the ages in our template library. For example, we include spectra of and , but a population that is as old as the Universe ( yr, so that ) can only be approximated as a weighted mixture of the two. For the NCs in early-type spirals we find that one has a luminosity-weighted age that actually exceeds the canonical age of the Universe in a CDM cosmology, and there are five NCs that have a mass-weighted age for which this is true. So it is possible that the and values for these NCs have been slightly overestimated.
7 ASSESSMENT OF SYSTEMATIC EFFECTS
7.1 AGN Contributions
The galaxies that we selected for STIS spectroscopy were all chosen because they were found to have a compact nuclear source, as identified from HST imaging. In principle such a source could be either a star cluster or non-thermal emission from an AGN. However, one can discriminate between these possibilities using the size of the source. A star cluster is generally spatially resolved with HST in nearby galaxies, whereas AGN emission is unresolved.444It is usually assumed that the detection of a resolved nuclear source implies that the source is not an AGN. While this is generally a valid argument, it must be applied with some care. Continuum emission from an AGN is indeed generally not spatially resolved. However, the emission-line region in many low-luminosity AGN can often be resolved in HST images (e.g., Pogge et al., 2000). While a filter such as F606W (as used by, e.g., Carollo et al. (1998)) transmits mostly continuum, it does have a small emission-line contribution from H+[N ii] as well. Therefore, even if the nuclear source is an AGN, it is not entirely ruled out that it could appear slightly extended in F606W. Böker et al. (2004) did a detailed study of the sizes of the nuclear sources in late-type spirals. They found that all sources in their sample were spatially resolved, indicating that they are star clusters. This is not unexpected, given that we know from emission line studies that AGN are very rare in the latest Hubble types (Ho et al., 1997). Carollo et al. (1998) and Carollo et al. (2002) measured the sizes and optical vs. near-IR colors of nuclear sources in mostly early-type spirals. As in the late-type spirals, the sources were almost always found to be extended. The colors were found to be in the range to . This is similar to the range covered by stellar population synthesis predictions for star clusters with different ages and metallicities (e.g., Bruzual & Charlot, 2003). So in both late- and early-type spirals, the nuclear sources detected from HST imaging appear in large majority to be star clusters, and not AGNs. Carollo et al. (1998) did find some nuclear sources for which the spatial extent was not inconsistent with a point source. However, none of these made it into our spectroscopic STIS sample.
The fact that the nuclear sources seen in HST imaging are generally star clusters does not by itself preclude the possibility that an AGN might contribute some emission as well. Based on information in NED, only three of the 40 galaxies in our sample were previously classified as an AGN (NGC 5377) or a LINER (NGCs 4540 and 6384). Only one of these galaxies, NGC 5377, is part of the high STIS sample for which we have performed spectral population fits. Indeed, NGC 5377 shows emission lines in our STIS spectra. Only two other galaxies show emission lines as well, namely NGC 3177 and NGC 3277 (the latter has the strongest emission lines of the three galaxies, including [O II] and [O III]). And in these two galaxies the emission lines could be due to H ii regions, and need not be indicative of an AGN. Nonetheless, the true fraction of AGN in our sample could be larger, especially for early-type spirals. Based on ground-based emission line spectra 10% of Sb-Sbc galaxies are classified as Type I AGN and 34% as LINERs or transition objects (Ho et al., 1997). Of course, emission lines themselves are masked in our stellar population fitting. So an AGN would only affect our analysis through its non-thermal continuum. This would have two effects: it would change the overall continuum slope of the spectrum and it would decrease the equivalent width of the absorption lines. These effects are very similar to (and in our modeling are probably degenerate with) the effects of changes in extinction in metallicity. However, the sensitivity of the inferred population ages to uncertainties in extinction and metallicity is not particularly large for the purposes of our study. This is dicussed in detail in Section 4.3 and quantified in Figures 2 and 3. Therefore, the sensitivity of the inferred population ages to a possible non-thermal AGN contribution is probably not particularly large either.
In principle it is possible that an unknown number of galaxies in our sample is affected by the presence of an AGN continuum. In those galaxies we would still expect our age and determinations of the NC to be relatively unbiased. However, the total luminosity and mass estimates would be too high by an amount that depends on exactly what fraction of the light in the STIS spectrum is from an AGN. Since AGNs are more common in early-type spirals than in late-type spirals, this would affect early-type spirals more than late-type spirals. NCs in early-type spirals are in fact found to have higher luminosities (Carollo et al., 2002) and masses (Section 6.3) than those in late-type galaxies. However, AGN continua can probably not explain this effect. An AGN continuum can be very difficult to distinguish from a young stellar population dominated by O stars. Therefore, the amount of AGN continuum in the STIS spectra is approximately constrained to be no more than the percentage of the light in our stellar population fits that is attributed to a very young stellar population. For the early-type spirals, where we are most concerned about potential AGN contributions, these percentages are generally zero or very low (cf. Table LABEL:t:contr). Therefore, potential AGN contributions are not expected to affect our overall conclusions.
7.2 Bulge and Disk Light Subtraction
Another source of uncertainty in our analysis is the accuracy with which the galaxy (bulge and disk) light underneath the NC can be subtracted. The high spatial resolution of HST allows us to do this subtraction much more accurately than what is possible in a ground-based study. Nonetheless, the subtraction is not perfect and it is important to address how this might have affected the results. As described in Section 3.2, we subtracted the galaxy light by subtracting the spectrum observed at from the NC. This assumes implicitly that the bulge and disk have approximately constant surface brightness in the central . This is a simplification, because bulges tend to have cusped brightness profiles that increase all the way towards the center. This is not likely to affect the results for late-type spirals, which have faint or negligible bulges. So galaxy contamination to the nuclear spectrum is small, and exactly how it is modeled and corrected has little effect on the final results. However, early-type spirals have prominent bulges, and for them the galaxy light subtraction is more important. So it is important to address how potential inaccuracies in the galaxy light subtraction might have affected our results for early-type spirals.
One important test of our galaxy light subtraction procedure is to compare the luminosities derived from our spectra with those derived from HST/WFPC2 imaging by Carollo et al. (1998). Our spectra only provide a one-dimensional light profile that has been integrated over a wide slit (which reduces the contrast between the cluster light and the underlying galaxy light), sampled at resolution. By contrast, WFPC2 imaging provides a two-dimensional image that is sampled at resolution in both orthogonal directions. Therefore, the WFPC2 images allow more accurate and sophisticated techniques for galaxy light subtraction than was possible with our STIS spectroscopy, including allowance for a possible central surface brightness cusp in the bulge light. Nonetheless, the luminosities inferred from our spectra show little bias as compared to those inferred from the imaging, and appear accurate in an average sense to mag (see Section 5). Therefore, the comparison with the WFPC2 imaging results by itself provides no reason to mistrust the accuracy of the galaxy light subtraction in our STIS spectra.
What remains as a caveat is the possibility that both our study and the Carollo et al. (1998) study might have overestimated the NC cluster luminosity in early-type spirals, by underestimating the bulge contribution to the central few pixels. Our own STIS dataset does not really allow us to test this possibility in much quantitative detail. However, Carollo et al. (2002) in their appendix B described detailed and extensive tests of the accuracy of their decompositions of HST images into NC and bulge components. They found no evidence that their inferred NC luminosities would be systematically biased. Depending on the exact properties of the NC and the surrounding bulge, they did find that it is possible to infer NC luminosities that are too faint or too bright. However, for NCs with radii that are similar to those typically observed, the errors are generally no worse than mag. When averaged over a realistic range of NC and bulge properties, the average bias in NC magnitudes was found to be close to zero.
We have found here that NCs in early-type spirals are more massive than those in late-type spirals. The difference in average mass is dex (see Section 6.3). To explain these findings as a result of inaccuracies in the galaxy light subtraction, one would need to assume that NC luminosities in early-type spirals have been overestimated by an average of mag. In view of the results of Carollo et al. (2002), this seems highly unlikely. Nonetheless, it should be acknowledged that the identification and characterization of a NC embedded in a bulge with a steep luminosity profile is a difficult and potentially non-unique problem. Therefore, additional investigations into the accuracy of such decompositions remain desirable.
Possible inaccuracies in the galaxy light subtraction would not only affect the determination of the NC luminosity, as just discussed, but they might also affect our age and determinations for the NC. If bulge light has inadvertently contributed to the spectra that we have analyzed, and if bulges have older ages and higher than NCs, then we will have overestimated both the values and masses of the NCs in early-type spirals. This would go in the same direction as the correlation observed in Figure 9, and we therefore need to address the possible importance of this effect.
To proceed we need some understanding of the stellar population gradients in the central of the early-type spirals in our sample (for the galaxy light subtraction we use the observed spectrum at from the galaxy center, which corresponds to at the mean distance of our sample.) Unfortunately, little is known about this. The stellar population properties of bulges have been well-studied (Wyse et al., 1997). However, most of this work refers to much larger ( kpc) scales, and to “classical” bulges with light profiles. By contrast, NCs are preferentially found in “pseudo”-bulges with exponential light profiles (Carollo et al., 1998), the properties of which are not nearly as well understood (Kormendy & Kennicutt, 2004). Our own STIS data cannot be used to address radial population gradients, because the of the spectra drops too rapidly away from the center. Also, color gradients from HST imaging in different bands is not generally available for the galaxies in our sample.
Despite the difficulties in constraining stellar population gradients on the relevant spatial scales in our sample galaxies, there do exist some indirect arguments and observations that can provide insight. First, Carollo et al. (2001) imaged a sample of (mostly early-type) spirals with HST in both optical and near-IR wavelengths. They showed that the colors of the NCs in their sample were always similar to and consistent with the color of the surrounding pseudo-bulge. This suggests that any stellar population gradients in the very central regions of spiral galaxies may not be large. Second, as a test, we analyzed our STIS spectra both with and without subtraction of the galaxy light observed at . The inferred ages were found to be very similar for the two sets of spectra: the age difference for the NCs has a mean of dex for early-type spirals and dex for late-type spirals. If there had been large population gradients between the light in the galaxy center and at , then one might have expected the inferred age to be more sensitive to the galaxy light subtraction. And third, for late-type spirals we find that our age determinations are in excellent agreement with those of Walcher et al. (2006), even though the latter were obtained with five times worse spatial resolution and mixed in much more disk and bulge light into the spectrum that was analyzed.
None of the arguments that we have presented prove conclusively that the luminosities and values of the NCs, particularly in early-type spirals, might not have been overestimated. On the other hand, none of the available data and tests that we and others have done suggest that this has in fact been the case either. Given the available evidence, it seems unlikely that errors resulting from galaxy-light subtraction could by themselves explain the correlation of cluster mass with Hubble type shown in Figure 9. Carollo et al. (2002) found that NCs in early-type spirals tend to be brighter on average than those in late-type spirals. Therefore, NCs in early-type spirals must be more massive than those in late-type spirals unless either: (1) Carollo et al. (2002) systematically overestimated the NC luminosities in early-type spirals; or (2) NCs in early-type spirals are younger and have significantly lower than those in late-type spirals. The first possibility is not something that we can verify independently with our own STIS data, but does seem to have been tested extensively (and ruled out) by Carollo et al. (2002). The second possibility is exactly the opposite of what we conclude from our STIS data, namely that NCs in early-type spirals are older than those in late-type spirals (see Section 6.2). It seems unlikely that systematic errors in due to inaccuracies in the galaxy-light subtraction could be large enough to explain this.
So in summary, the difficulty of performing an accurate subtraction of underlying galaxy bulge and disk light certainly does cause some uncertainty in our results. However, estimates of the size of this uncertainty do not appear large enough to be able to explain the finding of Section 6.3 that early-type spirals are more massive than those in late-type spirals.
7.3 Sample Biases
7.3.1 Selection for Spectroscopy and Population Fitting
The results for the ages and masses of NCs discussed in Sections 6.2 and 6.3 pertain to those galaxies for which our STIS spectra had sufficient for spectral population fitting. This biases systematically against faint NCs. Also, an explicit brightness cutoff was also applied in the selection of the NC sample for the STIS observations themselves (see Section 2). The luminosity and of a stellar population depend systematically on age, in the sense that young populations are more luminous and have lower . It is therefore likely that the paucity of faint clusters in our sample has introduced biases in the inferred age and mass distributions of the NCs. It is important to correct for these biases to obtain results that are representative for NCs as a class.
Figure 10 shows histograms of the distribution of absolute NC magnitudes for early-type spirals. The top panel shows the distribution for all NCs detected by Carollo et al. (1998). The middle panel shows the histogram for the NCs which we have observed with HST/STIS. The bottom panel shows the histogram for those NCs for which we performed spectral population fitting. The average values of the distributions are: (WFPC2 sample; Carollo et al. (1998)), (STIS sample), and (spectral population fitting sample). Figure 11 is similar to Figure 10, but shows the distributions for late-type spirals studied by Böker et al. (2002) as a function of absolute NC magnitude . The average values of these distributions are: (WFPC2 sample; Böker et al. (2002)), (STIS sample), and (spectral population fitting sample). Overall, our sample spans an interesting range of Hubble types and luminosities. However, Figures 10 and 11 show that the NCs for which we have performed spectral population fits are on average mag brighter than the average NC in a spiral galaxy, and they also sample a more limited range of brightness than would be found in a random sample of NCs.
To translate the luminosity bias in our sample into a mass bias we need to know the average extinction, age and for the faint clusters. However, without high spectra and spectral population fits these quantities are unknown. If age, and extinction do not correlate with NC luminosity, then a bias of mag in brightness simply corresponds to a bias of in . However, this assumption need not be correct. It is therefore of interest to try to constrain observationally whether age, and extinction correlate with NC luminosity. We explored this issue explicitly for those NCs for which we performed spectral population fits, but found no obvious trends. However, this is not a very stringent test of possible correlations. The NCs for which spectral population fits were performed cover a more limited range of luminosities than all NCs in spiral galaxies (see Figures 10 and 11). Therefore, subtle correlations might easily have been masked by the intrinsic scatter in the quantities of interest.
The fact that we have measured colors for all galaxies in our STIS sample (see Table LABEL:t:color), and not just the brightest ones, allows us to study potential correlations over a larger range of NC magnitudes. Figure 12 shows histograms of for the NCs in our STIS sample for both early- and late-type spirals. Separate histograms are shown for the NCs that were bright enough for spectral population fitting (the NCs listed in Table LABEL:t:age) and those that were too faint (the NCs that are listed in Table LABEL:t:color but not in Table LABEL:t:age). For the bright sub-sample the sample averages are for early-type spirals and for late-type spirals. The fact that NCs in early-type spirals tend to have redder colors than those in late-type spirals was already hinted at in the HST study of colors by Carollo et al. (2002) (see their Figure 6). This result is revealed more clearly by our sample because it contains many more late-type spirals. Our spectral population fitting has shown that this color difference is due primarily to a difference in age: NCs in early-type spirals are generally older than those in late-type spirals, while the dust extinction is similar.
An interesting aspect of Figure 12 is the difference between the bright and faint sub-samples. For both early- and late-type spirals the distribution for the faint sub-sample is shifted towards redder colors as compared to the bright sub-sample. The shape of the distributions for the faint sub-samples also differs somewhat between the early- and late-type spirals. The faint NCs in late-type galaxies peak at about –0.9, with a small tail towards bluer colors. By contrast, the faint NCs in early-type spirals show a broader distribution. However, this is driven primarily by the unusually red colors for the NCs in NGC 5188 and NGC 6384. This could be primarily a signature of dust. An inspection of the HST/WFPC2 image in Carollo et al. (1998) for NGC 5188 reveals a very complex nuclear morphology including several dust lanes close to the nucleus, indicative of heavy extinction. To some lesser extent this also applies to NGC 6384.
For early-type spirals the sample average for the faint sub-sample (for which no spectral population fits were performed) is , compared to for the bright sub-sample. The difference in color can be explained in several ways. For example, one can attribute the entire color difference to the effects of dust. In that case the faint sub-sample must on average have mag more extinction. That would also explain why the NCs in the faint sub-sample appear on average mag fainter than those in the bright sub-sample. In this scenario, there is no need to assume that our NC mass and age estimates in Sections 6.2 and 6.3 are biased in any way. Alternatively, one can attribute the differences in color between the sub-samples to differences in age, because older populations are redder. However, even a population as old as a Hubble time is not as red as ; for one has and for one has (Bruzual & Charlot, 2003). So at least part of the color differences must be due to dust (as already mentioned, this is certainly plausible for NGC 5188 and NGC 6384). Either way, in this scenario the average that we derived for NCs in early-type spirals from spectral population fits is probably a lower limit. The NCs that were too faint to study could be as old as a Hubble time. A population as old as a Hubble time is mag less luminous in the -band than a population of the same mass with . For comparison, the NCs in the sample of Carollo et al. (1998) are on average only mag fainter than those for which we have performed spectral population fits. So the difference in brightness could be due entirely to a difference in age. There need not be a difference in average mass amongst the bright and faint samples.
For late-type spirals the sample average color for the faint sub-sample is , compared to for the bright sub-sample. Again, this difference in color can be attributed either to a difference in dust extinction () or a difference in age (; based on Bruzual-Charlot models of solar metallicity, assuming an age for the brighter sub-sample, cf. Section 6.2). The difference in age would correspond to a difference in brightness of mag in the -band, for a population of fixed mass. Both scenarios would explain why the NCs in our faint sub-sample are on average mag fainter than those in our bright sub-sample, without any need to invoke a difference in NC mass between the sub-samples. The average -band absolute magnitude for our faint sub-sample is still mag brighter than the average for all NCs in the Böker et al. (2002) sample. This, too, could be due to differences in dust absorption (), age (), mass (), or any combination thereof. While some difference in mass cannot be ruled out, a difference of would be no larger than the random uncertainties in our spectral population fitting sample averages (which are ).
Figure 12 shows differences in color between the bright and faint NCs in our sample, and as discussed, this could be due to differences in either dust extinction or age. While in general it is difficult to discriminate between these alternative explanations, differences in age could be the more plausible explanation. For the NCs that we have been able to study in detail, the amount of dust extinction was generally found to be quite small (Section 6.1). Figure 13 shows the correlation between and for the NCs for which we performed spectral population fits (Table LABEL:t:age). It is clear that at least for this sub-sample the color is almost uniquely an indicator of age, with older NCs having redder colors. Variations in dust extinction between the NCs add only a small amount of scatter to an otherwise very tight relation (the parameters of the best linear fit and the Spearman rank-order correlation coefficient are given in Table LABEL:t:fitcoeff).
As a result of our analysis of the colors of the NCs we conclude that the inferred average ages discussed in Section 6.2 are probably biased in the sense that they are younger than the true average for all NCs in spiral galaxies. Depending on whether or not there is a systematic difference in dust extinction between faint and bright NCs, the bias might be anywhere in the range –0.6 dex. For many early-type spirals this implies that the NC population need not be any younger than the galaxy itself. This is not generally true for NCs in late-type spirals. Even when a possible age-bias is accounted for, it remains true that most NCs in late-type spirals have average population ages significantly younger than a Hubble time. More generally, while there are some biases in our spectral population fitting results, none of these can account for the differences that we have found between NCs in early-type and late-type spirals. NCs in early-type spirals are older and more massive than those in late-type spirals.
By contrast to our results for the cluster ages, we have found no evidence that the average NC masses, discussed in Section 6.3, are systematically biased due to our inability to spectroscopically analyze the populations of faint clusters.
7.3.2 Completeness of Imaging Surveys
Another potential selection effect inherent to our work is that the original HST imaging surveys of Carollo et al. (1998) and Böker et al. (2002) may have been biased against the detection of faint clusters.
Böker et al. (2002) found NCs in % of the galaxies in their HST imaging study of late-type spiral galaxies. The absolute magnitude distribution for these clusters showed a cutoff at . It was argued that this cutoff is real, based on the fact that clusters as faint as could easily have been detected in all galaxies. Late-type spirals do not have prominent bulges making the detection of NCs relatively straightforward. On the other hand, no firm upper limits were set on the luminosity of potential clusters in the centers of those galaxies where no cluster was detected. So it remains possible that some of these galaxies do host a NC, but that it simply was too faint to be detected.
Carollo et al. (1998) found NCs in % of the galaxies in their HST imaging study of mostly early- and intermediate-type spiral galaxies. This should definitely be regarded as a lower limit. Due to their brighter bulges, NCs are more difficult to detect in early-type spirals than in late-type spirals. In several galaxies it was only possible for Carollo et al. (1998) to set an upper limit to the magnitude of any potential NC. In those cases, where the bulge had a very steep profile, these upper limits were not particularly stringent. So it is possible that some of these galaxies do host a NC, but that it simply was too faint to be detected. As a corollary of this, there is actually no firm statistical ground to conclude that the prevalence of NCs is lower in early-type spirals than in late-type spirals.
The possibility that some NCs might have gone undetected in the original imaging surveys is of some concern. On the other hand, there are two arguments that mitigate the potential impact of this on the interpretation of our results. First, the detection rate of NCs has been quite high in both early- and late-type spirals. Therefore, our results are probably representative at least for the majority of the NCs. So while our sample average NC properties could be biased towards higher luminosities and masses, the bias is not expected to be very large. Second, for those galaxies in which a NC has gone undetected in the imaging surveys it is not necessarily true that the NC must be atypically faint. Those galaxies might simply have had atypically bright or concentrated bulges, or unusually complicated or dusty morphologies. Therefore, our results may well be typical also for the NCs that reside in galaxies in which they were not detected.
One of the more interesting findings of our work is the correlation of NC mass with Hubble type. One potential selection effect in this correlation is that low-mass clusters may have preferentially gone undetected in early-type spirals, as compared to the late-type spirals. In other words, NCs could reside in the bottom-left of Figure 9 that were not represented in our spectroscopic survey. But even so, there remains a clear distinction between the NC masses in early and late Hubble types. Many NCs in early-type spirals are quite massive, , whereas such massive clusters are almost non-existent in late-type spirals. This is not a selection effect. There is no reason why massive NCs would not be detected in late-type spirals; they should in fact be the easiest to detect. Therefore, the absence of points in the upper-right part of Figure 9 is real.
8 RELATION BETWEEN CLUSTER MASS AND GLOBAL GALAXY PROPERTIES
An important finding of the WFPC2 study of Carollo et al. (1998) was that the NC luminosity (i.e. absolute magnitude) correlates with the host galaxy luminosity for early-type spirals. Böker et al. (2004) subsequently found a similar correlation for NCs in late-type spirals. Both studies find that more luminous galaxies tend to have more luminous NCs. However, the relations between these quantities are not the same for NCs in early-type and late-type spiral galaxies. They are offset and have a somewhat different slope. At fixed galaxy luminosity, NCs in early-type spirals tend to be more luminous than those in late-type spirals. This dependence on Hubble type was seen also in the study of Carollo et al. (2002), who concluded that NCs in early-type spirals can be significantly more luminous than those in late-type spirals.
One of the advantages allowed by the present spectral population fitting study is that it yields the mass of the NCs, and not just their luminosity. The mass of a cluster is at some level a more fundamental quantity than its luminosity, because the latter can be unduly influenced by variations in stellar population age and dust extinction amongst galaxies. We therefore use the inferred cluster masses to revisit the previously established correlations amongst NC properties and galaxy properties.
Figure 14 shows the relation between NC mass (from Table LABEL:t:age) and total blue galaxy luminosity for the 19 galaxies for which we performed spectral population fits. The quantity was calculated from the apparent magnitude (extinction- and K-corrected) listed in the RC3 (de Vaucouleurs et al., 1991) and the distances given in Tables 1 and 2. There is a correlation in the expected sense, with more luminous galaxies typically hosting more massive clusters. However, the correlation is not very strong, and is significant only with 92% confidence (see Table LABEL:t:fitcoeff). One reason why the relation may appear weaker than those presented by Carollo et al. (1998) and Böker et al. (2004) is that those authors considered samples that covered a smaller range of Hubble types. Since NCs masses correlate strongly with Hubble type (see Figure 9), any sample that mixes a large range of Hubble types will present more scatter.
Since NC luminosities and masses appear to depend strongly on both galaxy luminosity and Hubble type, it is useful to ask whether there is not one single global galaxy property with which NC mass correlates more strongly. If so, then that might be the more fundamental quantity that drives these correlations. The situation is reminiscent of that for the masses of black holes in galaxy centers. Those tend to be larger in bright galaxies than faint galaxies (e.g., M87 vs. M32) and tend to be larger in galaxies with big bulges than in those with small bulges (e.g., the Sombrero galaxy NGC 4594 vs. the Milky Way). It was realized that these facts indicate that while black hole mass correlates only weakly with global galaxy properties such as Hubble type or luminosity, it correlates much more strongly with quantities that describe the bulge. In particular, tight correlations exist with bulge velocity dispersion (e.g., Tremaine et al., 2002), mass (e.g., Häring & Rix, 2004) and luminosity (e.g., Marconi & Hunt, 2003).
For most of the galaxies in our sample we do not have access to either bulge velocity dispersions or detailed disk-bulge decompositions. However, a rough estimate of the bulge-to-total light ratio for each galaxy can be obtained from its Hubble -type (which we rounded to the nearest integer) using the correlations presented by Simien & de Vaucouleurs (1986). Of course, it should be kept in mind that these correlations have significant scatter. Moreover, the correlations are based on the assumption that the bulge can be described by an surface brightness profile, which is suspect for very late Hubble types (Kormendy & Kennicutt, 2004). Nonetheless, the bulge-to-total light ratios suggested by the correlations of Simien & de Vaucouleurs (1986) provides an useful low-order estimate. Upon multiplication by the total galaxy luminosity, , this yields an estimate for the bulge luminosity . Figure 15 shows the NC mass for the spectral population fitting sample as a function of the inferred .
There is a clear trend of increasing NC mass as a function of increasing bulge luminosity. The correlation is statistically significant at 99.99% confidence (see Table LABEL:t:fitcoeff). The RMS scatter in around the best fit is 0.72 dex. This is larger than the observational errors of dex in our mass estimates (see Section 6.3), so there does appear to be a certain amount of intrinsic scatter in the correlation. The scatter in the correlation of cluster mass with bulge luminosity is similar to that for the correlation with Hubble type ( dex, cf. Figure 9 and Table LABEL:t:fitcoeff). Both correlations are tighter than that with total galaxy luminosity (Figure 14). The correlation with bulge luminosity is a combination of the correlations with Hubble type and with total galaxy luminosity; it takes into account both the general fact that early-type spirals have higher bulge-to-total luminosity ratios than late-type spirals, and the specific fact the early-type spirals in our sample are slightly more luminous than the late-type spirals in our sample (Figure 14).
Some care must be taken in the interpretation of the correlation between NC mass and . First of all, there might have been a selection effect against NCs in the bottom right of Figure 15, for the reasons discussed in Section 7.3.2. Second, the correlation between NC mass and is not truly a one-to-one correlation. Probably not all spiral galaxies host NCs. Böker et al. (2002) found NCs in % of the galaxies in their HST imaging study of late-type spiral galaxies and Carollo et al. (1998) found NCs in % of the galaxies in their HST imaging study of mostly early- and intermediate-type spiral galaxies. Therefore, there exist galaxies that have bulges, but no NCs. Conversely, some of the late-type spiral galaxies that host NCs do not appear to have a bulge. Simien & de Vaucouleurs (1986) perform disk-bulge decompositions for galaxies with Hubble types as late as Sd (), and our estimates of use their results. However, detailed analysis of HST images of galaxies with such late Hubble types indicates that some of these galaxies simply do not host bulges at all (Böker, Stanek & van der Marel, 2003). This is even more true for galaxies of Hubble type Sm. For the two galaxies in Table LABEL:t:age with this Hubble-type we assigned a bulge-to-total light ratio based on extrapolation of the fitting function of Simien & de Vaucouleurs (1986). However, the resulting values of should probably be considered upper limits (as indicated by arrows in Figure 15), since these galaxies likely do not have a bulge at all.
The correlation of NC mass with bulge luminosity suggests that the global properties of the host galaxy play an important role in the formation process of NCs. There is evidence that the properties of both NCs and bulges depend sensitively on secular evolution processes in galaxy disks (Kormendy & Kennicutt, 2004). The stellar populations of NCs are generally best fit as a mixture of populations of different ages (see Section 6.2). This indicates that NCs did not form in a single event, but instead they had additional star formation long after the oldest stars formed. This adds to other accumulating evidence that secular evolution plays an important role in shaping the central regions of spiral galaxies. Nonetheless, the physical processes that form bulges and NCs are overall still understood relatively poorly. While the results presented here provide useful new additional constraints, it is not currently clear what causes the observed differences in NC properties as a function of Hubble type.
The present day NC mass is a function of many variables, including: the mass of the NC at its initial formation; the average mass that was added during each subsequent burst of star formation; the amount of time between bursts; and the number of bursts experienced since formation (which may or may not depend on the age of the galaxy). All of these variables might plausibly depend on the Hubble type. Scenarios with different combinations of these variables may all be able to explain the available data equally well. On the other hand, it is useful to note that some simple scenarios do appear to be ruled out by our data. For example, one might have postulated that the histories of NCs across the Hubble sequence are more of less identical except for the fact that some NCs have more frequent or more massive bursts of star formation than others. This would explain why some NCs are more massive than others. But one would then expect that high-mass clusters have average population ages that are equal to or younger than those in low-mass clusters. However, this is not observed. Figure 16 shows the relation between and (from Table LABEL:t:age) implied by our spectral population fitting results. Since both quantities individually correlate with Hubble type they also correlate with one another, in the sense that the NCs with the highest masses tend to have the oldest populations. Therefore, the differences in NC masses as a function of Hubble type must involve more parameters than just variations in the mass and frequency of star formation bursts. For example, it is possible that NCs in early-type spirals simply form with higher masses than those in late-type spirals to begin with.
The relation between NCs and the overall globular cluster systems of spiral galaxies remains at present unclear, but there could be connections. One formation mechanism for NCs is through the inspiral of globular clusters into the galactic center through dynamical friction. This process typically takes anywhere between a Gyr and a Hubble time (Milosavljević, 2004), which is not inconsistent with the inferred population ages of many of the NCs in our sample. The GCs of the Milky Way are almost uniformly more metal poor than the NCs analyzed in our sample. So in our Milky Way it is unlikely that one could form a NC from GCs. However, the GC system of the Milky Way is not representative of all other galaxies. Several galaxies are known with populations of metal rich GCs such as the LMC (Westerlund, 1997) and NGC 5128 (Yi et al., 2004). Metallicity considerations by themselves therefore seem insufficient to validate this scenario. Also, it has previously been found that individual (globular) clusters in galaxies such as M33 follow a correlation between cluster mass and population age that is not dissimilar to the correlation for NCs in Figure 16 (Chandar et al., 1999). It is not obvious whether these results are related, because individual star clusters are generally less massive () than NCs and reside in a less dense environment. Nonetheless, it could indicate a commonality in the physical process that governs the formation of both types of clusters. Such a commonality is further supported by the finding that both types of cluster fall on the same fundamental plane relations (Walcher et al., 2005).
Another important quantity that correlates strongly with the bulge luminosity is the mass of supermassive black holes (BHs) in galactic nuclei. Marconi & Hunt (2003) collected accurate black hole mass determinations from a variety of sources and determined the best-fit linear correlations of vs. in various bands. While the correlation has its lowest scatter in the near-IR -band, there is a clear correlation in the -band as well. This correlation is overplotted as a dashed line in Figure 15. Its scatter is quoted by Marconi & Hunt (2003) as dex. The slope of the relation is identical to within the statistical uncertainties to the slope of the relation between and . The latter correlation has a somewhat larger scatter though ( dex, cf. Table LABEL:t:fitcoeff). As mentioned previously, it should be kept in mind that not all spiral galaxies have NCs, while some have NCs but not bulges. On the other hand, these same things could be true for BHs as well. With well-known exceptions such as the Milky Way and NGC 4258, accurate BH mass determinations for spiral galaxies remain rather scarce (see e.g., Marconi et al., 2003; Atkinson et al., 2005). So we do not really know whether there exist some galaxies with bulges that do not host BHs. And we do know that some supermassive BHs (as revealed by AGN activity) exist in very late-type galaxies such as the Sd spiral NGC 4395 (Filippenko & Ho, 2003; Peterson et al., 2005) and the dE galaxy Pox 52 (Barth et al., 2004) that probably do not have bulges. Also, the globular cluster G1 which could have an intermediate-mass BH (e.g., Gebhardt et al., 2002, 2005) has been suggested to have been the NC of a (now disrupted) dwarf galaxy. Either way, it is not clear if there is a causal connection between the NCs and BHs that both seem to be common in (spiral) galaxies. Such a connection is not unimaginable, since star clusters have often been suggested as the source of the seed BHs that subsequently grow supermassive through merging or accretion (e.g., Portegies Zwart & McMillan, 2002; van der Marel, 2003). Comparison of the lines in Figure 15 suggests that at fixed bulge luminosity . However, this does not imply that NCs and BHs necessarily exist in the same galaxies. At present there are no individual galaxies for which both a NC mass determination and a secure BH mass determination exist. There are some galaxies with NCs that have BH mass upper limits (e.g., Böker et al., 1999; Gebhardt et al., 2001; Merritt et al., 2001). The most interesting limit exists for M33, which has . The safest conclusion from the data available at the present time is that both the properties of NCs and BHs in the centers of spiral galaxies seem intimately connected to the properties of the host galaxy, and in particular its bulge component.
9 SUMMARY AND CONCLUSIONS
We obtained longslit spectra with HST/STIS of a sample of 40 NCs in spiral galaxies of both early and late Hubble types. The sample was selected from the HST/WFPC2 imaging studies of Carollo et al. (1998) and Böker et al. (2002), respectively. At a spatial resolution of the spectra provide a much better separation of the NC from underlying bulge and disk light than is possible with ground-based spectra.
For the 19 NCs with highest we performed spectral fitting to analyze their stellar populations. A weighted superposition of single-age stellar population models from the spectral library of Bruzual & Charlot (2003) was fitted in a sense to the observed STIS spectra over the wavelength range from 3540 Å to 5680 Å. The models provide excellent fits to the data. They yield the star formation history of each NC, the -band mass-to-light ratio , and the luminosity-weighted and mass-weighted mean population ages, and . We find the average uncertainty in the inferred age to be dex.
We used the spectra for all 40 targets to determine the NC luminosity in the band (taking into account corrections for aperture losses), as well as the color. The inferred luminosities are broadly consistent with those obtained from the HST/WFPC2 imaging studies. For the galaxies with spectral population fits we combined with the inferred values of to estimate the NC mass . We find the average uncertainty in the inferred mass to be dex. The inferred masses agree with dynamical mass measurements for the few NCs in our sample for which such measurements are available.
The metallicity and dust extinction were varied to optimize the spectral population fits. In general the NC metallicities are close to solar, but they tend to be somewhat higher in early- than in late-type spirals. The average extinction towards the NCs is relatively low, –, and does not differ much between early- and late-type spirals. Tests showed that uncertainties in the assumed values of and do not significantly affect the inferred population ages.
The best spectral fits generally contain a mixture of populations of different ages. Approximately 53% of the NCs contain a population younger than 1 Gyr. The NCs show a wide range of luminosity-weighted ages, ranging from 10 Myrs to 10 Gyrs. On average, NCs in late-type spirals are younger than in early-type spirals ( vs. ). For both galaxy types the NC age is less than the typical age of galactic disks. The stellar populations of NCs are generally best fit as a mixture of populations of different ages (see Section 6.2). This indicates that NCs did not form in a single event, but instead they had additional star formation long after the oldest stars formed. The average mass-weighted ages are considerably older than the luminosity-weighted ages, typically by dex. So there often is an underlying older population that does not contribute much light, but does contain most of the mass.
The average NC masses are smaller in late-type spirals than in early-type spirals ( vs. ). For both galaxy types the NCs are much more massive than typical globular clusters in the Milky Way. However, the lowest NC masses overlap with the high-mass end of the globular cluster mass distribution in some other galaxies.
We presented a detailed discussion of various systematic effects that might have influenced our results, including contamination from AGN emission, uncertainties in the subtraction of underlying bulge and disk light, and sample biases. Each of these probably play a role at some level. However, we argued that none of them can explain the differences that we find between NCs in early- and late-type spirals.
The primary impact of sample biases is that the average NC ages for our sample might be lower than they would have been for an unbiased NC sample. This is because older NCs are fainter and are therefore less likely to yield sufficient for spectral population fitting. However, based on a joint analysis of luminosities and colors (available for all the NCs in our STIS sample, even those with low spectra) we found no evidence that the inferred NC masses are necessarily biased.
Our findings are broadly consistent with those obtained in other recent spectroscopic studies of NCs, in particular those of Walcher et al. (2005, 2006) and Sarzi et al. (2005). The primary new contribution of the present work is the added insight about the variations in NC properties as a function of Hubble type. This particular issue was addressed previously by Carollo et al. (2002). They found that NCs in early-type spirals have a higher average luminosity than those in late-type spirals. Our work shows that this is not because NCs in early-type spirals are younger. To the contrary, we actually find them to be older. Therefore, NCs in early-type spirals are not just more luminous than those in late-type spirals, but also more massive.
The NC mass correlates loosely with total galaxy luminosity. It correlates more strongly with both the Hubble type of the galaxy and the luminosity of the host galaxy bulge. But it should be kept in mind that not all spiral galaxies necessarily have a bulge or a NC. Also, the correlations do have considerable scatter (– dex in at a fixed Hubble type or bulge luminosity). The correlation of with bulge luminosity is particularly intriguing because it has the same slope as the well-known correlation between supermassive black hole mass and bulge luminosity. At fixed bulge luminosity the correlations predict . This does not imply that NCs and black holes necessarily exist in the same galaxies, so the implications of this relation remain unclear. However, it does appear that the properties of both NCs and black holes in the centers of spiral galaxies are intimately connected to the properties of the host galaxy, and in particular to its bulge component.
References
- Abadi et al. (2003) Abadi, M. G., Navarro, J. F., Steinmetz, M., & Eke, V. R. 2003, ApJ, 597, 21
- Asplund et al. (2005) Asplund, M., Grevesse, N., & Sauval, A. J. 2005, in: Cosmic abundances as records of stellar evolution and nucleosynthesis in honor of David L. Lambert, ed. T. G. Barnes III & F. N. Bash, ASP Conference Series Vol. 336, p. 25
- Athanassoula (1992a) Athanassoula, E. 1992a, MNRAS, 259, 328
- Athanassoula (1992b) Athanassoula, E. 1992b, MNRAS, 259, 345
- Atkinson et al. (2005) Atkinson, J. W., et al. 2005, MNRAS, 359, 504
- Barth et al. (2004) Barth, A. J., Ho, L. C., Rutledge, R. E., & Sargent, W. L. W. 2004, ApJ, 607, 90
- Binney et al. (2000) Binney, J., Dehnen, W., & Bertelli, G. 2000, MNRAS, 318, 658
- Bessell et al. (1998) Bessell, M. S., Castelli, F., & Plez, B. 1998, A&A, 333, 231
- Binggeli et al. (1988) Binggeli, B., Sandage, A., & Tammann, G. A. 1988, ARA&A, 26, 509
- Binney & Merrifield (1998) Binney, J. J., & Merrifield, M. 1998, Galactic Astronomy (Princeton: Princeton University Press)
- Böker et al. (1999) Böker, T., van der Marel, R. P., & Vacca, W. D. 1999, AJ, 118, 831
- Böker et al. (2001) Böker, T., van der Marel, R. P., Mazzuca, L., Rix, H.-W., Rudnick, G., Ho, L. C., & Shields, J. C. 2001, AJ, 121, 1473
- Böker et al. (2002) Böker, T., Laine, S., van der Marel, R. P., Sarzi, M., Rix, H.-W., Ho, L. C., & Shields, J. C. 2002, AJ, 123, 1389
- Böker, Stanek & van der Marel (2003) Böker, T., Stanek, R., & van der Marel, R. P. 2003, AJ, 125, 1073
- Böker et al. (2003) Böker, T., van der Marel, R. P., Gerssen, J., Walcher, C. J., Rix, H.-W., Shields, J. C., & Ho, L. C. 2003, SPIE, 4834, 57
- Böker et al. (2004) Böker, T., Sarzi, M., McLaughlin, D. E., van der Marel, R. P., Rix, H.-W., Ho, L. C., & Shields, J. C. 2004, AJ, 127, 105
- Bohlin & Gilliland (2004) Bohlin, R. C., & Gilliland, R. L. 2004, AJ, 127, 3508
- Bruzual & Charlot (2003) Bruzual, G., & Charlot, S. 2003, MNRAS, 344, 1000
- Cardelli et al. (1989) Cardelli, J. A., Clayton, G. C., & Mathis, J. S. 1989, ApJ, 345, 245
- Carollo et al. (1997) Carollo, C. M., Stiavelli, M., de Zeeuw, P. T., & Mack, J. 1997, AJ, 114, 2366
- Carollo et al. (1998) Carollo, C. M., Stiavelli, M., & Mack, J. 1998, AJ, 116, 68
- Carollo (1999) Carollo, C. M. 1999, ApJ, 523, 566
- Carollo et al. (2001) Carollo, C. M., Stiavelli, M., de Zeeuw, P. T., Seigar, M., & Dejonghe, H. 2001, ApJ, 546, 216
- Carollo et al. (2002) Carollo, C. M., Stiavelli, M., Seigar, M., de Zeeuw, P. T., & Dejonghe, H. 2002, AJ, 123, 159
- Chabrier (2003) Chabrier, G. 2003, PASP, 115, 763
- Chandar et al. (1999) Chandar, R., Bianchi, L., & Ford, H. C. 1999, ApJ, 517, 668
- Courteau et al (1996) Courteau, S., de Jong, R. S., & Broeils, A. H. 1996, ApJ, 457, L73
- de Jong (1996) de Jong, R. S. 1996, A&AS, 118, 557
- de Vaucouleurs et al. (1991) de Vaucouleurs, G., de Vaucouleurs, A., Corwin, H., Buta, R. J., Paturel, G., & Fouque, P. 1991, Third Reference Catalogue of Bright Galaxies, (New York: Springer-Verlag)
- Devereux et al. (1987) Devereux, N. A., Becklin, E. E., & Scoville, N. 1987, ApJ, 312, 529
- Filippenko & Ho (2003) Filippenko, A. V., & Ho, L. C. 2003, ApJ, 588, L13
- Freedman et al. (1992) Freedman, W. L., Madore, B. F., Hawley, S. L., Horowitz, I. K., Mould, J., Navarrete, M., & Sallmen, S. 1992, ApJ, 396, 80
- Gebhardt et al. (2001) Gebhardt, K., et al. 2001, AJ, 122, 2469
- Gebhardt et al. (2002) Gebhardt, K., Rich, R. M., & Ho, L. C. 2002, ApJ, 578, L41
- Gebhardt et al. (2005) Gebhardt, K., Rich, R. M., & Ho, L. C. 2005, ApJ, 634, 1093
- Geha et al. (2002) Geha, M., Guhathakurta, P., & van der Marel, R. P. 2002, AJ, 124, 3073
- Häring & Rix (2004) Häring, N. & Rix, H.-W. 2004, ApJ, 604, L89
- Harris (1991) Harris, W. E. 1991, ARA&A, 29, 543
- Haşegan et al. (2005) Haşegan, M., et al. 2005, ApJ, 627, 203
- Ho et al. (1997) Ho, L. C., Filippenko, A. V., & Sargent, W. L. W. 1997, ApJ, 487, 568
- Holtzman et al. (1995) Holtzman, J. A., Burrows, C. J., Casertano, S., Hester, J. J., Trauger, J. T., Watson, A. M., & Worthey, G. 1995, PASP, 107, 1065
- Kennicutt (1983) Kennicutt, R. C., Jr. 1983, ApJ, 272, 54
- Kennicutt (1998) Kennicutt, R. C., Jr. 1998, ARA&A, 36, 189
- Kim Quijano et al. (2003) Kim Quijano, J., et al. 2003, STIS Instrument Handbook, Version 7.0, (Baltimore: STScI).
- Knox et al. (1999) Knox, R. A., Hawkins, M. R. S., & Hambly, N. C. 1999, MNRAS, 306, 736
- Kormendy & McClure (1993) Kormendy, J., & McClure, R. D. 1993, AJ, 105, 1793
- Kormendy & Kennicutt (2004) Kormendy, J., & Kennicutt, R. C., Jr. 2004, ARA&A, 42, 603
- Lauberts & Valentijn (1989) Lauberts, A., & Valentijn, E. A. 1989, The surface photometry catalogue of the ESO-Uppsala galaxies, (Garching: European Southern Observatory)
- Lawson & Hanson (1974) Lawson, C. L., & Hanson, R. J. 1974, Solving Least Squares Problems (Englewood Cliffs, New Jersey: Prentice-Hall)
- Long et al. (2002) Long, K. S., Charles, P. A., & Dubus, G. 2002, ApJ, 569, 204
- Maraston et al. (2004) Maraston, C., Bastian, N., Saglia, R. P., Kissler-Patig, M., Schweizer, F., & Goudfrooij, P. 2004, A&A, 416, 467
- Marconi & Hunt (2003) Marconi, A., & Hunt, L. K. 2003, ApJ, 589, L21
- Marconi et al. (2003) Marconi, A., et al. 2003, ApJ, 586, 868
- Martini & Ho (2004) Martini, P., & Ho, L. C. 2004, ApJ, 610, 233
- Matthews et al. (1999) Matthews, L. D., et al. 1999, AJ, 118, 208
- McCrady et al. (2003) McCrady, N., Gilbert, A. M., & Graham, J. R. 2003, ApJ, 596, 240
- Mengel et al. (2002) Mengel, S., Lehnert, M. D., Thatte, N., & Genzel, R. 2002, A&A, 383, 137
- Merritt et al. (2001) Merritt, D., Ferrarese, L., & Joseph, C. L. 2001, Science, 293, 1116
- Meylan (2002) Meylan, G. 2002, in: Extragalactic Star Clusters, IAU Symp. 207, ed. D. Geisler, E. K. Grebel, and D. Minniti. (San Francisco: ASP), p. 555
- Meylan et al. (2001) Meylan, G., Sarajedini, A., Jablonka, P., Djorgovski, S. G., Bridges, T., & Rich, R. M. 2001, AJ, 122, 830
- Milosavljević (2004) Milosavljević, M. 2004, ApJ, 605, L13
- Nilson (1973) Nilson, P. 1973, Uppsala General Catalogue of Galaxies, (Uppsala: Uppsala Astronomiska Observatorium)
- Norman et al. (1996) Norman, C. A., Sellwood, J. A., & Hasan, H. 1996, ApJ, 462, 114
- Peterson et al. (2005) Peterson, B. M., et al. 2005, ApJ, 632, 799
- Phillips et al. (1996) Phillips, A. C., Illingworth, G. D., MacKenty, J. W., & Franx, M. 1996, AJ, 111, 1566
- Pogge et al. (2000) Pogge, R. W., Maoz, D., Ho, L. C., & Eracleous, M. 2000, ApJ, 532, 323
- Portegies Zwart & McMillan (2002) Portegies Zwart, S. F., & McMillan, S. L. W. 2002, ApJ, 576, 899
- Press et al. (1992) Press, W. H., Teukolsky, S. A., Vetterling, W. T., & Flannery, B. P. 1992, Numerical Recipes (Cambridge: Cambridge University Press)
- Rieke & Lebofsky (1985) Rieke, G. H., & Lebofsky, M. J. 1985, ApJ, 288, 618
- Rix & White (1992) Rix, H.-W., & White, S. D. M. 1992, MNRAS, 254, 389
- Sandage & Tammann (1990) Sandage, A., & Tammann, G. A. 1990, ApJ, 365, 1
- Sarzi et al. (2005) Sarzi, M., Rix, H.-W., Shields, J. C., Ho, L. C., Barth, A. J., Rudnick, G., Filippenko, A. V., & Sargent, W. L. W. 2005, ApJ, 628, 169
- Schlegel et al. (1998) Schlegel D. J., Finkbeiner, D. P., & Davis, M. 1998, ApJ, 500, 525
- Simien & de Vaucouleurs (1986) Simien, F., & de Vaucouleurs, G. 1986, ApJ, 302, 564
- Tremaine et al. (2002) Tremaine, S., et al. 2002, ApJ, 574, 740
- van der Marel (1994) van der Marel, R. P. 1994, MNRAS, 270, 271
- van der Marel et al. (1997) van der Marel, R. P., de Zeeuw, P. T., & Rix, H.-W. 1997, ApJ, 488, 119
- van der Marel (2003) van der Marel, R. P. 2003, in: The Astrophysics of Gravitational Wave Sources, ed. J. M. Centrella, AIP Conference Proceedings, Vol. 686, p. 115
- Walcher et al. (2005) Walcher, C. J., van der Marel, R. P., McLaughlin, D. E., Rix, H.-W., Böker, T., Häring, N., Ho, L. C., Sarzi, M., & Shields, J. C. 2005, ApJ, 618, 237
- Walcher et al. (2006) Walcher, C. J., Böker, T., Charlot, S., Ho, L. C., Rix, H.-W., Rossa, J., Shields, J. C., & van der Marel, R. P. 2006, ApJ, submitted
- Westerlund (1997) Westerlund, B. E. 1997, The Magellanic Clouds, (Cambridge: Cambridge University Press)
- Whitmore et al. (1999) Whitmore, B. C., Zhang, Q., Leitherer, C., Fall, S. M., Schweizer, F., & Miller, B. W. 1999, AJ, 118, 1551
- Wyse et al. (1997) Wyse, R. F. G., Gilmore, G., & Franx, M. 1997, ARA&A, 35, 637
- Yi et al. (2004) Yi, S. K., Peng, E., Ford, H., Kaviraj, S., & Yoon, S.-J. 2004, MNRAS, 349, 1493
- Young & Scoville (1991) Young, J. S., & Scoville, N. Z. 1991, ARA&A, 29, 581
- Zaritsky et al. (1994) Zaritsky, D., Kennicutt, R. C., Jr., & Huchra, J. P. 1994, ApJ, 420, 87
- Zhang & Fall (1999) Zhang, Q., & Fall, S. M. 1999, ApJ, 527, L81
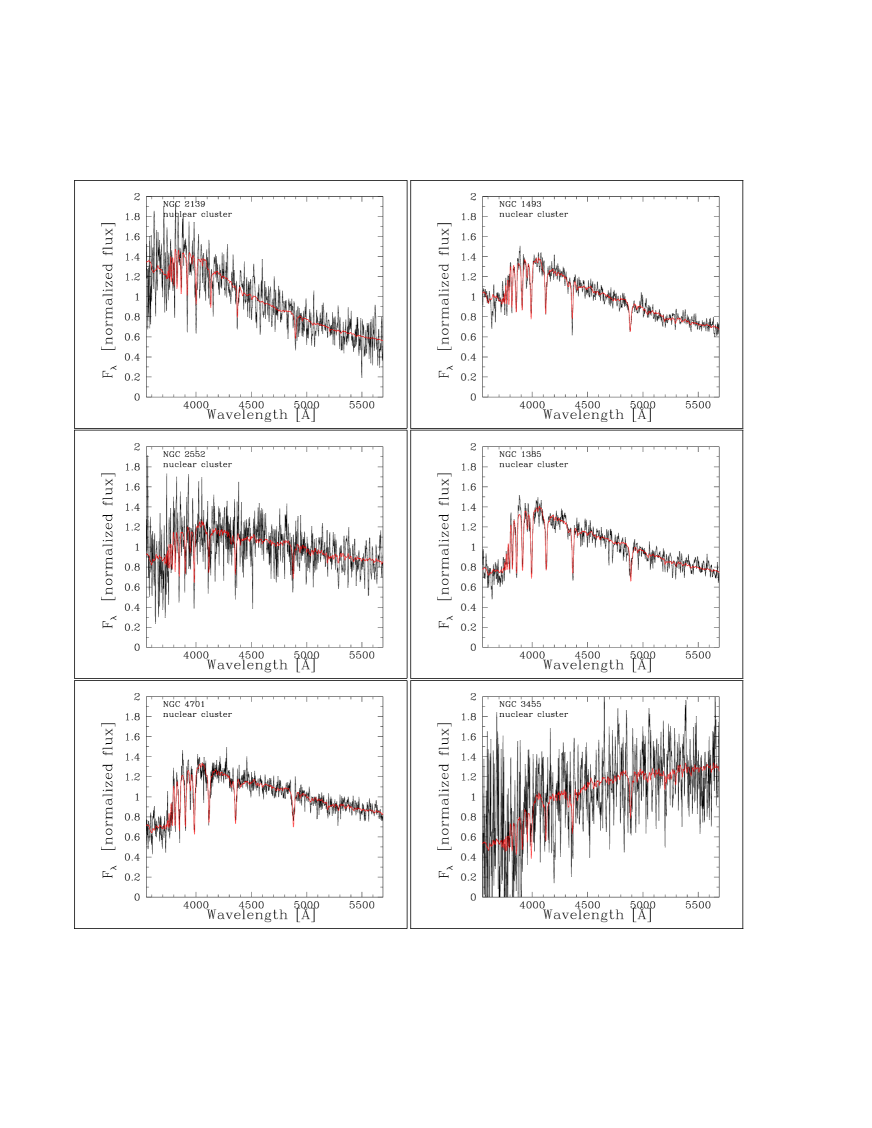
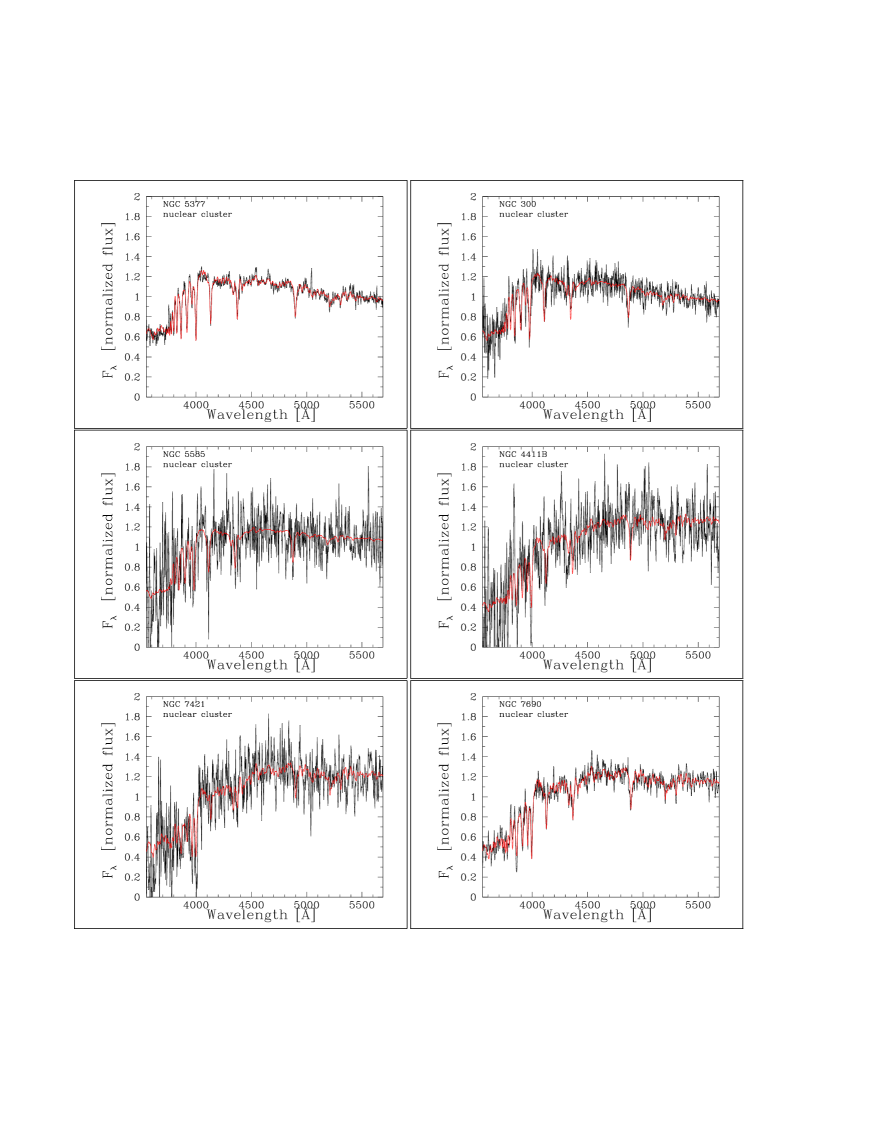
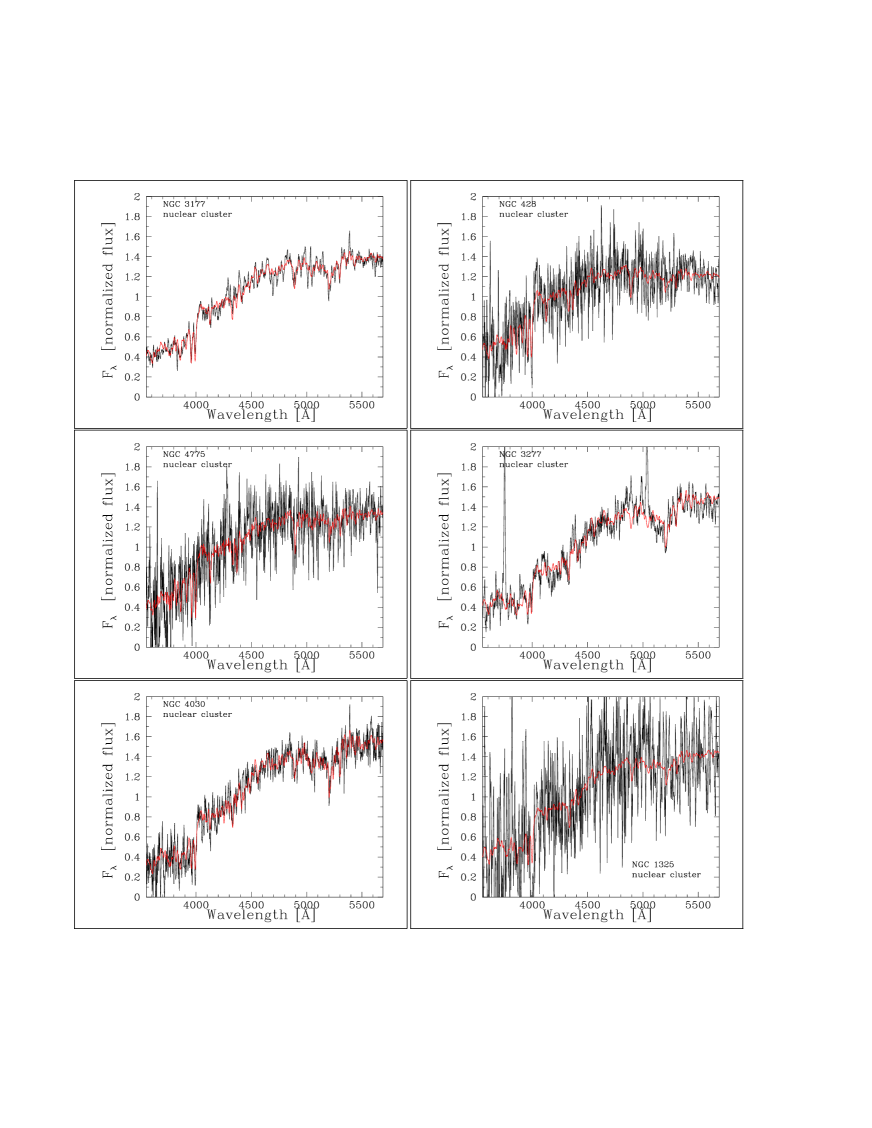
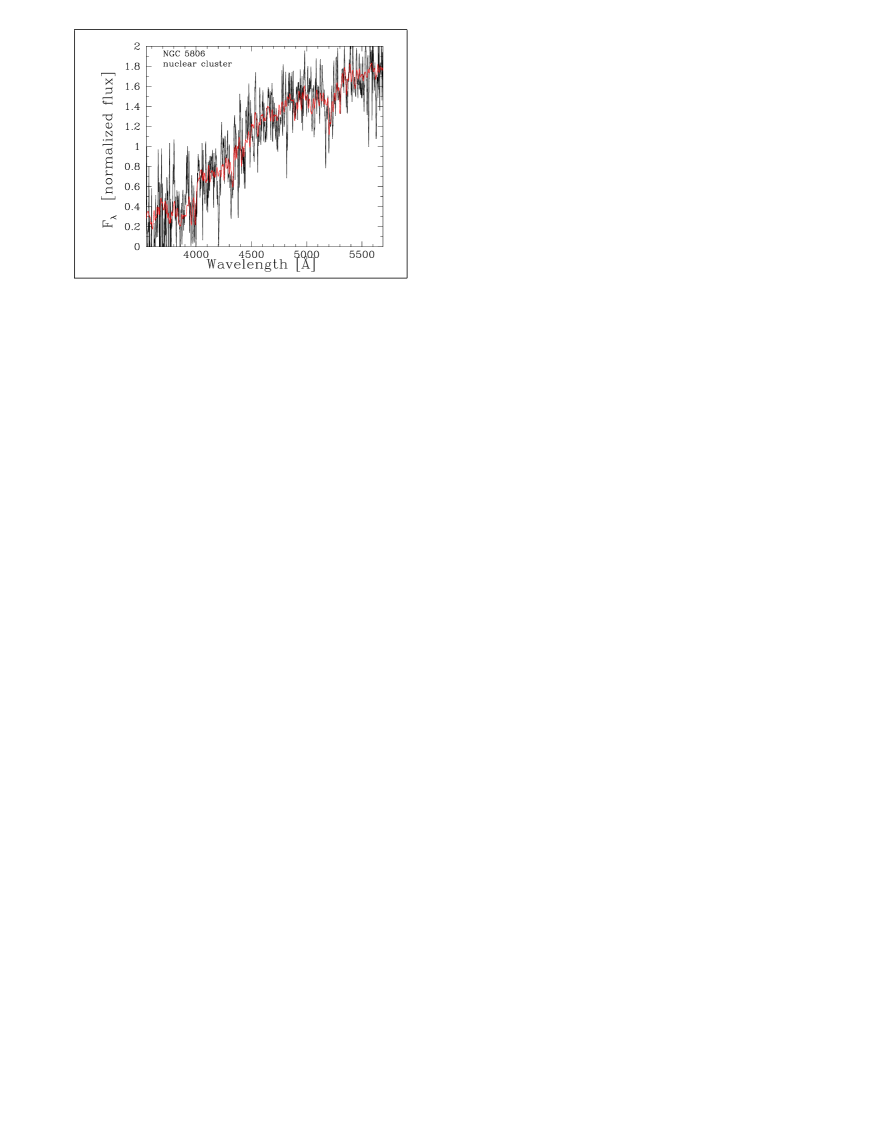


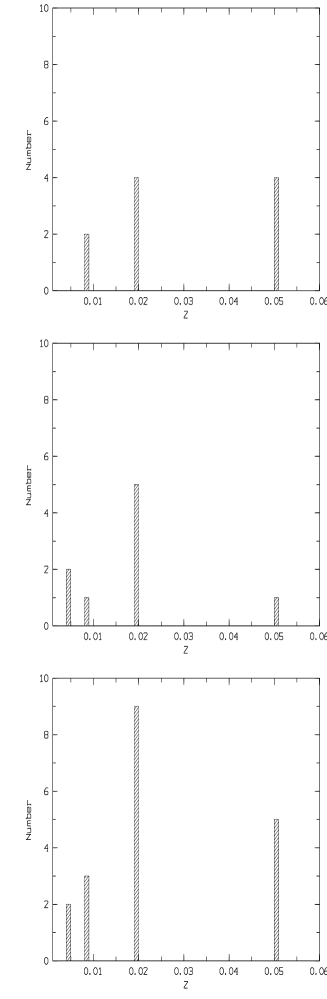
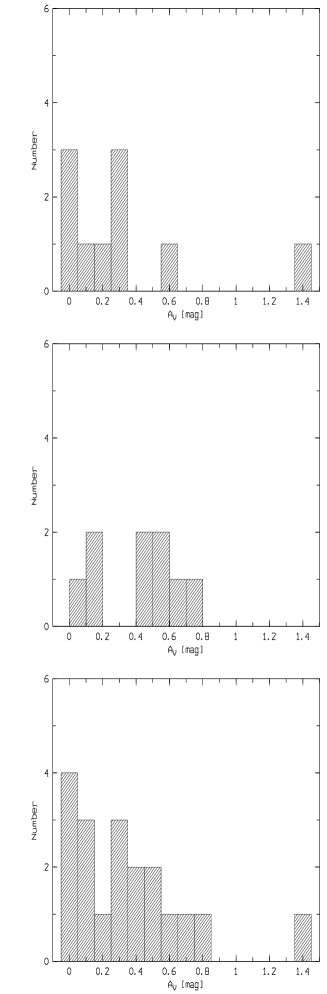
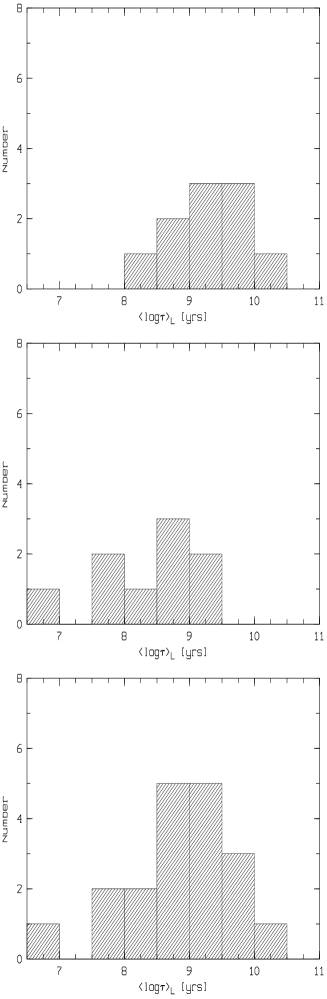

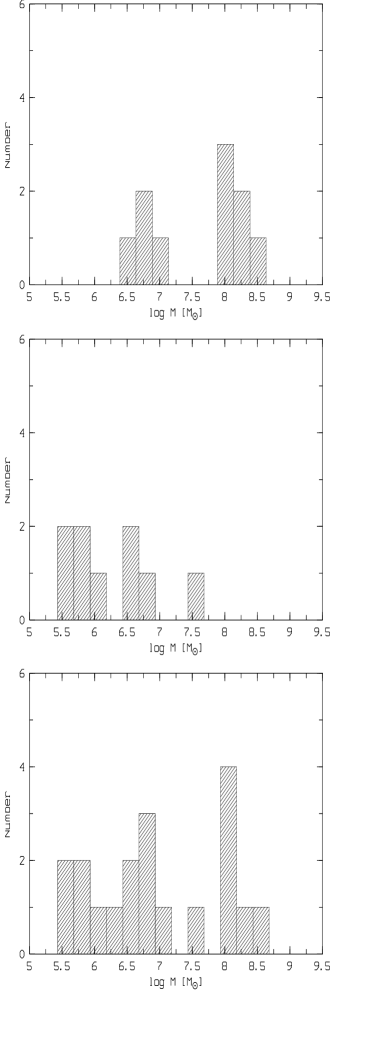

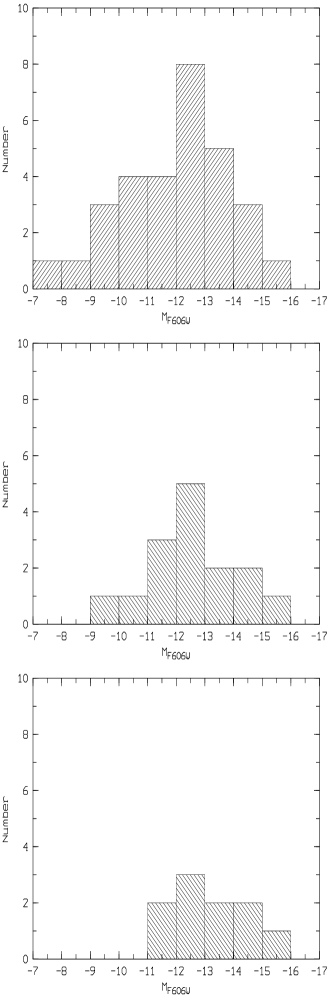
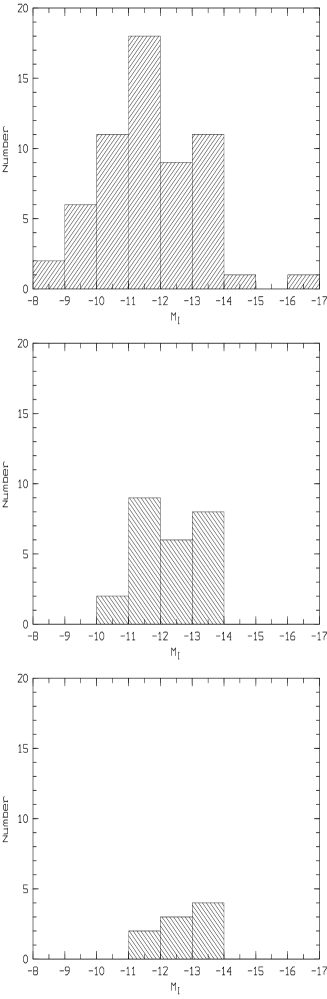
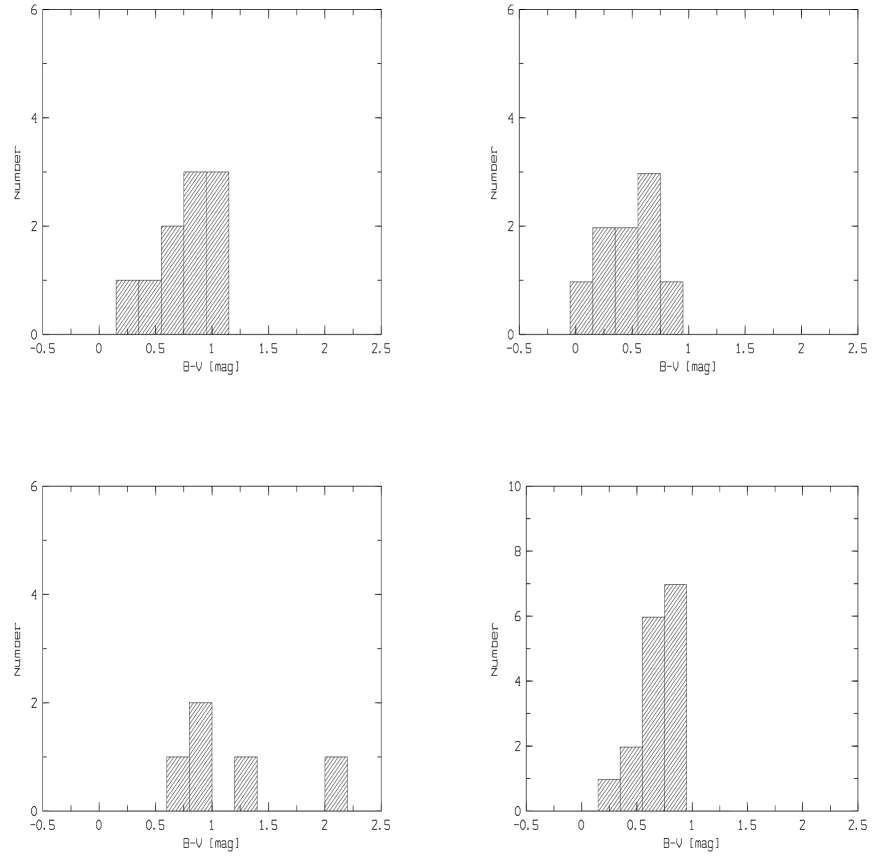


| Galaxy | R.A. | Dec. | Classification | T | |||||
|---|---|---|---|---|---|---|---|---|---|
| [hh mm ss.ss] | [dd°mm′sss] | [km s] | [Mpc] | [mag] | [mag] | [mag] | |||
| (1) | (2) | (3) | (4) | (5) | (6) | (7) | (8) | (9) | (10) |
| NGC 1325 | 03 24 25.20 | 21 32 32.8 | SA(s)bc | 4.2 | 1414 | 20.2 | 0.072 | 20.0 | 11.60 |
| NGC 1385 | 03 37 28.32 | 24 30 04.2 | SB(s)cd | 5.7 | 1305 | 18.6 | 0.067 | 19.0 | 12.41 |
| NGC 2082 | 05 41 51.21 | 64 18 04.0 | SAB(rs+)c | 3.2 | 942 | 13.5 | 0.192 | 20.9 | 09.94 |
| NGC 3177 | 10 16 34.21 | +21 07 24.8 | SA(rs)b | 3.0 | 1392 | 19.9 | 0.074 | 17.1 | 14.47 |
| NGC 3277 | 10 32 55.50 | +28 30 42.0 | SA(r)ab | 1.9 | 1539 | 22.0 | 0.088 | 17.2 | 14.60 |
| NGC 3455 | 10 54 31.07 | +17 17 06.2 | (R’)SAB(rs)b | 3.2 | 1185 | 16.9 | 0.110 | 20.1 | 11.15 |
| NGC 4030 | 12 00 23.65 | +01 06 03.3 | SA(s)bc | 4.1 | 1476 | 21.1 | 0.087 | 19.3 | 12.41 |
| NGC 4806 | 12 56 12.67 | 29 30 13.8 | SB(s)c? | 4.9 | 2350 | 33.6 | 0.285 | 20.8 | 12.12 |
| NGC 4980 | 13 09 10.24 | 28 38 30.8 | SAB(rs)a pec? | 1.0 | 1329 | 19.0 | 0.237 | 20.2 | 11.43 |
| NGC 5188 | 13 31 28.46 | 34 47 44.0 | (R’:)SAB(rs)b | 3.1 | 2301 | 32.9 | 0.173 | 19.2 | 13.56 |
| NGC 5377 | 13 56 16.79 | +47 14 17.2 | (R)SB(s)a | 1.1 | 2036 | 29.1 | 0.054 | 16.5 | 15.87 |
| NGC 5806 | 15 00 00.30 | +01 53 29.0 | SAB(s)b | 3.3 | 1440 | 20.6 | 0.169 | 18.6 | 13.14 |
| NGC 6384 | 17 32 24.30 | +07 03 38.0 | SAB(r)bc | 3.8 | 1780 | 25.4 | 0.409 | 19.6 | 12.83 |
| NGC 7421 | 22 56 54.00 | 37 20 51.0 | SB(r)bc | 4.0 | 1662 | 23.7 | 0.049 | 19.0 | 12.92 |
| NGC 7690 | 23 33 02.60 | 51 41 52.0 | Sb | 2.9 | 1281 | 18.3 | 0.035 | 18.0 | 13.35 |
Note. — Column (1) lists the galaxy name. Columns (2) and (3) list the right ascension and declination (J2000.0) from the NASA Extragalactic Database (NED). Column (4) lists the morphological classification given by NED and column (5) lists the Hubble T-type taken from the Lyon Extragalactic Database (LEDA). Much of the information in Columns (4)+(5) relies on the information given by the RC3 (de Vaucouleurs et al., 1991) as its primary source. Column (6) lists the systemic velocity corrected for Virgocentric infall using the model of Sandage & Tammann (1990), as taken from LEDA. Column (7) lists the corresponding distance for a Hubble constant . Column (8) lists the Galactic foreground extinction (Schlegel et al., 1998) in the -band for from NED. Column (9) lists observed apparent magnitude of the nuclear cluster in the WFPC2 F606W filter, as given by Carollo et al. (1998). Column (10) lists the corresponding absolute magnitude corrected for foreground extinction.
| Galaxy | R.A. | Dec. | Classification | T | |||||
|---|---|---|---|---|---|---|---|---|---|
| [hh mm ss.ss] | [dd°mm′sss] | [km s] | [Mpc] | [mag] | [mag] | [mag] | |||
| (1) | (2) | (3) | (4) | (5) | (6) | (7) | (8) | (9) | (10) |
| NGC 300 | 00 54 53.72 | 37 40 56.9 | SA(s)d | 6.9 | 54 | 2.2 | 0.025 | 15.29 | 11.43 |
| NGC 428 | 01 12 55.16 | +00 58 58.7 | SAB(s)m | 8.2 | 1130 | 16.1 | 0.055 | 17.94 | 13.15 |
| NGC 450 | 01 15 30.29 | 00 51 40.9 | SBc | 6.0 | 1720 | 24.6 | 0.077 | 20.07 | 11.96 |
| ESO 3585 | 03 27 16.47 | 29 06.1 | SAB(s)m pec: | 8.7 | 1409 | 20.1 | 0.022 | 20.09 | 11.45 |
| NGC 1493 | 03 57 27.73 | 46 12 38.1 | SB(rs)cd | 6.0 | 796 | 11.4 | 0.020 | 17.17 | 13.13 |
| NGC 2139 | 06 01 08.44 | 23 40 24.4 | SAB(rs)cd | 5.8 | 1649 | 23.6 | 0.065 | 19.09 | 12.83 |
| UGC 3574 | 06 53 10.57 | +57 10 44.6 | SA(s)cd | 5.9 | 1635 | 23.4 | 0.103 | 19.97 | 11.98 |
| NGC 2552 | 08 19 20.25 | +50 00 27.2 | SA(s)m? | 8.9 | 695 | 9.9 | 0.090 | 18.04 | 12.04 |
| NGC 2805 | 09 20 20.38 | +64 06 12.2 | SAB(rs)d | 7.0 | 1968 | 28.1 | 0.100 | 19.02 | 13.33 |
| NGC 3346 | 10 43 38.70 | +14 52 17.9 | SB(rs)cd | 5.9 | 1315 | 18.8 | 0.054 | 19.64 | 11.78 |
| NGC 3423 | 10 51 13.25 | +05 50 31.3 | SA(s)cd | 6.0 | 1025 | 14.6 | 0.058 | 19.03 | 11.85 |
| NGC 3445 | 10 54 35.87 | +56 59 24.4 | SAB(s)m | 8.7 | 2245 | 32.1 | 0.015 | 19.10 | 13.45 |
| A 1156+52 | 11 59 08.57 | +52 42 26.1 | SB(rs)cd | 6.0 | 1307 | 18.7 | 0.053 | 20.43 | 10.98 |
| NGC 4411B | 12 26 47.28 | +08 53 02.0 | SAB(s)cd | 5.9 | 1334 | 19.1 | 0.058 | 18.88 | 12.58 |
| NGC 4540 | 12 34 50.92 | +15 33 09.6 | SAB(rs)cd | 6.0 | 1383 | 19.8 | 0.065 | 19.25 | 12.29 |
| NGC 4618 | 12 41 32.50 | +41 09 03.0 | SB(rs)m | 8.4 | 748 | 10.7 | 0.041 | 18.73 | 11.46 |
| NGC 4625 | 12 41 52.95 | +41 16 26.8 | SAB(rs)m pec | 8.7 | 816 | 11.7 | 0.035 | 19.74 | 10.63 |
| NGC 4701 | 12 49 11.60 | +03 23 19.0 | SA(s)cd | 5.6 | 768 | 11.0 | 0.057 | 16.80 | 13.46 |
| NGC 4775 | 12 53 46.29 | 06 37 27.1 | SA(s)d | 6.8 | 1565 | 22.4 | 0.067 | 18.04 | 13.78 |
| NGC 5068 | 13 18 55.24 | 21 02 21.5 | SB(s)d | 6.2 | 607 | 8.7 | 0.197 | 17.54 | 12.34 |
| NGC 5585 | 14 19 47.90 | +56 43 46.0 | SAB(s)d | 6.9 | 571 | 8.2 | 0.030 | 18.24 | 11.35 |
| NGC 5668 | 14 33 24.89 | +04 27 01.7 | SA(s)d | 6.7 | 1665 | 23.8 | 0.071 | 18.85 | 13.10 |
| NGC 5964 | 15 37 36.33 | +05 58 28.2 | SB(rs)d | 6.7 | 1552 | 22.2 | 0.113 | 19.21 | 12.63 |
| NGC 6509 | 17 59 24.92 | +06 17 12.1 | SBcd | 7.0 | 1926 | 27.5 | 0.375 | 19.48 | 13.09 |
| UGC 12732 | 23 40 39.80 | +26 14 10.0 | Sm: | 8.8 | 870 | 12.4 | 0.172 | 19.35 | 11.29 |
Note. — Column (1) lists the galaxy name. The galaxy A 1156+52 is also known as UGC 6983. Columns (2) and (3) list the right ascension and declination (J2000.0) from NED. Column (4) lists the morphological classification given by NED, except for NGC 450 which was taken from LEDA. Column (5) lists the Hubble T-type taken from LEDA. Much of the information in Columns (4)+(5) relies on the information given by the RC3 (de Vaucouleurs et al., 1991) as its primary source. Column (6) lists the systemic velocity corrected for Virgocentric infall using the model of Sandage & Tammann (1990), as taken from LEDA. Column (7) lists the corresponding distance for a Hubble constant . The value for NGC 300 has been taken from Freedman et al. (1992). Column (8) lists the Galactic foreground extinction (Schlegel et al., 1998) in the -band using the Cardelli et al. (1989) extinction law and , from NED. Column (9) lists observed apparent magnitude of the nuclear cluster in the -band from Böker et al. (2004). Column (10) lists the corresponding absolute magnitude corrected for foreground extinction.