The First VERITAS Telescope
Abstract
The first atmospheric Cherenkov telescope of VERITAS (the Very Energetic Radiation Imaging Telescope Array System) has been in operation since February 2005. We present here a technical description of the instrument and a summary of its performance. The calibration methods are described, along with the results of Monte Carlo simulations of the telescope and comparisons between real and simulated data. The analysis of TeV -ray observations of the Crab Nebula, including the reconstructed energy spectrum, is shown to give results consistent with earlier measurements. The telescope is operating as expected and has met or exceeded all design specifications.
keywords:
gamma ray astronomy , Cherenkov telescopesPACS:
95.55.Ka ,1 Introduction
The first detection of Cherenkov light produced by cosmic ray air showers in the atmosphere was made over half a century ago [1]. The detection method remains essentially unchanged today; relatively crude mirrors are used to reflect Cherenkov photons onto a photomultiplier tube (PMT) detector package, and fast electronics discriminate the brief (few nanoseconds) Cherenkov flashes from the background night-sky light. The first successful application of this technique to -ray astronomy was realised by the Whipple Collaboration, who used a diameter light collector and an array of PMTs to record images of the angular distribution of Cherenkov light produced by air showers [2]. The shape and orientation of the images were used to efficiently select -ray initiated air shower candidate events from among the otherwise overwhelming background of cosmic ray initiated events [3]. The Whipple 10 telescope provided the first detection of an astrophysical -ray source, the Crab Nebula, using this imaging technique [4]. Arrays of imaging atmospheric Cherenkov telescopes provide a further increase in sensitivity and in angular and energy resolution, as demonstrated by the HEGRA experiment [5]. The stereoscopic imaging atmospheric Cherenkov technique is now being exploited using large reflectors by four projects worldwide; MAGIC [6] and VERITAS [7] in the Northern hemisphere and HESS [8] and CANGAROO III [9] in the South. HESS was the first of these to come online and recent observations have produced a wealth of new discoveries [10].
The first stage of the VERITAS project will use four telescopes at a site in Arizona. Each telescope will consist of a diameter segmented reflector instrumented with a 499 element PMT imaging camera. The first of these telescopes has been installed at the base camp of the Whipple Observatory at Mt. Hopkins (at an altitude of ) and saw first light in February 2005. We begin by describing the various elements of the detector and assess their technical performance. The calibration and data analysis procedures are then discussed, and the overall performance of the instrument is characterised using Monte Carlo simulations and the results from preliminary observations of TeV -ray sources.
2 The Telescope
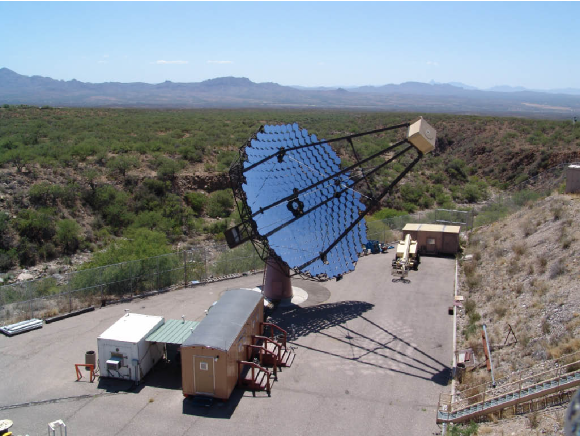
Figure 1 shows the first complete VERITAS telescope installed at the Whipple Observatory base camp. The building closest to the telescope contains the trigger and data acquisition electronics and is the control room from which the telescope is operated. The telescope was operated initially in 2004 as a prototype, with one third of the mirror area and half of the PMTs of the completed telescope [11].
2.1 Mechanics and Tracking
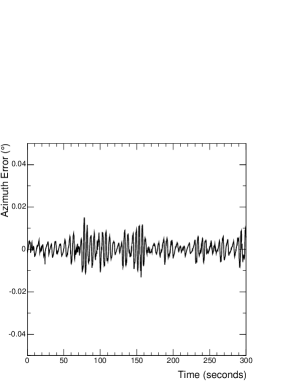
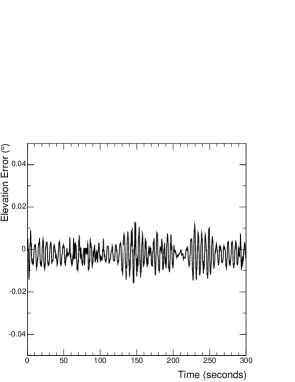
The basic mechanical structure of the telescope is similar to that of the Whipple telescope, consisting of an altitude-over-azimuth positioner and a tubular steel Optical Support Structure (OSS). The camera is supported on a quadropod, and a mechanical bypass of the upper quadropod arm transfers this load directly to the counterweight support. The positioner is a commercial unit manufactured by RPM-PSI (Northridge, California); the OSS is a steel space frame, custom designed by M3 engineering (Tucson, Arizona) and fabricated by Amber Steel (Chandler, Arizona) [12]. The maximum slew speed is measured to be . Tests with a modified drive system have proved that it is possible to reach maximum slew speeds of ; the first telescope will shortly be upgraded and the remaining VERITAS telescopes will have this modification installed as standard. The telescope encoder measurements are written to a database at a rate of and indicate that the tracking is stable with a relative raw mechanical pointing accuracy of typically (Figure 2). Various methods for measuring and improving the absolute pointing accuracy are under investigation.
2.2 Optics
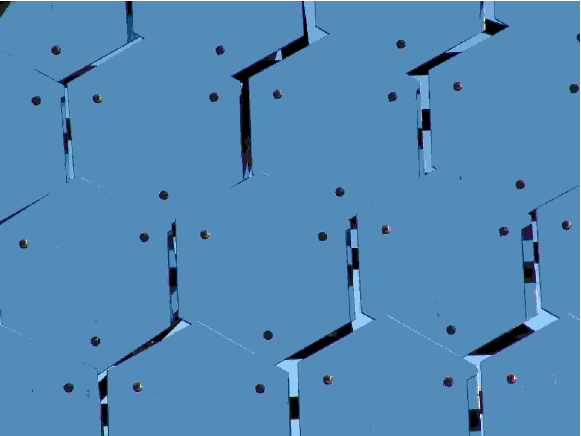
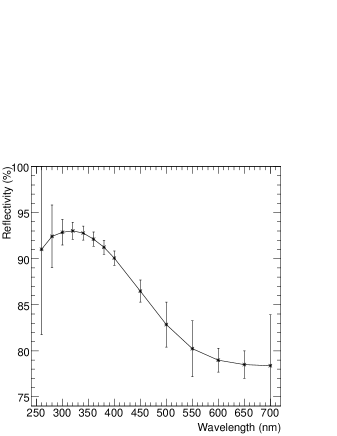
The telescope optics follows a Davies-Cotton design [13], but with a aperture reflector and a focal length. The reflector comprises 350 hexagonal mirror facets (Figure 3), each with an area of , giving a total mirror area of . The use of hexagonal facets allows the full area of the OSS to be exploited. The facets are made from glass, slumped and polished by DOTI (Roundrock, Texas), then cleaned, aluminized and anodized at the VERITAS optical coating laboratory. The reflectivity of the anodized coating at normal incidence is shown as a function of wavelength in Figure 4; it is typically at . Each facet has a radius of curvature and is mounted on the spherical front surface of the OSS (radius ) using a triangular frame. Three adjustment screws allow each facet to be accurately aligned.
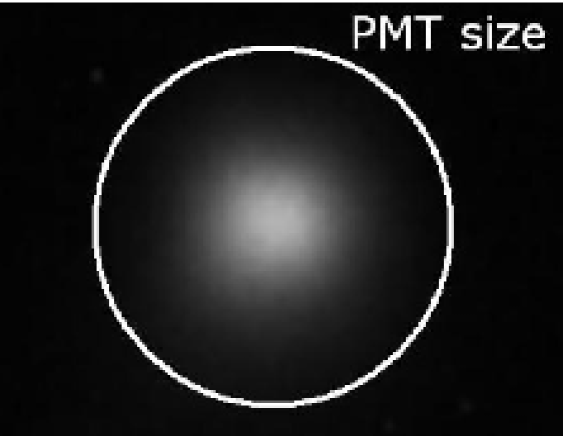
The reflector facets are aligned manually using a laser system installed at a point facing the centre of the reflector at a distance of twice the focal length (). An initial alignment of the mirror facets resulted in a point spread function (PSF) of FWHM. The -ray observations reported on in this paper were made under this alignment condition. A subsequent realignment reduced the PSF to (Figure 5) at the position of Polaris (elevation ), degrading at higher elevations due to flexure of the OSS. The technique of bias alignment, wherein the mirror facets are aligned such that the PSF is optimum over the most useful observing range, has been successfully employed on the Whipple telescope in the past and will be applied to the VERITAS telescopes to achieve a PSF of FWHM over the elevation range.
2.3 Camera
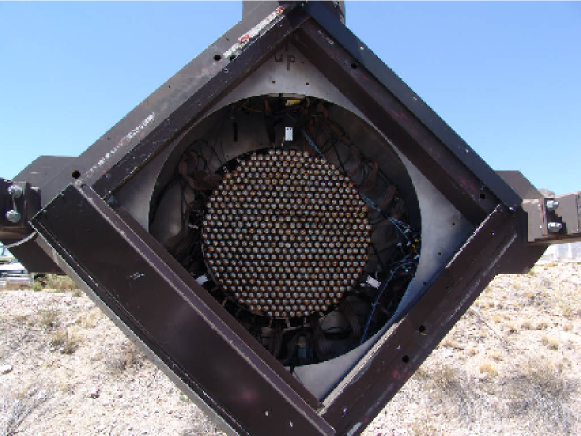
Figure 6 shows the front face of the telescope focus box. The box is square and allows for future expansion to increase the camera field-of-view. The imaging camera’s 499 pixels are Photonis diameter, UV sensitive PMTs (model XP2970/02), with a quantum efficiency at . The angular pixel spacing is , giving a total field-of-view of diameter . Light cones have not yet been installed; two different designs are being fabricated and will be tested. They are expected to significantly improve the total photon collection efficiency as well as to reduce the rate of off-axis background photons in each PMT.
The PMT high voltage is provided by a multichannel modular commercial power supply (CAEN) which allows each PMT to be controlled individually. The high voltage is chosen to give a PMT gain of . The signals are amplified by a high-bandwidth pre-amplifier integrated into the PMT base mounts. This circuit also allows the PMT anode currents to be monitored and calibrated charge pulses to be injected into the signal chain. Average currents are typically (for dark fields) to (for bright fields), corresponding to a night-sky photoelectron background of 100-200 per PMT at this site. Signals are sent via of stranded cable (RG59) to the telescope trigger and data acquisition electronics which is housed in the control room.
2.4 Trigger
In an imaging atmospheric Cherenkov telescope, precise timing between trigger channels is desirable in order to reduce the coincidence resolving time and hence lower the detector energy threshold. To achieve this, each channel is equipped with a custom-designed constant fraction discriminator (CFD) [14] which has a trigger time which is independent of the input pulse height. The CFD output width is programmable in 12 steps between 4 and ; a width of was used as standard for telescope operations in 2005. A 3-bit, programmable delay is provided for each channel so as to correct for systematic differences in the relative signal paths due to cable length differences and the voltage-dependent PMT transit times.
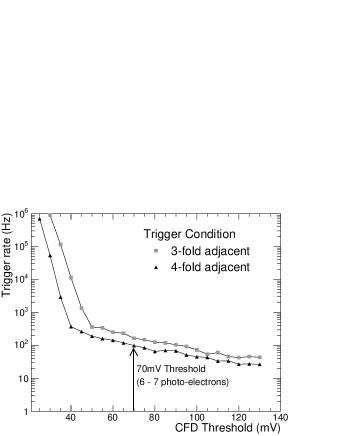
The CFD signals are copied and sent to a topological trigger system which is similar to that used successfully on the Whipple telescope [15], but with an improved channel-to-channel timing jitter of . The system contains a memory look-up which can be pre-programmed in a few minutes to recognise patterns of triggered pixels in the camera; for example, any 3 adjacent pixels. The required overlap time between adjacent CFD signals is . The topological trigger system reduces the rate of triggers due to random fluctuations of the night-sky background light and preferentially selects compact Cherenkov light images. Figure 7 shows the trigger rate as a function of CFD threshold for two different topological trigger configurations. Observations in 2005 were all made with a rather conservative CFD threshold corresponding to photoelectrons and a 3-fold adjacent pixel topological trigger configuration, giving a cosmic ray trigger rate at high elevation of .
VERITAS will also include an array level trigger system which triggers the data acquisition on coincident events over a pre-defined number of telescopes. A preliminary array level trigger is installed on the first VERITAS telescope which is used to latch the event number and GPS time for each event.
2.5 Data Acquisition
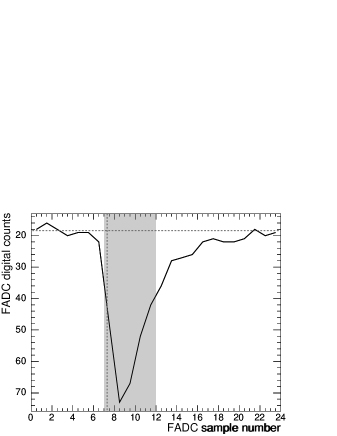
The centrepiece of the data acquisition chain is a custom-built flash-ADC system [16]. Each PMT signal is digitized with an 8-bit dynamic range and a memory depth of . By default, the signal traces follow a high gain path to the FADC. If the dynamic range is exceeded, an analog switch connects the FADC chip to a delayed low gain path instead, thus extending the dynamic range for each sample. The electronic noise is small, with a sample-to-sample standard deviation of and an event-to-event standard deviation over a 10 sample integration window of Figure 8 shows a typical FADC trace in a signal channel.
The FADCs are deployed in four custom VME crates, where they are read out by local single board computers (VMIC). Buffered events from the single board computers are transferred via a Scaleable Coherent Interface to an event-building computer, where they are integrated, tested, and passed on to the online analysis system and data harvester. The FADC readout window size and position are programmable; a 24 sample readout on all 500 channels results in a data size of per event and a deadtime of at . While this is manageable for a single telescope, the VERITAS array will produce four times as much data at higher rates (up to ). To cope with this, a zero suppression scheme has been implemented wherein only those channels with a peak signal larger than some preset value are read out, reducing the data size by a factor of . The CFDs are integrated onto the FADC boards and the CFD hit pattern and the rate of single channel triggers can also be read out to the data stream.
The FADCs give two principal benefits over simple charge integrating ADCs. They allow the application of digital signal processing techniques, for example, actively placing and minimizing the charge integration gate, thus improving the signal/noise per PMT and lowering the effective energy threshold in the analysis. In addition, they provide measurements of the time distribution of the Cherenkov photons across the image, which may help to reject the hadronic cosmic ray background showers and improve the accuracy of -ray shower parameter reconstruction [17].
3 Calibration
The telescope calibration is divided into two sections. Absolute calibration is concerned with understanding the signal size produced by a single photon such that detector response and the energy scale can be accurately modelled in Monte Carlo simulations. Relative calibration involves measuring the various calibration constants for each signal channel so as to flat-field the response of the camera in the data analysis.
3.1 Absolute Calibration
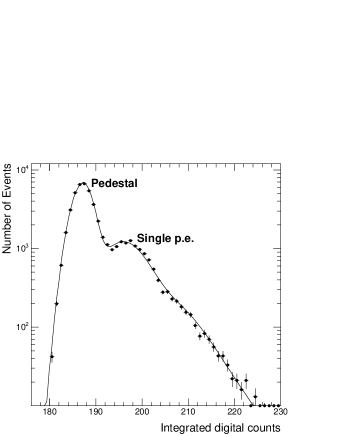
The overall photon conversion factor of the telescope is a combination of the mirror reflectivity, the collection efficiency and quantum efficiency of the PMT photocathode, and the conversion factor of the electronics chain. The mirror reflectivity and PMT photocathode characteristics can be determined from laboratory measurements and manufacturer’s specifications; the conversion factor of the electronics chain is defined as the average integral number of FADC counts produced by the generation of a single photoelectron in the PMTs and measured in situ. A nitrogen laser is used to deliver a wide pulse to a dye module which fluoresces at . This light is passed via optical fibre to an opal glass diffuser situated in front of the camera at a distance of , so as to provide uniform illumination [18]. The camera face is covered by a semi-reflective mylar sheet which shields the PMTs from background light, and the laser pulse intensity is adjusted using filters to provide an average illumination of per PMT. A delayed copy of the laser trigger is used to trigger the data acquisition such that the signal arrives centered in the readout window. Figure 9 shows the histogram of the integrated FADC counts for a single PMT at standard operating gain. The conversion factor averaged over all PMTs is photoelectrons per digital count.
Two complementary methods have been used to confirm the overall photon collection efficiency of the telescope. Single muons within the field-of-view produce sharply defined ring images, and the expected amount of Cherenkov light per unit arc length can be accurately calculated, providing a well calibrated natural “test beam” [19]. A comparison of the total charge in simulated muons and in real muons selected from data taken with the first VERITAS telescope indicates that the total photon collection efficiency is well matched [20]. A novel alternative approach to absolute calibration, borrowed from atmospheric fluorescence detectors of ultra-high energy cosmic rays [21], has also been tested. A calibrated laser pulse directed towards the zenith is used to produce a flash of Rayleigh-scattered light with an intensity that can be calculated very accurately when atmospheric conditions are good. Preliminary results with this method again indicate good agreement between simulations and data [22].
3.2 Relative Calibration
Prior to the parameterization of Cherenkov images in the camera, each signal channel must be calibrated. A pulse generator is used to trigger the data acquisition at a rate of during the data-taking in order to generate events with no Cherenkov light present. A histogram is constructed of the integrated number of digital counts in each FADC trace (for a given integration window size); the mean of this histogram is the electronic pedestal value and the width is the pedestal standard deviation, which provides a measure of the night sky background noise level. Pedestal and pedestal standard deviation values are currently calculated once per 28 minute data run. The same laser system as used for the single photoelectron calibration is used once per night to provide bright, uniform, time-coincident photon pulses across the camera. The mean of a histogram of the integrated signal in each FADC trace over these events measures the relative gain of the signal channels. Similarly, a histogram of the arrival time of the laser pulse in each trace measures the relative time offsets for each channel. Relative PMT gains are set to within by adjusting the PMT high voltages. Approximately 95% of the signal channels show a relative time offset of less than ; this is compensated for in the trigger hardware as discussed in Section 2.4.
4 Data Analysis and Results
Development work to define the optimum data analysis methods for this new instrument is ongoing. The data products, in particular the FADC information, provide the opportunity of exploiting many techniques which have not been applicable to previous generations of Cherenkov telescopes; for example, the use of digital signal processing algorithms to parameterise the signal traces, and the added dimension of detailed image timing information. The analysis described here is based on that which has been successfully employed for the analysis of Whipple telescope data for many years, with the use of image timing information being restricted to helping to define the optimum signal integration window.
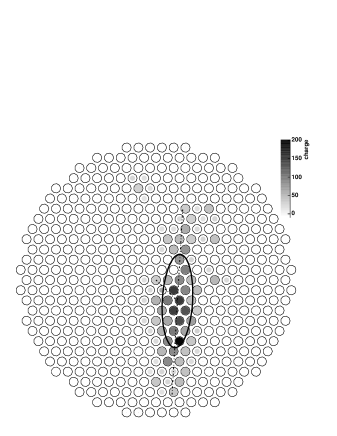
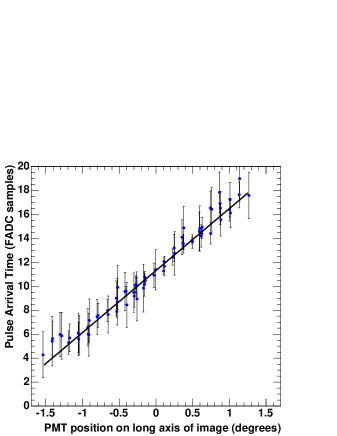
We have used a two-pass method in this analysis. In the first pass, a wide () integration gate is applied to each FADC trace at a fixed time position in order to calculate the integrated charge and the pulse arrival time, (defined as the half-height point on the pulse leading edge). PMTs are selected which produce an integrated signal greater than times their pedestal standard deviation, or greater than times the pedestal standard deviation while also being adjacent to a PMT selected at the higher threshold. The resulting shower image is then parameterised with a second moment analysis, the results of which can be described by an ellipse as shown in Figure 10 [3]. Figure 11 shows as a function of PMT position along the long axis of the ellipse for this event; the time gradient across the image is given by a straight line fit to this graph. In the second pass over the image, a shorter () integration window is applied to each trace, but the location of the window is calculated using the expected position of the pulse according to the measured time gradient across the image.
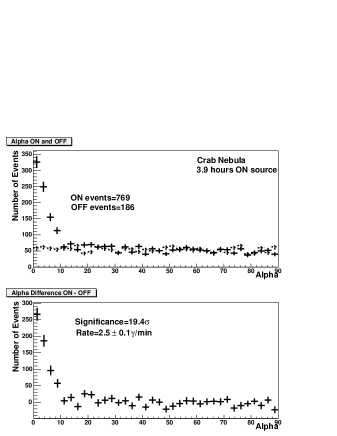
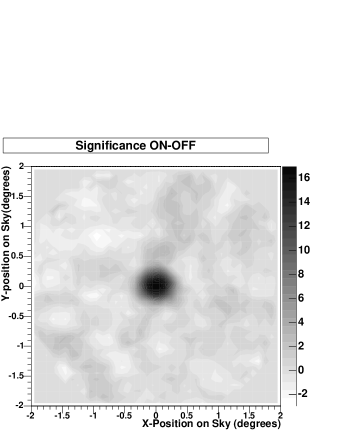
The standard candle of ground-based -ray astronomy is the Crab Nebula, and the sensitivity of any new instrument is best tested against this benchmark. The first VERITAS telescope saw first light in February 2005, leaving only a small time window in which to collect data on the Crab while the source was still observable at high elevations. Observations were taken in an ON/OFF mode, wherein a 28 minute ON exposure at the source position is followed or preceded by a 28 minute OFF-source exposure, at the same elevation but offset by minutes in right ascension. The total ON-source exposure was with the same amount of OFF-source data collected in order to provide a measure of the cosmic ray background. Due to the purely electromagnetic nature of -ray initiated air showers, -ray Cherenkov images are expected to be more compact than cosmic ray images and can be preferentially selected by applying cuts based on the dimensions of the event ellipse (, ) [3]. The parameter describes the orientation of the long axis of the image ellipse relative to the line joining the centre of the field-of-view and the ellipse centroid. Showers originating from a point source, such as the Crab Nebula, will be oriented with their long axes pointing back to the position of the source at the centre of the camera. The angular of the image from from the source position is related to the distance of the shower core position on the ground. Finally, the ratio of the image to its total (where is the integrated charge over all PMT signals in the image) is used to discriminate -rays from the otherwise overwhelming background of local muons which generate short arcs in the camera with a constant size per unit arc length. Cuts on these various parameters were optimised using a data set of observations of the variable TeV blazar Markarian 421 when this source was known, from contemporaneous observations with the Whipple 10m telescope, to be in a high emission state. The resulting histogram for the Crab Nebula observations is shown in Figure 12. The excess at low corresponds to a significance of (where refers to one standard deviation above the background), indicating a sensitivity of for one hour of ON-source observations. Figure 13 shows the significance map of the reconstructed source position using the method of Lessard et al. [23].
Following the Crab Nebula observations, the telescope was used in an observing campaign throughout 2005, complementary to that of the Whipple 10 m telescope, which resulted in detections of the known -ray sources Markarian 421 and Markarian 501 [24] and data sets on various potential TeV sources. A full online analysis package has been developed and was successfully used to detect strong -ray flaring behaviour from Markarian 421 on a timescale of minutes.
5 Simulations
5.1 The Simulation Chain
In order to accurately calculate source fluxes and energy spectra, it is necessary to develop a detailed model of the telescope performance, to which simulated air showers are presented such that the telescope detection efficiencies can be calculated. A complete chain of Monte Carlo simulations has been developed [25]. It consists of air shower simulations with CORSIKA [26] and a detailed simulation of the telescope response (GrISU [27]). CORSIKA version 6.20 is used with the hadronic interaction models QGSJet for primary energies above and with FLUKA for primary energies below . Simulated hydrogen, helium, and oxygen nuclei-induced air showers were produced in an energy range from ( for oxygen) to for various telescope elevation angles. Spectral indices were taken from fits to balloon measurements [28]. The shower cores were chosen to be distributed randomly within a circle of radius centred on the telescope and the isotropic distribution of the cosmic ray incidence angles was simulated by randomizing the shower directions in a cone of radius 3.5∘ around the pointing direction of the telescope (while showers from outside of this cone angle can trigger the telescope, we estimate the fraction to be no more than 5% of the total). Primary -rays were simulated with a Crab-like spectrum () in an energy range from to on a circular area at the ground with radius .
Measurements of the atmospheric properties at the site of the first VERITAS telescope are currently in progress. The calculations described here used the U.S. standard atmosphere, which does not always reflect the properties of the atmosphere in Southern Arizona. Atmospheric extinction values were estimated using MODTRAN 4 [29] assuming visibility at at ground level. The photoelectron rate per PMT is measured to be 100-, corresponding to a night sky background rate of photons m-2 s-1 sr-1, which was used in the simulations and produced a simulated pedestal standard deviation of a similar level to that observed in the data.
The telescope simulations consist of two parts, the propagation of Cherenkov photons through the optical system and the response of the camera and electronics. The geometrical properties of the optical system are fully implemented in the simulation, including allowance for the surface roughness of mirror facets and for random scatter in their alignment. The camera configuration corresponds to that of April 2005, i.e. a 499 pixel camera with diameter phototubes without light cones, with a total field-of-view of 3.5∘. The absolute gain calibration has been described in Section 3.1. In order to estimate the exact pulse shape to be used in the simulations, we examined pulses in the data produced by muon events and laser flashes, both of which are light sources with a time profile which is expected to be shorter than the bandwidth of the electronics. The resulting average single photoelectron pulse has a rise time of and a width of . Cherenkov photons hitting a PMT produce a single photoelectron pulse with appropriate amplitude and time jitters applied. Electronic noise and all efficiencies, including mirror reflectivities, geometrical, quantum, and collection efficiencies, and losses due to signal transmission were modeled. The pulses are digitized into samples with a trace length of 24 samples reflecting the properties of the FADC system. The trigger simulation uses a simplified model of the constant fraction discriminator, which is the first stage of the VERITAS multi-level trigger, and a full realization of the pattern trigger, requiring three adjacent pixels above threshold in a time window of 6 ns. The currently used trigger threshold of 70 mV corresponds to about 6.7 photoelectrons. The output of the telescope simulations, i.e. FADC traces for all PMTs, are written to disk in the VERITAS raw data format.
5.2 Raw Trigger Rate
The raw trigger rate of the telescope with trigger conditions as described above is at high elevation. Dead time losses due to readout are 10%, the corrected trigger rate is consequentially 160 Hz. The simulation of the cosmic ray background results in trigger rates of 101 Hz from air showers induced by protons, 26 Hz from helium nuclei, and 5 Hz from nuclei of the CNO group for an elevation of 70∘. The Monte Carlo calculations reproduce the observed trigger rate with an accuracy of 20%, which is acceptable, taking into account an estimated uncertainty in the cosmic ray fluxes of 25% and various systematic uncertainties in the modeling of the telescope and the atmosphere.
5.3 Comparison with Real Data
Simulations and real data were analysed in the same way. The analysis method used was a simpler, single-pass version of the analysis described in Section 4, which has a slightly reduced sensitivity. -ray candidates were extracted from observations of the Crab Nebula (3.9 hours ON-source) and Markarian 421 (4.2 hours ON-source) in March and April 2005. All data were taken in ON/OFF mode at elevations above 60∘ and in good weather conditions. The -ray selection cuts result in a combined significance of 21.7 and 900 -ray candidates for the combined observations of the Crab Nebula and Mrk 421. The measured -ray rate from the observations of the Crab Nebula alone is . Using the Crab spectrum reported in Hillas et al. [31] results in a simulated -ray rate from the Crab Nebula of .
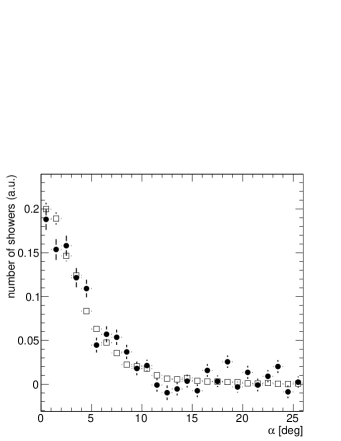
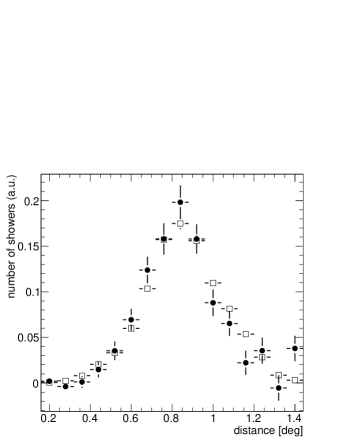
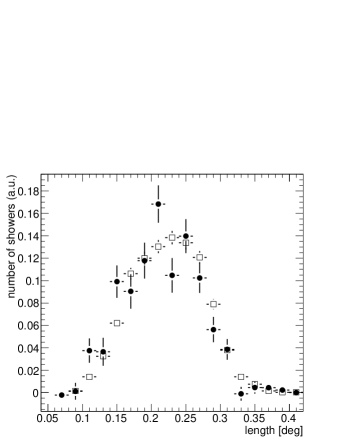
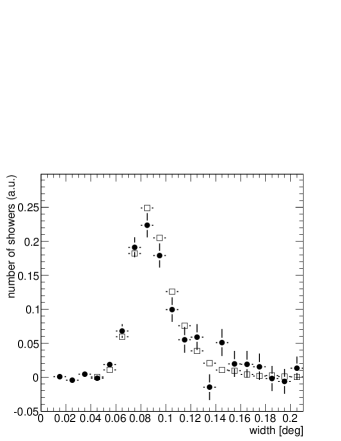
Ideally, the best image parameter cuts can be derived from the Monte Carlo simulations, which provide a data set of pure rays with high statistics. Simulations also provide the only method by which to estimate the primary energy of the incident rays. For the simulations to be useful, it is necessary to verify that the simulated images are an accurate representation of the data. Figure 14 shows the distributions of the image parameters , , and for simulated rays and for the -ray excess observed in the real data. The agreement is good, indicating that the simulations are valid.
5.4 Crab Nebula Energy Spectrum
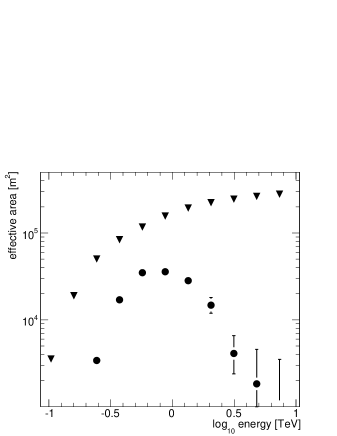
The effective area of Telescope 1 after cuts is shown in Figure 15. The filled circles show the effective area for the hard -ray selection cuts described above which reject most of the high energy events due to the cut on . This is a problem which is well known from our experience with the Whipple 10m telescope, and is solved by using -dependent -ray cuts [30], which do not provide the same level of background rejection, but which take the dependence of the image parameters on primary energy into account and retain of the -ray signal.
The maximum effective area after -dependent cuts is m2. The energy threshold of a Cherenkov telescope is conventionally defined as the position of the peak of the energy spectrum of the source convolved with the effective area curve of the detector. According to this definition, the threshold is 150 GeV at trigger level, 160 GeV after applying -dependent cuts, and 370 GeV after applying the hard cuts described earlier.
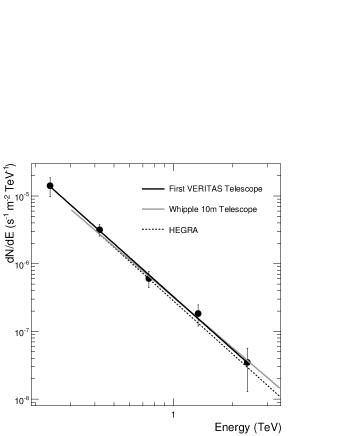
In order to reconstruct the energy spectrum of rays from the Crab Nebula we have used the method outlined in Mohanty et al [30]. -dependent cuts are applied to the data, and the primary energy of the resulting -ray excess events is estimated using a function which depends on the image and ; the exact form of the function is derived from the Monte Carlo simulations. Figure 16 shows the resulting reconstructed energy spectrum of the Crab Nebula. A power-law fit to the data points gives a spectral index of and a differential flux at of m-2s-1TeV-1 (statistical errors only). This agrees well with earlier measurements by other telescopes [31, 32].
6 Discussion
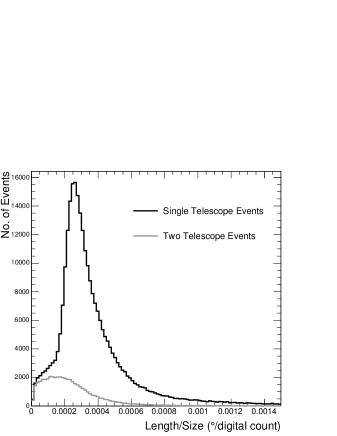
The first VERITAS telescope was operated throughout 2005, has met all technical specifications and has detected a number of TeV -ray sources. The sensitivity, at for one hour of ON-source observations of the Crab Nebula, is already appreciably better than the Whipple telescope (at for one hour of Crab observations); however, in order to provide the level of sensitivity required from this generation of detectors, it is necessary to reject the muon background at the hardware level. This can only be achieved by the installation of further telescopes. The major mechanical components of all four telescopes have now been delivered to the Mt. Hopkins base camp. The second VERITAS telescope has recently been installed away from the first telescope on an East-West baseline. Figure 17 shows the / histogram for the first telescope for all events which trigger, and for those which generate a trigger in both telescopes within of each other. The distinctive peak due to local muon events in the histogram of all events is clearly removed when the two-telescope trigger is imposed. A true “hardware” two-telescope trigger is currently being installed, which will correct for changing time delays due to the source movement in the sky, and reduce the required coincidence time to or less. Only events which satisfy the two-telescope trigger will be read out by the data acquisition system, reducing the data rate dramatically and so enabling us to lower the individual telescope trigger thresholds, and hence the energy threshold of the experiment. The angular resolution for point source analysis with a single telescope is (Figure 13); additional telescopes will provide multiple views of each shower, reducing the angular resolution by around a factor of two.
The agreement of the Monte Carlo simulations with observational data illustrated here shows that we have a good understanding of the first VERITAS telescope and that the design performance is being met. This being the case, the predicted behaviour of the four-telescope array system is likely to be reliable, indicating a flux sensitivity of at for a 50 hour exposure [33].
7 Acknowledgments
This research is supported by grants from the U.S. Department of Energy, the U.S. National Science Foundation, the Smithsonian Institution, by NSERC in Canada, by Science Foundation Ireland and by PPARC in the UK.
References
- [1] Galbraith, W., & Jelley, J.V., Nature, 171 (1953) 349
- [2] Weekes, T.C. & Turver, K.E., Proc. 12th ESLAB Symp., Frascati, (1977) 279
- [3] Hillas, A.M. Proc. 19th ICRC, 3 (1985) 445
- [4] Weekes, T. C., et al. ApJ, 342 (1989) 379
- [5] Pühlhofer, G. et al. Astropart. Phys., 20 (2003) 267
- [6] Lorenz, E. et al. New Astron. Rev., 48 (2004) 339
- [7] Weekes, T.C. et al. Astropart. Phys., 17 (2002) 221
- [8] Hinton, J.A. et al. New Astron. Rev., 48 (2004) 331
- [9] Kubo, H. et al. New Astron. Rev., 48 (2004) 323
- [10] Aharonian, F. et al. Science, 307 (2005) 1938
- [11] Wakely, S.P. et al. Proc. 28th ICRC, Tsukuba, Editors: T. Kajita, Y. Asaoka, A. Kawachi, Y. Matsubara and M. Sasaki, (2003) 2803
- [12] Gibbs, K. et al. Proc. 28th ICRC, Tsukuba, Editors: T. Kajita, Y. Asaoka, A. Kawachi, Y. Matsubara and M. Sasaki, (2003) 2823
- [13] Davies, J.M. & Cotton, E.S. Journal of Solar Energy, 1 (1957) 16
- [14] Hall, J. et al. Proc. 28th ICRC, Tsukuba, Editors: T. Kajita, Y. Asaoka, A. Kawachi, Y. Matsubara and M. Sasaki, (2003) 2851
- [15] Bradbury, S.M. & Rose, H.J. Nucl. Instr. & Meth. A, 481 (2002) 521
- [16] Buckley, J.H. et al. Proc. 28th ICRC, Tsukuba, Editors: T. Kajita, Y. Asaoka, A. Kawachi, Y. Matsubara and M. Sasaki, (2003) 2827
- [17] Holder, J. et al. Proc. 29th ICRC, Pune, (2005) in press.
- [18] Hanna, D. & Mukherjee, R. NIM A, 482 (202) 271
- [19] Vacanti, G. et al. Astropart. Phys., 2 (1994) 1
- [20] Humensky, T.B. et al. Proc. 29th ICRC, Pune, (2005) in press.
- [21] Roberts, M.D. et al. Auger GAP note, GAP-2003-010 (2003), http://www.auger.org
- [22] Shepherd, N. et al. Proc. 29th ICRC, Pune, (2005) in press.
- [23] Lessard, R. et al. Astropart. Phys, 15 (2001) 1
- [24] Cogan, P. et al. Proc. 29th ICRC, Pune, (2005) in press.
- [25] Maier, G. et al. Proc. 29th ICRC, Pune, (2005) in press.
- [26] Heck, D. et al., Report FZKA 6019, Forschungszentrum Karlsruhe (1998)
- [27] Duke, C. & LeBohec, S. http://www.physics.utah.edu/gammaray/GrISU/
- [28] Hörandel, J. Astropart. Phys, 19 (2003) 193
- [29] Kneizys et al. The Modtran 2/3 report and lowtran 7 model, Technical Report, Ontar Corporation (1996)
- [30] Mohanty, G. et al., Astropart. Phys, 9 (1998) 15
- [31] Hillas, A.M. et al., Ap. J., 503 (1998) 744
- [32] Aharonian, F. et al., Ap. J., 614 (2004) 897
- [33] Fegan, S. et al. Proc. 28th ICRC, Tsukuba, Editors: T. Kajita, Y. Asaoka, A. Kawachi, Y. Matsubara and M. Sasaki, (2003) 2847
|
 |
 |