The VIMOS-VLT Deep Survey††thanks: Based on data obtained with
the European Southern Observatory on Paranal, Chile.
Galaxy luminosity function per morphological type up to
We have computed the evolution of the rest-frame -band luminosity function (LF) for bulge and disk-dominated galaxies since . We use a sample of 605 spectroscopic redshifts with in the Chandra Deep Field South from the VIMOS-VLT Deep Survey, 3555 galaxies with photometric redshifts from the COMBO-17 multi-color data, coupled with multi-color HST/ACS images from the Great Observatories Origin Deep Survey. We split the sample in bulge- and disk-dominated populations on the basis of asymmetry and concentration parameters measured in the rest-frame -band. We find that at , the LF slope is significantly steeper for the disk-dominated population () compared to the bulge-dominated population (). The LF of the bulge-dominated population is composed of two distinct populations separated in rest-frame color : 68% of red and bright galaxies showing a strongly decreasing LF slope , and 32% of blue and more compact galaxies which populate the LF faint-end. We observe that red bulge-dominated galaxies are already well in place at , but the volume density of this population is increasing by a factor 2.7 between and . It may be related to the building-up of massive elliptical galaxies in the hierarchical scenario. In addition, we observe that the blue bulge-dominated population is dimming by 0.7 magnitude between and . Galaxies in this faint and more compact population could possibly be the progenitors of the local dwarf spheroidal galaxies.
Key Words.:
surveys – galaxies: evolution – galaxies: luminosity function – galaxies: morphology1 Introduction
A central issue to understand galaxy formation is to study the building up of the Hubble sequence. One approach is to measure the evolution in numbers and luminosity of different galaxy types using the luminosity function (LF). To this effect, large samples of galaxies are required with a robust estimate of distances, luminosities and morphological types.
At low as well as at high redshifts, most luminosity functions have been measured using galaxy samples classified by spectral type (e.g. Madgwick et al. 2002, de Lapparent et al. 2003) or by photometric type (e.g. Lilly et al. 1995, Wolf et al. 2003, Zucca et al. 2006). The direct interpretation of these results in the framework of a galaxy formation scenario is not straightforward since galaxies move from one spectral class to another by a passive evolution of their stellar population. Another way to define the galaxy type is to define a morphological type from the measurement of the structural parameters of the galaxies from image analysis. Even if star formation evolution could affect galaxy morphologies, a morphological classification is less sensitive to the star formation history than a classification based on the spectral energy distribution. This classification is also more robust to follow similar galaxies at different redshifts.
Unfortunately, it is difficult to assemble large samples of morphologically classified galaxies with measured spectroscopic redshifts for , as high resolution images are required to perform a morphological classification and a large amount of telescope time is needed to measure spectroscopic redshifts. This is why the largest samples of galaxies with both high resolution morphology and spectroscopic redshifts are not exceeding spectroscopic redshifts (e.g. Brinchmann et al. 1998, Cassata et al. 2005). Larger samples of galaxies are obtained using the photometric redshifts method (e.g. Wolf et al. 2005, Bell et al. 2005), but a major drawback of the photometric redshift method is the difficulty to control the systematic uncertainties which are affecting the redshift estimate and to quantify the impact of these systematics on the LF estimate.
This paper presents a study of the evolution of the galaxy LF as a function of morphological type. We use the spectroscopic redshifts from the VIMOS VLT Deep Survey on the Chandra Deep Field South (CDFS; Le Fèvre et al. 2004). The spectroscopic sample selected at is twice larger than previous spectroscopic samples at similar redshifts. We consolidate the results using 3555 photometric redshifts estimated from the COMBO-17 multi-color data. We check that photometric redshifts are not creating a systematic bias in the LF measurement from a detailed comparison between photometric redshift and spectroscopic redshift results. The morphological classification is performed using the multi-color images of the Hubble Space Telescope-Advanced Camera for Surveys released by the Great Observatories Origin Deep Survey (Giavalisco et al. 2004). Different methods to perform the morphological classification of this sample are presented in the companion paper Lauger et al. (2006) and compared with a visual classification of the sample. A single wavelength rest-frame morphological classification can be applied over the whole redshift range. Lauger et al. (2006) show that this classification can separate two robust classes : bulge- and disk-dominated galaxies. This paper presents the measurement of the LF evolution per morphological type, based on this single wavelength rest-frame morphological classification.
We use a flat lambda (, ) cosmology with km s-1 Mpc-1. Magnitudes are given in the system.
2 Data set description
We use the high-resolution images provided by the Great Observatories Origin Deep Survey (GOODS, Giavalisco et al. 2004) on the Chandra Deep Field South (CDFS) to perform the study of the galaxy morphology. The images have been acquired with the Hubble Space Telescope-Advanced Camera for Surveys (HST/ACS). The field covers 160 arcmin2 and has been observed in four bands F435W, F606W, F775W, F850LP (noted hereafter , , , respectively).
We use the spectroscopic redshifts from the VIMOS VLT Deep Survey (VVDS) on the CDFS (Le Fèvre et al. 2004). The spectroscopic observations have been conducted with the multi-object spectrograph VIMOS on the VLT-ESO Melipal. The spectroscopic targets are selected on a pure magnitude criterion from the ESO Imaging Survey (Arnouts et al. 2001). The sample used in this paper is limited to the area covered by GOODS. Our sample contains 670 objects (605 galaxies, 60 stars, 5 QSOs) with a secure measurement of the redshift (confidence level greater than 80%) and a mean redshift of .
Multi-color data from COMBO-17 are available on the CDFS field (Wolf et al. 2004). These data consist in 12 medium-band filters and 5 broad-band filters from 3500 to 9300Å. We also use the near-infrared and band data (21600Å) from the ESO Imaging Survey (Arnouts et al. 2001).
3 Photometric redshifts with Le Phare
We apply the code Le Phare111www.lam.oamp.fr/arnouts/LE_PHARE.html (S. Arnouts & O. Ilbert) on the COMBO-17 multi-color data completed by the NIR data from EIS to compute photometric redshifts for the complete CDFS sample. The photometric redshifts are measured with a standard from the best fit template on multi-color data (Arnouts et al. 2002). Our set of templates is composed of four observed spectra from Coleman et al. (1980) and one starburst SED from GISSEL (Bruzual & Charlot 2003). These 5 templates have been interpolated to increase the accuracy of the redshift estimate.
Our photometric redshift code significantly improves the standard method (Ilbert et al. 2006). We compute the average difference in each band between the observed apparent magnitudes and the predicted apparent magnitudes derived from the best fit template for a restricted sample of 67 bright galaxies () with a spectroscopic redshift. These differences never exceed 0.2 and have an average value over all filters of 0.06 magnitudes. We correct the predicted apparent magnitudes from these systematic differences. This method of calibration corrects for the small uncertainties existing in the filter transmission curves or in the calibration of the photometric zero-points.
The comparison between photometric redshifts and spectroscopic redshifts is shown in Fig.1. We only use the most secure spectroscopic redshifts with a confidence level greater than 95% (Le Fèvre et al. 2005). The fraction of catastrophic errors () in photometric redshifts estimates is 1.1% and the accuracy of the measurement is . 295 stars are removed from the sample which satisfy simultaneously a morphological criterion (SExtractor CLASS_STAR parameter greater than 0.975) and a criterion (). Up to and for , the sample contains 3555 photometric redshifts of galaxies associated with ACS/HST images.

4 Morphological classification
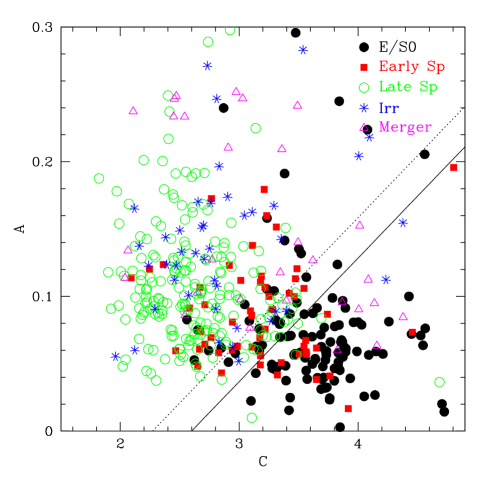
We measure asymmetry (A) and concentration (C) parameters on the ACS/HST images (Abraham et al. 1996, Conselice et al. 2000, Lauger et al. 2005, Menanteau et al. 2006). The concentration of light is defined as the ratio between the radii which contain 80% and 20% of the total flux of the galaxy, respectively. The asymmetry is obtained by computing the difference pixel per pixel of the original image and of its 180∘ rotation. We adopt these parameters to define our morphological classes since this classification is automatic, quantitative and reproducible.
Importantly, and thanks to the multi-color coverage of the ACS/HST images, we can measure the parameters and in the same rest-frame -band from up to (Cassata et al. 2005). In this way, we reduce the effect of a morphological k-correction which gives a more patchy appearance to the galaxies at higher redshift when observations are restricted to one band (e.g. Kuchinski et al. 2000, Burgarella et al. 2001).
To relate the quantitative parameters A-C to the Hubble sequence, we calibrate our morphological classes in the A-C plane with a visual classification of galaxies. We adopt the empirical criterion to separate the bulge-dominated population from the disk-dominated population (solid line of Fig.2). This criterion is chosen to maximize the separation between E/S0 and spiral/irregular classified galaxies. We show in the companion paper Lauger et al. (2006) that the bulge-dominated population defined with contains 8.9% of late spiral/irregular galaxies and that the disk-dominated population includes 8.3% of E/S0 galaxies down to . The bulge-dominated area contains also of early spiral galaxies but the visual differentiation between faint early spiral galaxies and lenticular galaxies is strongly subjective.
5 Galaxy luminosity function with
We derive the LF using the Algorithm for Luminosity Function (ALF) described in Ilbert et al. (2005). ALF includes 4 standard estimators of the LF which are the 1/Vmax, C+, SWML and STY. Combining these 4 estimators allows us to check the robustness of our estimate against spatial inhomogeneities, absolute magnitude binning, or spectral type incompleteness (Ilbert et al. 2004). We measure k-corrections from a procedure of template fitting on the multi-color data (Ilbert et al. 2005), using either the photometric redshift or the spectroscopic redshift according to the sample used.
We measure the LF in the rest-frame Johnson band. At the average redshift of this -selected sample, this choice of the rest-frame -band limits the model dependency of the absolute magnitudes (Ilbert et al. 2005), and minimizes any possible biases due to the mix of spectral types (Ilbert et al. 2004).
6 Results
The values given in this section are obtained using the photometric redshift sample to increase the accuracy of the measurements. However, we systematically check that the results obtained with spectroscopic redshifts and photometric redshifts are fully consistent.
6.1 A blue bulge-dominated population
We observe a blue population of bulge-dominated galaxies as already observed by e.g. Im et al. (2001), Menanteau et al. (2004), Cross et al. (2004). For both the spectroscopic and photometric redshift samples, the rest-frame colors of the bulge-dominated population present a bimodal distribution (see upper panel of Fig.3). We split the bulge-dominated population into two sub-samples separated in rest-frame color by according to this bimodality. We measure 32%/68% of blue/red galaxies at , respectively. This fraction of blue bulge-dominated galaxies is similar to the proportion of 30% obtained by Cross et al. (2004) using a rest-frame color criterion and a similar selection of .
To investigate farther the structural properties of this blue population, we use the Petrosian radius (see Lauger et al. 2005) and the angular distance to measure the physical size of the galaxy. Fig.3 (lower panel) shows the galaxy size distribution for blue and red bulge-dominated galaxies. The blue population, with an average size of is more compact than the red population with an average size of . The hypothesis that these two samples are extracted from the same population is rejected at 99.9% by a Kolmogorov-Smirnov test.
6.2 Shape of the LF versus morphology
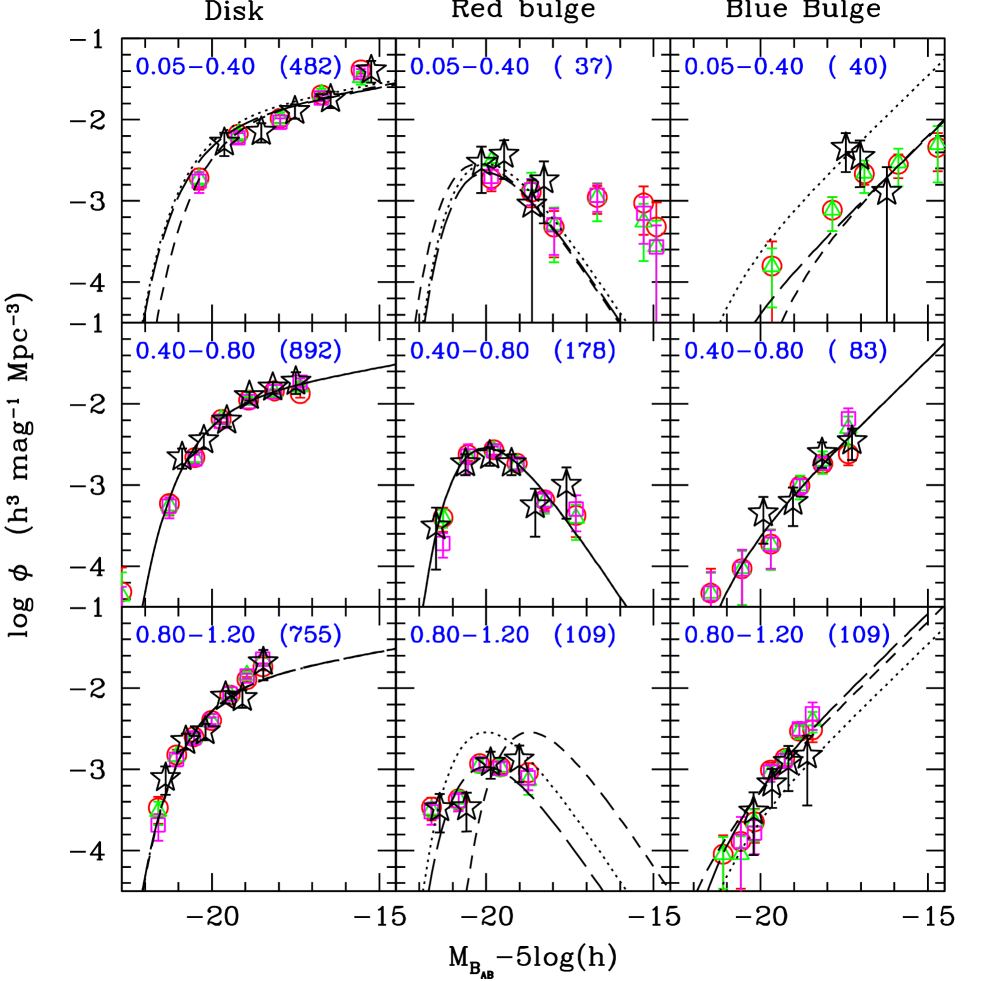
We investigate the dependency of the LF shape on the morphological type. This analysis is performed in the redshift bin , a good compromise maximizing the number of galaxies and covering a large absolute magnitude range. The LFs of the disk- and bulge-dominated populations are shown in the middle panels of Fig.4 and the corresponding Schechter parameters are given in Table 1. The LFs obtained with the photometric and the spectroscopic redshift samples are in very good agreement and no systematic trend in the shape is observed when using photometric redshifts.
The LF of the disk-dominated population presents a steep slope () which contrasts with the decreasing slope measured for the bulge-dominated population (). This population of disk-dominated galaxies is the dominant population of galaxies at . From the integration of the LF up to , the disk-dominated population represents 74% of the whole galaxy population.
The slope measured for the bulge-dominated population (, see Table 1) is steeper than previous LF measurement based on spectral type measurements (e.g. for Wolf et al. 2003, for Zucca et al. 2006). The presence of the faint blue bulge-dominated population explains this difference. The blue bulge-dominated population is composed of faint galaxies representing 67% of the bulge-dominated galaxies for but only 7.1% for . As the LF slope is extremely steep, the proportion of the observed blue galaxies is strongly dependent on the considered limit (here ). On the contrary, the red bulge-dominated population is composed of bright galaxies and represents 92% of the bulge-dominated population for . The density of red bulge galaxies decreases toward fainter magnitudes with a strongly decreasing LF slope . Between , the red bulge-dominated population represents only 5.7% of the whole population. The shape of the LF is in agreement with the measurement done by Cross et al. (2004) for red E/S0 galaxies (, mag at ). This selected sample of red bulge-dominated galaxies corresponds to the classical E/S0 population, composed of red and bright galaxies with a strongly decreasing LF slope. Blue and red bulge-dominated populations clearly exhibit different properties and need to be analysed separately.
| Type | Nb | (mag) | () | |
|---|---|---|---|---|
| disk | 892 | -1.19 | -20.22 | 12.39 |
| bulge | 261 | -0.53 | -20.20 | 7.48 |
| red-bulge | 178 | +0.55 | -19.53 | 7.44 |
| blue-bulge | 83 | -2.00 | -20.95 | 0.16 |

6.3 Evolution of the LF
Figure 4 presents the evolution of the disk-, red bulge- and blue bulge-dominated populations from up to . The Schechter parameters are given in Table 2. Since the LF slope is not constrained at , we set to the value measured at .
The results obtained with the photometric redshift sample are fully in agreement with the results obtained with the spectroscopic redshift sample (see the open stars of Fig.4). This comparison gives confidence that our measurement of the LF evolution is not due to systematic trends in photometric redshift estimates.
The LF of the disk-dominated galaxies evolves only mildly over the redshift range up to . The slope of the disk-dominated galaxies in our sample is comparable to the local values obtained by Marinoni et al. (1999) ( for S-Im eyeball classified galaxies) or by Nakamura et al. (2003) ( for S-Im type defined with concentration parameter). No significant evolution of is measured between and when testing for a pure density evolution (setting the parameters, see Table.2). We measure only a small brightening of 0.4 magnitude when testing for pure luminosity evolution (setting the values of ). Leaving and free (setting only the slope), we measure a brightening of magnitude with no significant evolution of between and .
The density of the red bulge-dominated population decreases at high redshift . We measure a decrease in density by a factor 2.7 between and for a pure density evolution (setting the parameters). A pure luminosity evolution of the LF is not a good fit of the non-parametric data (see Fig.4). Leaving and free (setting only the slope), we measure a small brightening of 0.2 mag with a decrease of by a factor 2 between and , consistent with a pure density evolution. Due to the difficulty to sample the bright part of the red-bulge dominated LF at , no strong conclusions can be drawn in this low redshift range. The evolution of the LF for the red bulge-dominated population is opposite to the increase in density observed by Cross et al. (2004) between and but is in agreement with the result obtained by Ferreras et al. (2005) on the same field. Our results are fully consistent with the results from the VVDS based on spectroscopic redshifts and spectral type classification (Zucca et al. 2006). The observed evolution of the red bulge-dominated population in our analysis remains small in comparison to the strong decrease in density of the elliptical galaxies measured by Wolf et al. (2003) using spectral type classification and photometric redshifts. Our results instead show that the population of E/S0 galaxies is already mostly in place at .
The LF slope of the blue bulge-dominated population remains extremely steep in all the redshift bins. This population strongly evolves. To quantify the LF evolution of this population, we first set the parameters to the values and look for an evolution in . We measure an increase in density of a factor 2.4 between and . Using the same procedure, we set the parameters to the values and look for an evolution in . We measure a brightening of 0.7 magnitude between and . The same trend is also present between and . It is unlikely than a large fraction of this blue bulge-dominated population contains misclassified spiral galaxies at high redshifts as the visual inspection of the UV rest-frame images at do not show star formation in the disc of these galaxies. If a large fraction of these blue bulge-dominated galaxies is including misclassified spiral galaxies at as claimed by Ferreras et al. (2005), the observed evolution of the blue bulge-dominated galaxies should even be stronger than what we have reported here.
| Type | z | Nb | (mag) | () | |
|---|---|---|---|---|---|
| disk | 0.05-0.40 | 482 | -1.19 | -19.79 | 12.39 |
| 0.05-0.40 | 482 | -1.19 | -20.22 | 10.95 | |
| 0.05-0.40 | 482 | -1.19 | -19.54 | 15.85 | |
| 0.40-0.80 | 892 | -1.19 | -20.22 | 12.39 | |
| 0.80-1.20 | 755 | -1.19 | -20.21 | 12.39 | |
| 0.80-1.20 | 755 | -1.19 | -20.22 | 12.44 | |
| 0.80-1.20 | 755 | -1.19 | -20.06 | 15.65 | |
| red-bulge | 0.05-0.40 | 37 | +0.55 | -19.77 | 7.44 |
| 0.05-0.40 | 37 | +0.55 | -19.53 | 5.79 | |
| 0.40-0.80 | 178 | +0.55 | -19.53 | 7.44 | |
| 0.80-1.20 | 109 | +0.55 | -18.23 | 7.44 | |
| 0.80-1.20 | 109 | +0.55 | -19.53 | 2.78 | |
| 0.80-1.20 | 109 | +0.55 | -19.76 | 3.05 | |
| blue-bulge | 0.05-0.40 | 40 | -2.00 | -20.95 | 0.03 |
| 0.05-0.40 | 40 | -2.00 | -19.11 | 0.16 | |
| 0.40-0.80 | 83 | -2.00 | -20.95 | 0.16 | |
| 0.80-1.20 | 109 | -2.00 | -20.95 | 0.38 | |
| 0.80-1.20 | 109 | -2.00 | -21.63 | 0.16 |
Since and are quantitative parameters and since the visual classification is strongly subjective, the separation between bulge- and disk-dominated galaxies in the plan is not a sharp limit. The area enclosed between (solid line of Fig.2) and (dotted line of Fig.2) contains a mix of different visual types. To quantify the impact of the adopted criterion on our conclusions, we recompute the LFs using the criteria rather than . This less conservative criterion increases the contamination of blue late spiral galaxies in the bulge-dominated area. As expected, the LF normalization of the blue bulge-dominated galaxies increases by a factor 1.6-2. We have specifically used a conservative criterion throughout this paper () to limit the fraction of late spiral/irregular galaxies in the bulge-dominated area. We have checked that only 12% of the blue-bulge dominated galaxies have been visually classified as late spiral or irregular galaxies. The LFs of the disk-dominated and of the red bulge-dominated galaxies remain unchanged and are little sensitive to the adopted criterion.
7 Discussion and conclusions
We derive the rest-frame -band LF of galaxies classified in morphological types up to in the CDFS using the VVDS spectroscopic sample of 605 galaxies, 3555 photometric redshifts from COMBO-17 multi-color data and the HST/ACS images from GOODS. We define bulge- and disk-dominated populations on the basis of A-C parameters measured in the rest-frame -band (Lauger et al. 2006). We show that the LF of the bulge-dominated population is the combination of two populations: a red and bright population making 68% of the bulge-dominated sample, and a blue population of more compact galaxies for the remaining 32% of the population. We observe a strong dependency of the LF shape on the morphological type. In the redshift range , we measure a shallow slope for the red bulge-dominated population while the disk-dominated population shows a very steep slope . The blue bulge-dominated population dominates the faint-end of the bulge-dominated LF. We emphasize that without morphological information, the blue bulge-dominated population can not be separated from the late spectral type population even if a composite fit of the LF (de Lapparent et al. 2003) is computed as an alternative when visual morphologies are not available.
We observe a small evolution of the disk-population. This is unexpected as the irregular galaxies included in our disk-dominated class are expected to evolve strongly (e.g. Brinchmann et al. 1998). As our one-wavelength A-C parameters are not efficient to isolate the irregular or merger galaxies from the late spiral galaxies (see Fig.2), this small evolution of the disk-dominated population could possibly be explained by cosmic variance in this small field, by the fact that spiral galaxies dominate the population of irregular galaxies, and by the fact that we are insensitive to the morphological k-correction effect.
We measure an increase in density of the red, bright (brighter than at ), bulge-dominated population with the age of the Universe. The observed evolution of the red bulge-dominated LF could be interpreted as evidence for the build-up of massive elliptical galaxies from merging and accretion of smaller galaxies in a hierarchical scenario. Our results indicate that the population of E/S0 galaxies is already in place at , in agreement with e.g. Lilly et al. (1995), Conselice et al. (2005), Zucca et al. (2006). As the field used in this paper is 160 arcmin2 and includes large structures (Adami et al. 2005), cosmic variance could possibly play a role and affect our results. To investigate this point, we compare the global LF measured on the CDFS field with the LF in the VVDS-0226-04 field (Ilbert et al. 2005) which covers an area 10 times larger. Correcting the LF normalizations in the CDFS field to match the normalization of the global LF in the VVDS-0226-04 field, we find that the evolution, although less pronounced, still shows an increase of the red bulge-dominated density with the age of the Universe. The effect of the density-environment relation (e.g. Dressler et al. 1997) on the observed evolution is difficult to assess. One approach to address this uncertainty is to compute the combined LF per morphological type and environment.
We also observe a very strong evolution of the blue bulge-dominated population corresponding to a brightening of 0.7 magnitude (or an increase in density by a factor 2.4) between and . The nature of this population remains unclear. Mergers expected in the hierarchical scenario could create a burst of star formation explaining the blue color of these galaxies. We have observed some signs of disruption for a significant fraction of these galaxies. These galaxies could be also a dwarf population undergoing a strong burst of star formation in the galaxy core, which could be interpreted as a bulge component (Im et al. 2001). The smaller size of this blue population in comparison to the red one as well as the faint absolute magnitude distribution of this population seem to favor this hypothesis. Considering that the evolution of the blue bulge-dominated population produces a fading in luminosity, we can relate this evolution to the strong decrease of the star formation rate observed from . This blue population could be the progenitor of the local population of dwarf spheroidal galaxies undergoing strong star formation at . Another possibility to investigate is the presence of an AGN in the galaxy nucleus as shown by Menanteau et al. (2005) which could be strongly related to the star formation activity.
An increase in survey areas is clearly necessary to limit the cosmic variance effects on computing the LFs of morphologically selected populations, as is on-going with next generation surveys (e.g. COSMOS). The development of quantitative methods to better isolate morphological galaxy classes, in particular merger and irregular galaxies, and the combination of morphological and spectral classifications, will also be necessary for further progress.
Acknowledgements.
This research has been developed within the framework of the VVDS consortium.This work has been partially supported by the CNRS-INSU and its Programme National de Cosmologie (France), and by Italian Ministry (MIUR) grants COFIN2000 (MM02037133) and COFIN2003 (num.2003020150).
The VLT-VIMOS observations have been carried out on guaranteed time (GTO) allocated by the European Southern Observatory (ESO) to the VIRMOS consortium, under a contractual agreement between the Centre National de la Recherche Scientifique of France, heading a consortium of French and Italian institutes, and ESO, to design, manufacture and test the VIMOS instrument.
References
- (1) Abraham R.G., van den Bergh S., Glazebrook K. et al., 1996, ApJS, 107, 1
- (2) Adami C., Mazure A., Ilbert O. et al., 2005, A&A, 443, 805
- (3) Arnouts S., Vandame B., Benoist C. et al., 2001, A&A, 379, 740
- (4) Arnouts S., Moscardini L., Vanzella E. et al., 2002, MNRAS, 329, 355
- (5) Bell E.F., Papovich C., Wolf C. et al., 2005, ApJ, 625, 23
- (6) Brinchmann J., Abraham R., Schade D. et al., 1998, ApJ, 499, 112
- (7) Bruzual G. & Charlot S., 2003, MNRAS, 344, 1000
- (8) Burgarella D., Buat V., Donas J., Milliard B. & Chapelon S., 2001, A&A, 369, 421
- (9) Cassata P., Cimatti A., Franceschini A. et al., 2005, MNRAS, 357, 903
- (10) Coleman G.D., Wu C.-C., Weedman D.W., 1980, ApJS, 43, 393
- (11) Conselice C.J., Bershady M.A. & Jangren A., 2000, ApJ, 529, 886
- (12) Conselice C. J., Blackburne J. A. & Papovich C., 2005, ApJ, 620, 564
- (13) Cross N.J.G., Bouwens R. J., Ben tez N. et al., 2004, AJ, 128, 1990
- (14) de Lapparent V., Galaz G., Bardelli S. & Arnouts S., 2003, A&A, 404, 831
- (15) Dressler A., Oemler A., Couch W.J. et al., 1997, ApJ, 490, 577
- (16) Ferreras I, Lisker T., Carollo C.M., Lilly S.J., Mobasher B., 2005, ApJ, 635, 243
- (17) Giavalisco M., Ferguson H.C., Koekemoer A. et al., 2004, ApJ, 600, L93
- (18) Ilbert O., Tresse L., Arnouts S. et al., 2004, MNRAS, 351, 541
- (19) Ilbert O., Tresse L., Zucca E. et al., 2005, A&A, 439, 863
- (20) Ilbert O., Arnouts, S., McCracken, H.J., et al., 2006, A&A, submitted, astro-ph/0603217
- (21) Im M., Simard L., Faber S. M. et al., 2002, ApJ, 571, 136
- (22) Im M., Faber S. M., Gebhardt K. et al., 2001, AJ, 122, 750
- (23) Kuchinski L.E., Madore B.F., Freedman W.L., Trewhella M., 2000, ApJS, 131, 441
- (24) Lauger S., Burgarella D. & Buat V., 2005, A&A, 434, 77
- (25) Lauger S., Ilbert O., Burgarella D. et al., 2006, A&A, submitted
- (26) Le Fèvre O., Vettolani G., Paltani S. et al., 2004, A&A, 428, 1043
- (27) Le Fèvre O., Vettolani G., Garilli, B., et al., 2005, A&A, 439, 845
- (28) Lilly S. J., Tresse L., Hammer F., Crampton D., Le Fèvre O., 1995, ApJ, 455, 108
- (29) Madgwick D.S., Lahav O., Baldry I.K. et al., 2002, MNRAS, 333, 133
- (30) Marinoni C., Monaco P., Giuricin G. & Costantini B., 1999, ApJ, 521, 50
- (31) Menanteau F., Ford H. C., Illingworth G.D. et al., 2004, ApJ, 612, 202
- (32) Menanteau F., Martel A.R., Tozzi P. et al., 2005, ApJ, 620, 697
- (33) Menanteau F., Ford H.C., Motta V. et al., 2006, AJ, 131, 208
- (34) Nakamura O., Fukugita M., Yasuda N. et al., 2003, ApJ, 125, 1682
- (35) Wolf C., Meisenheimer K., Rix H.-W. et al., 2003, A&A, 401, 73
- (36) Wolf C., Meisenheimer K., Kleinheinrich M. et al., 2004, A&A, 421, 913
- (37) Wolf C., Bell E.F., McIntosh D.H. et al., 2005, AJ, 630, 771
- (38) Zucca E., Ilbert O., Tresse L. et al., 2006, in press, astro-ph/0506393