New DQ white dwarfs in the Sloan Digital Sky Survey DR4: confirmation of two sequences
Using photometric selection criteria, and in a final step visual inspection of spectra, we find 65 DQ white dwarfs in the Data Release 4 of the Sloan Digital Sky Survey. 37 of these are new identifications, three more are reclassified DQ from DC, the other 25 have been described as DQ before in the literature. We derive effective temperatures and carbon abundances for 60 of these stars. The results confirm the main conclusions of Dufour et al. (2005). The majority of stars defines a clear sequence in the C abundance vs. diagram, with high abundances found at high and vice versa. We also confirm with high significance a second sequence with an abundance about 1 dex higher at the same , and discuss the nature and possible origin of the high-C sequence.
Key Words.:
stars: white dwarfs – stars: abundances1 Introduction
White dwarfs of spectral type DQ are defined as showing atomic or molecular features of carbon in a helium atmosphere. Contrary to other metals (notably Ca) found in cool white dwarfs, which are thought to be provided through an accretion process from outside the star, the most widely accepted explanation for the DQs is dredge-up from the underlying carbon/oxygen core through the expanding He convection zone (Koester et al., 1982; Pelletier et al., 1986). A detailed summary of the basic properties of this class and earlier references to spectroscopic analyses has been given recently in a comprehensive paper by Dufour et al. (2005, = DB05 henceforth) and need not be repeated here.
In addition to the general understanding of the nature, evolutionary relations and origin of the peculiar spectral types of white dwarfs, the DQs are of special interest, because they provide information about the deeper layers of the stars. The transition between the outer helium layer and the carbon/oxygen core – the result of the helium burning in the progenitor – is not abrupt, but rather gradual as determined by the diffusion equilibrium (Koester et al., 1982). We can predict the structure of this transition quantitatively (Pelletier et al., 1986), as well as the depth of the helium convection zone at a given effective temperature and mass of the star. The observed carbon abundance in the atmosphere is then directly related to the thickness of the helium layer remaining from the previous nuclear evolution, which is a very important parameter for the understanding of stellar evolution. The first estimate of this thickness by Pelletier et al. (1986) – – was much thinner than predicted by evolutionary calculations of the AGB phase. However, the recent abundance determinations by DB05, together with the new models of the outer layers by Fontaine & Brassard (2005) are in much better agreement with theoretical expectations. Nevertheless, there are still many problems understanding the detailed connection of the DQ stars to possible helium-rich progenitors (Althaus et al., 2005; Scóccola et al., 2006).
When searching for correlations of DQ parameters, e.g. between atmospheric carbon abundance and effective temperature, it is very helpful to have available a homogeneous sample of observations. It has been found in previous studies that abundances determined from atomic lines in the UV or molecular bands in the optical may sometimes differ significantly (e.g. Provencal et al., 2002), possibly blurring any correlation if only one or the other observation is available for different objects (Weidemann & Koester, 1995). Such a homogenous sample is currently provided by the Sloan Digital Sky Survey, and DB05 provides the first quantitative analysis of 40 DQs from the Data Release 1 (DR1). In this paper we report similar results for 40 new DQs (and 20 previously known) extracted from DR4 (Adelman-McCarthy et al., 2006).
2 Selection of DQ candidates
DR4 of the SDSS contains spectra for approximately 240000 objects classified as “point source” or “unknown”. In order to narrow down this huge database to tractable numbers we have applied three consecutive selection steps, the first two based on the SDSS photometry, the last on the spectra.
2.1 DQ regions in SDSS color space and theoretical models
Theoretical SDSS colors can be calculated from synthetic spectra by convolving them with the 5 SDSS band passes. Our model grid is similar to that described in Carollo et al. (2003), but extended to cover effective temperatures from 13000 K to 4400 K. Logarithmic C abundance by number relative to He ( = [C/He])range from to in steps of 0.5. The standard grid used here has a surface gravity of = 8.00, but additional grids were calculated with 7.5 and 8.5 for comparison. The models are fully blanketed, fully including the line and molecular band absorption in the calculation of the atmospheric structure. Non-ideal effects in the form of a lowering of the dissociation energy of the C2 molecule is included in a very approximate way.
The transmission curves for the five filters (for airmass 1.3 as recommended) were obtained from the SDSS web sites; the zero-points for the magnitudes were set to correspond to the AB system of magnitudes (Fukugita et al., 1996) except for small changes to (-0.04, 0.01, 0.02) similar to those discussed in Eisenstein et al. (2006).
The dependence on and [C/He] is strongest in the vs. two-color diagram and much less in the remaining independent indices used, and . Figure 1 shows this diagram with the theoretical grid, and 40 observed DQs from Harris et al. (2003) and Kleinman et al. (2004), which indeed fall in or very near the theoretical grid. Note that we have not applied any correction for galactic extinction (see DB05).

| SDSS Name | MJD | Plate | Fid | [C/He] | [C/He] | Spectral Type/Ref | |
|---|---|---|---|---|---|---|---|
| SDSS J074204.79+434835.7 | 53052 | 1736 | 139 | 7738 | -5.47 | 0.04 | DQ |
| SDSS J084131.55+332915.6 | 52642 | 933 | 16 | 6810 | -6.62 | 0.05 | DQ |
| SDSS J085239.66+042804.5 | 52670 | 1190 | 177 | 9555 | DQ | ||
| SDSS J085506.62+063904.7 | 52668 | 1189 | 535 | 7337 | -5.99 | 0.01 | DQ |
| SDSS J085709.01+060357.4 | 52668 | 1189 | 27 | 8210 | -5.00 | 0.02 | DQ |
| SDSS J090449.73+395416.4 | 52703 | 1199 | 595 | 7319 | -5.74 | 0.05 | DQ |
| SDSS J090514.78+090426.5 | 52973 | 1300 | 420 | 8861 | -4.89 | 0.01 | DQ (H ?) |
| SDSS J090632.17+470235.8 | 52606 | 898 | 565 | 5070 | -4.31 | 0.01 | DQ (weak bands) |
| SDSS J091602.73+101110.5 | 53050 | 1739 | 592 | 8715 | -4.81 | 0.01 | DQ |
| SDSS J091830.27+484323.0 | 52637 | 900 | 429 | 8884 | -3.72 | 0.06 | DQ |
| SDSS J092153.46+342136.9 | 52995 | 1274 | 216 | 8202 | -5.46 | 0.09 | DQ |
| SDSS J092613.46+472521.1 | 52637 | 900 | 41 | 7261 | -6.41 | 0.06 | DQ |
| SDSS J092909.03+331011.7 | 52991 | 1593 | 94 | 6361 | -5.57 | 0.01 | DQ |
| SDSS J094014.65+090641.8 | 52993 | 1304 | 45 | 6169 | -7.34 | 0.05 | DQpec (rounded bands) |
| SDSS J094115.18+090154.4 | 52993 | 1304 | 9 | 9122 | -4.73 | 0.02 | DQ |
| SDSS J094138.08+441458.2 | 52672 | 1202 | 58 | 8113 | -5.42 | 0.06 | DQ |
| SDSS J095934.95+453725.4 | 52703 | 942 | 446 | 7211 | -5.52 | 0.06 | DQ |
| SDSS J100059.82+100531.7 | 53053 | 1308 | 307 | 7958 | -4.83 | 0.02 | DQ, WD 1105+412 |
| SDSS J101750.38+373637.5 | 52996 | 1427 | 216 | 7497 | -5.79 | 0.03 | DQ |
| SDSS J101800.00+083820.3 | 52762 | 1237 | 621 | 7784 | -5.85 | 0.01 | DQ |
| SDSS J102635.81+580714.8 | 52316 | 559 | 6 | 8879 | -4.56 | 0.03 | DQ |
| SDSS J110759.46+405910.9 | 53046 | 1437 | 512 | 7169 | -6.45 | 0.02 | DQ |
| SDSS J110912.21+424956.0 | 53053 | 1363 | 37 | 9402 | -4.84 | 0.08 | DQ, WD 0913+103 |
| SDSS J112604.29+441938.6 | 53062 | 1365 | 564 | 7097 | -6.38 | 0.05 | DQ |
| SDSS J113534.61+572451.7 | 53033 | 1310 | 485 | 7385 | -6.42 | 0.02 | GD 311, Kawka & Vennes (2006) |
| SDSS J115149.92+452729.8 | 53084 | 1368 | 503 | 8829 | -4.75 | 0.04 | DQ |
| SDSS J122545.87+470613.0 | 53117 | 1451 | 35 | 6109 | -5.82 | 0.01 | DQ |
| SDSS J123347.60+125346.1 | 53169 | 1616 | 429 | 7152 | -6.36 | 0.02 | DQ |
| SDSS J130945.62+444541.0 | 53084 | 1375 | 391 | 8085 | -4.01 | 0.03 | DQ |
| SDSS J131534.72+471108.9 | 53062 | 1461 | 428 | 7524 | -5.99 | 0.01 | DQ |
| SDSS J131930.66+140137.1 | 53112 | 1773 | 105 | 7626 | -5.65 | 0.05 | DQ |
| SDSS J133127.04+670419.5 | 51988 | 496 | 583 | 8899 | -4.91 | 0.06 | DQ (weak bands) |
| SDSS J143144.83+375011.9 | 53089 | 1381 | 599 | 6173 | -6.97 | 0.02 | DQ |
| SDSS J152812.05+513445.2 | 52378 | 795 | 319 | 7531 | -5.69 | 0.03 | DQ |
| SDSS J153447.54+414559.4 | 53149 | 1679 | 616 | 7804 | -5.92 | 0.02 | DQZ (CaII) |
| SDSS J161653.36+392444.4 | 52759 | 1336 | 572 | 7319 | -5.92 | 0.02 | DQ |
| SDSS J165436.86+315754.4 | 52791 | 1176 | 238 | 7258 | -5.89 | 0.01 | DQ |
| SDSS J171341.76+324009.1 | 52413 | 976 | 623 | 7901 | -5.36 | 0.01 | DQ |
| SDSS J211130.04003628.8 | 52431 | 985 | 35 | 7168 | -6.27 | 0.05 | DQ |
| SDSS J213503.32+000318.4 | 52468 | 989 | 198 | 6413 | -6.78 | 0.03 | DQ |
| SDSS Name | MJD | Plate | Fid | [C/He] | [C/He] | Spectral Type/Ref | |
|---|---|---|---|---|---|---|---|
| SDSS J000011.57085008.4 | 52143 | 650 | 450 | 8042 | -5.46 | 0.08 | |
| SDSS J000807.54103405.6 | 52141 | 651 | 199 | 7768 | -5.66 | 0.06 | |
| SDSS J002531.50110800.9 | 52145 | 653 | 86 | 8367 | -4.96 | 0.01 | |
| SDSS J015433.57004047.2 | 51871 | 403 | 268 | 7435 | -5.89 | 0.03 | |
| SDSS J015441.75+140308.0 | 51877 | 430 | 558 | 6511 | -6.89 | 0.01 | |
| SDSS J032054.11071625.4 | 51924 | 460 | 236 | 6266 | -5.45 | ||
| SDSS J033218.22003722.1 | 51810 | 415 | 240 | 8600 | -4.62 | 0.03 | |
| SDSS J090157.92+575135.9 | 51924 | 483 | 600 | Liebert et al. (2003) | |||
| SDSS J091922.18+023605.0 | 51929 | 473 | 458 | 11566 | |||
| SDSS J093537.00+002422.0 | 52314 | 476 | 461 | 4958 | -6.19 | 0.02 | Harris et al. (2003) |
| SDSS J094004.64+021022.6 | 52026 | 477 | 493 | 7283 | -5.95 | 0.01 | |
| SDSS J095137.60+624348.7 | 51943 | 487 | 227 | 8388 | -5.11 | 0.10 | |
| SDSS J113359.94+633113.2 | 52059 | 597 | 139 | 12082 | |||
| SDSS J114851.68012612.8 | 52056 | 329 | 578 | 9174 | -3.73 | 0.01 | |
| SDSS J125359.61+013925.6 | 52026 | 523 | 252 | 8282 | -4.98 | 0.02 | |
| SDSS J123752.12+415625.8 | 53090 | 1454 | 146 | 5846 | -5.51 | 0.01 | Carollo et al. (2006) |
| SDSS J132858.20+590851.0 | 52411 | 959 | 504 | Liebert et al. (2003) | |||
| SDSS J142728.30+611026.4 | 52368 | 607 | 379 | 6427 | -6.83 | 0.01 | WD 1426+613 |
| SDSS J144407.25+043446.8 | 52026 | 587 | 418 | 9449 | -3.65 | 0.05 | |
| SDSS J144808.07004755.9 | 51662 | 308 | 145 | 7063 | -6.50 | 0.04 | |
| SDSS J154810.66+562647.7 | 52072 | 617 | 551 | 8119 | -5.46 | 0.07 | |
| SDSS J155413.53+033634.5 | 52023 | 595 | 373 | 6512 | -6.94 | 0.03 | |
| SDSS J164328.54+400204.3 | 52050 | 630 | 386 | 7144 | -6.20 | 0.07 | |
| SDSS J165538.51+372247.1 | 52071 | 632 | 92 | 8997 | -4.75 | 0.06 | |
| SDSS J205316.34070204.3 | 52176 | 636 | 267 | 6382 | -5.45 | 0.02 |
Using this information about the position of DQs in the SDSS color space, we have as a first selection step extracted from the SDSS database all objects in the “point source” and “unknown” categories falling into the region defined by
resulting in 86856 selected objects. This sample still contains large numbers of DA white dwarfs and quasars. We therefore have in a second step refined the color region using a polygon in the plane. The polygon area follows rather closely the outline of the theoretical grid, except at the hot end. Since the grid converges towards a single line (the models are much less dependent on the C abundance) the polygon at the hot end is significantly wider in . Applying this selection step narrowed the candidate sample down to 44928 objects.
2.2 Selection in 4-dimensional color space
Since we consider for the moment only the dependence of colors on and [C/He], it is obvious that the theoretical grid must define a 2-dimensional surface in the 4-dimensional color space (). That the variation is strongest in the first two components suggest that this surface might be approximated by a plane and this is confirmed by looking at different projections of the grid in two- or three-dimensional subspaces. We have therefore fitted a plane to the nodes of this grid using a minimization technique. The fit is extremely good, with typical deviations of grid points from the plane of 0.03 mag.
The equation of the plane is
where we have used the first two colors directly as the two variables for the plane. The reasonable region for DQs is given by the limits
This plane representation of theoretical DQ colors was used in the final photometric selection step. We defined a minimum “distance” from the plane for each observed object by measuring each coordinate in units of their individual measurement errors
Here and are the four observed and theoretical SDSS colors, and the measurement error of the observation. We eliminated the majority of objects by using a limit of . This limit had been determined from a test using the 40 DQs of Fig. 1. The final sample contained 6952 DQ candidates.
2.3 Color space for different surface gravities
We have also fitted the theoretical grids for = 7.5 and 8.5 in the same way. The resulting planes were practically indistinguishable from the = 8.0 plane, however, the lines of constant temperature or C abundance are slightly shifted. This corresponds to the well known fact for DQs that the parameters and [C/H] are degenerate. They cannot both be determined from photometry (nor spectra), because a change of can always be very nearly compensated with a corresponding change of [C/He], and one of the two has to be assumed to be able to proceed. Using the fact that most white dwarfs cluster around 0.6 M⊙, we have assumed = 8, as did DB05.
2.4 Visual classification of the 6952 candidates
Spectra for all remaining candidates were extracted from the SDSS database and inspected visually. More than 95% turned out to be quasars, easily recognized by their strong and broad emission lines. Of the remaining objects some were DA white dwarfs (broad Balmer absorption), some galaxies with narrow absorption lines. The DQs, the topic of this study, were identified through their molecular Swan bands. In total we found 65 DQs, of which 25 were already known in the literature and 37 are new detections, and 3 reclassifications from a spectral type of DC.
Tables 1 and 2 list all 65 DQ with their SDSS names, internal identifiers, and atmospheric parameters, determined as described in the next section. Most of the objects show only carbon features. SDSS J090514.78+090426.5 shows a feature near the position of H, but nothing near the other Balmer lines, and the presence of hydrogen is highly uncertain. SDSS J153447.54+414559.4 shows Ca II H and K lines with equivalent widths of 2.1 and 1.0 Å. The wings are broad and the distance of the star is very likely less than 100 pc, implying a photospheric origin of the lines, probably due to accretion. SDSS J094014.65+090641.8 shows rounded bands similar to SDSS J223224.0-074434.3 in Harris et al. (2003).
3 Atmospheric analysis of the DQ white dwarfs
3.1 Photometry
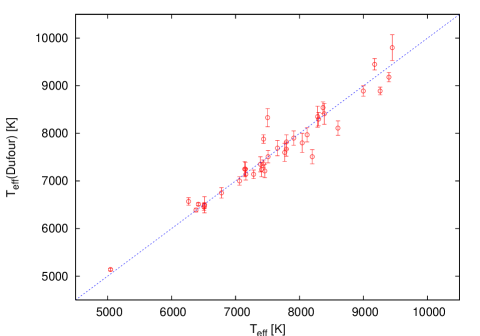
The parameters and [C/He] were determined by minimizing in the sense of a the distance between the observed point in 4-dimensional color space with model colors interpolated on the - [C/He] grid. minimization was obtained with the AMOEBA routine from Press et al. (1992). Since our sample contains 20 objects in common with DB05, we compare the derived in Fig. 2. The agreement in with those from DB05, which are based on photometry and spectra is excellent, confirming that photometry alone already gives a reliable . From the differences between the two completely independent determinations we estimate a typical error for of 190 K. This is a much more realistic error than the internal errors from the routine; it is also very similar to the error of 170 K cited by DB05, and we take this as our error estimate for . On the other hand, the derived carbon abundances differ markedly, with a much higher scatter and also systematic differences. This is not really surprising, since the colors for different abundances converge at the high temperature end and a [C/He] determination based on colors alone will be inaccurate to impossible. In addition, small uncertainties of the magnitude zero-points could shift the whole grid by a few hundreds of a magnitude, resulting in systematic changes. These abundances are not used further and therefore not shown here.
3.2 Spectroscopy
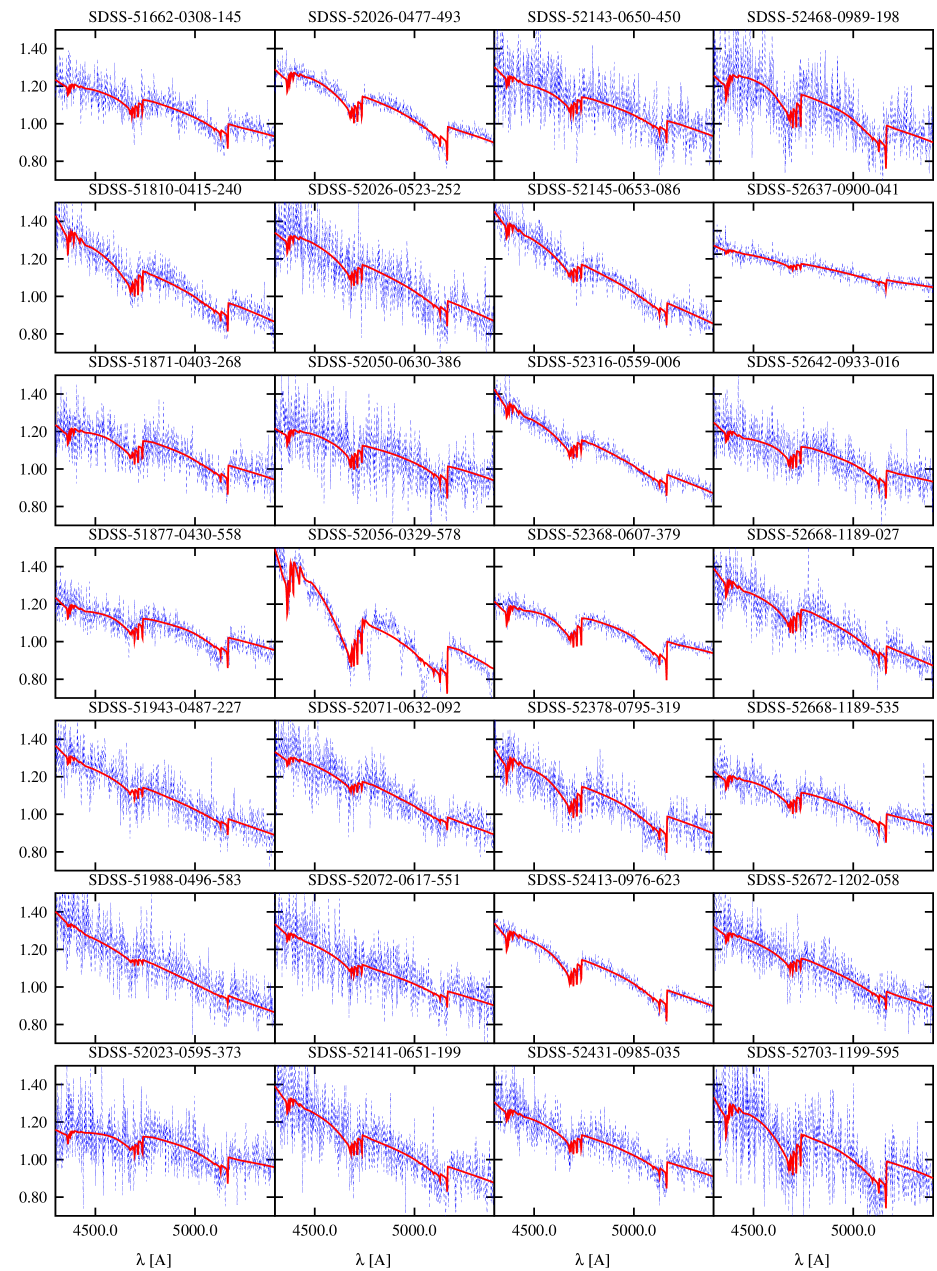
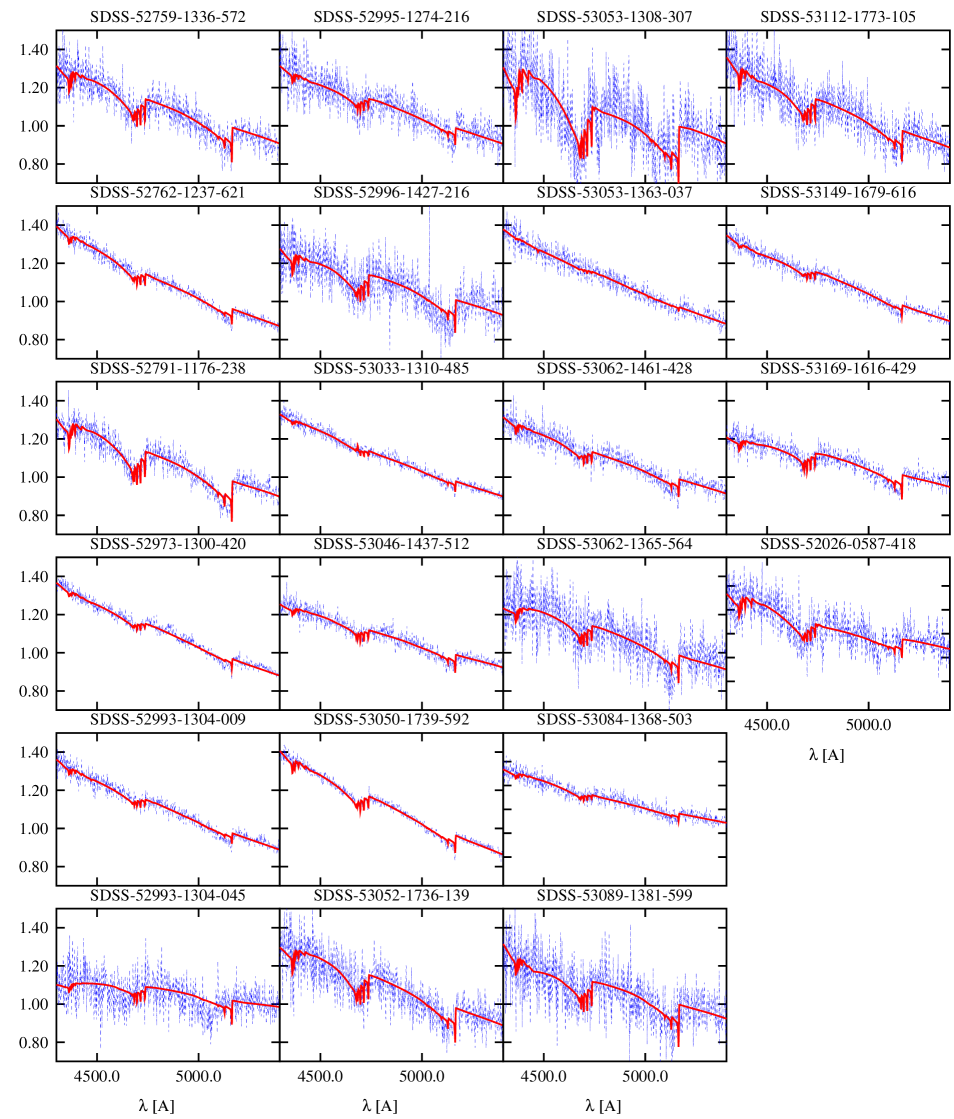
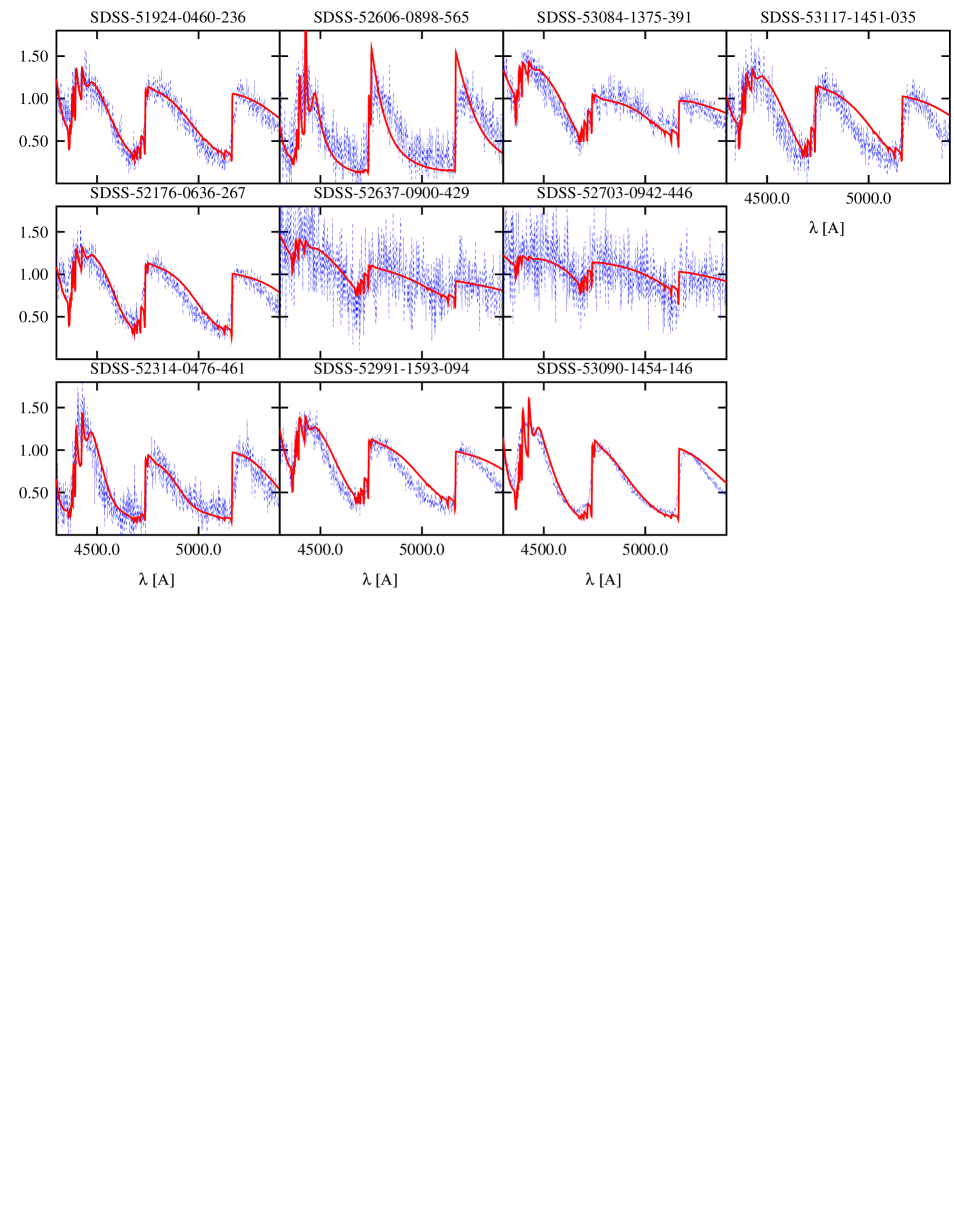
Fortunately, SDSS provides photometry and spectroscopy. The spectra were fitted with the theoretical spectra from our standard grid using the same methods used by us for other types of white dwarfs (Koester et al., 2001; Homeier et al., 1998). In principle the spectroscopic fit provides and [C/He] ( = 8 is always assumed). However, since we have shown the high reliability of the photometric determination, we have kept the temperature fixed and determined only the carbon abundance from the spectra, leading to smaller errors of these abundances. These abundances are given in Table 1 and 2. For the five objects with missing entries in the [C/He] column we could not obtain reasonable fits within our grid. The spectral fits for the region around the strongest Swan bands of the remaining 60 objects are shown in Figure 5 to Fig. 7 in the appendix; the values are also in Table 1 and 2.
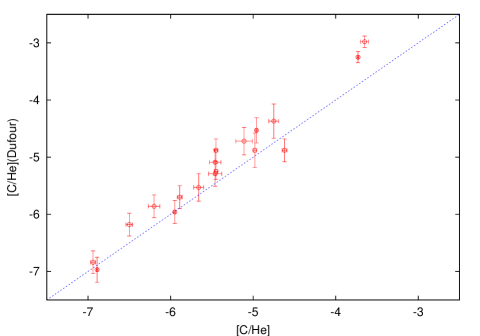
Figure 3 gives a comparison of our final results for the carbon abundance with DB05 for the common objects. The general agreement is very good, with a small systematic shift of about 0.2 dex, increasing from lower to high abundances. The [C/He] abundances of DB05 are on average slightly higher than our values.
4 Results and discussion
We have identified 40 new DQ white dwarfs and rediscovered another 25 from the Data Release 4 of the Sloan Digital Sky Survey and presented effective temperatures and carbon abundances for 60 of them. This increases very significantly the number of DQs with a careful analysis using up-to-date model atmospheres. Particularly important is the fact that our sample is based on a completely homogenous set of photometry and spectra. This is similar to the work of DB05, who however included also observations from other sources together with 40 SDSS objects in their sample. For the objects in common with their analysis we find good agreement for the parameters, with a slight offset in the abundances of the order of 0.2 dex.
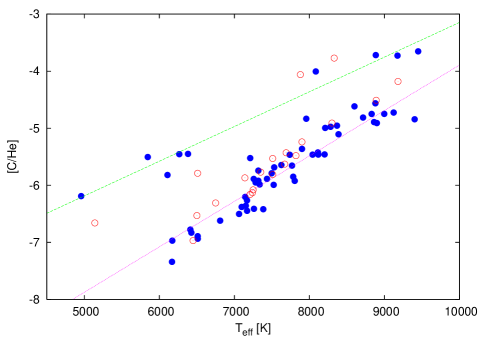
The major result of this paper is shown in Fig. 4, which displays the carbon abundance versus effective temperature. In addition to our own results (shown as full circles) we have here included data from DB05 for those objects not included in our sample (open circles). We clearly confirm the three main conclusions of DB05:
-
•
The paucity of objects with below 6000 K. Our sample adds only one object clearly below the apparent cutoff, also carbon-rich as the single cool objects in DB05.
-
•
The clear sequence for the majority of the objects, from low , low [C/He] to high , high [C/He], indicated by the lower of the two regression line fits (these fits use only the results from this paper). The existence of this sequence was first pointed out by DB05 and shows the large advantage of using a homogenous sample of good quality observations compared to e.g. the study of Weidemann & Koester (1995). The extrapolation of the sequence to 10000 K predicts [C/He] = -4.0, in agreement with the theoretical calculations of Fontaine & Brassard (2005) for a He-layer thickness of of the stellar mass.
-
•
The existence of a separate population of carbon-rich DQs, with an abundance about 1 dex higher than the primary sequence. This population seems to form a second sequence, which we have tentatively described with the upper regression line.
Based on one single object with a parallax and thus mass determination of 1.05 M⊙ in the upper sequence (G47-18 = WD 0856+33), DB05 tentatively suggested that all objects of this group are massive white dwarfs and might be the descendents of the hot DQ stars, which also seem to be massive, although that assertion is also only based on two objects (Liebert et al., 2003; Macdonald et al., 1998; Weidemann, 2005). Stellar evolution calculations predict smaller He envelope masses for more massive progenitors (Kawai et al., 1988) and might lead to the dredge-up occurring at higher effective temperatures (Thejll et al., 1990). This would also be a natural explanation for the absence of the high-mass tail in the DB mass distribution (Beauchamp et al., 1996; Liebert et al., 2003).
While these conclusions seem rather speculative at present, it is obvious that further study of the large number of DQs with excellent observations coming from SDSS and other large scale survey will provide important clues for the remaining open question of the origin and evolution of white dwarf surface compositions and spectral types. Of particular importance are parallax determinations for DQs on the high abundance sequence.
Acknowledgements.
This study was partially supported by a grant from the Deutsche Forschungsgemeinschaft (KO731/21-1,-2), and would have been impossible without the SDSS. Funding for the Sloan Digital Sky Survey (SDSS) has been provided by the Alfred P. Sloan Foundation, the Participating Institutions, the National Aeronautics and Space Administration, the National Science Foundation, the U.S. Department of Energy, the Japanese Monbukagakusho, and the Max Planck Society. The SDSS Web site is http://www.sdss.org/. The SDSS is managed by the Astrophysical Research Consortium (ARC) for the Participating Institutions. The Participating Institutions are The University of Chicago, Fermilab, the Institute for Advanced Study, the Japan Participation Group, The Johns Hopkins University, the Korean Scientist Group, Los Alamos National Laboratory, the Max-Planck-Institute for Astronomy (MPIA), the Max-Planck-Institute for Astrophysics (MPA), New Mexico State University, University of Pittsburgh, University of Portsmouth, Princeton University, the United States Naval Observatory, and the University of Washington. This research has made use of the SIMBAD database, operated at CDS, Strasbourg, FranceReferences
- Adelman-McCarthy et al. (2006) Adelman-McCarthy, J. K., Agüeros, M. A., Allam, S. S., et al. 2006, ApJS, 162, 38
- Althaus et al. (2005) Althaus, L. G., Serenelli, A. M., Panei, J. A., et al. 2005, A&A, 435, 631
- Beauchamp et al. (1996) Beauchamp, A., Wesemael, F., Bergeron, P., Liebert, J., & Saffer, R. A. 1996, in ASP Conf. Ser. 96: Hydrogen deficient stars, ed. C. S. Jeffery and U. Heber, p.295
- Carollo et al. (2006) Carollo, D., Bucciarelli, B., Hodgkin, S. T., et al. 2006, A&A, 448, 579
- Carollo et al. (2003) Carollo, D., Koester, D., Spagna, A., Lattanzi, M. G., & Hodgkin, S. T. 2003, A&A, 400, L13
- Dufour et al. (2005) Dufour, P., Bergeron, P., & Fontaine, G. 2005, ApJ, 627, 404
- Fontaine & Brassard (2005) Fontaine, G. & Brassard, P. 2005, in ASP Conf. Ser. 334: 14th European Workshop on White Dwarfs, ed. D. Koester & S. Moehler, p.49
- Fukugita et al. (1996) Fukugita, M., Ichikawa, T., Gunn, J. E., et al. 1996, AJ, 111, 1748
- Harris et al. (2003) Harris, H. C., Liebert, J., Kleinman, S. J., et al. 2003, AJ, 126, 1023
- Homeier et al. (1998) Homeier, D., Koester, D., Hagen, H. J., et al. 1998, A&A, 338, 563
- Kawai et al. (1988) Kawai, Y., Saio, H., & Nomoto, K. 1988, ApJ, 328, 207
- Kawka & Vennes (2006) Kawka, A. & Vennes, S. 2006, ArXiv astro-ph/0601477
- Kleinman et al. (2004) Kleinman, S. J., Harris, H. C., Eisenstein, D. J., et al. 2004, ApJ, 607, 426
- Koester et al. (2001) Koester, D., Napiwotzki, R., Christlieb, N., et al. 2001, A&A, 378, 556
- Koester et al. (1982) Koester, D., Weidemann, V., & Zeidler, E. . 1982, A&A, 116, 147
- Liebert et al. (2003) Liebert, J., Harris, H. C., Dahn, C. C., et al. 2003, AJ, 126, 2521
- Macdonald et al. (1998) Macdonald, J., Hernanz, M., & Jose, J. 1998, MNRAS, 296, 523
- McCook & Sion (1999) McCook, G. P. & Sion, E. M. 1999, ApJS, 121, 1
- Pelletier et al. (1986) Pelletier, C., Fontaine, G., Wesemael, F., Michaud, G., & Wegner, G. 1986, ApJ, 307, 242
- Press et al. (1992) Press, W. H., Teukolsky, S. A., Vetterling, W. T., & Flannery, B. P. 1992, Numerical recipes in FORTRAN. The art of scientific computing (Cambridge: University Press, 2nd ed.)
- Provencal et al. (2002) Provencal, J. L., Shipman, H. L., Koester, D., Wesemael, F., & Bergeron, P. 2002, ApJ, 568, 324
- Scóccola et al. (2006) Scóccola, C., Althaus, L., Serenelli, A., Rohrmann, R., & Corsico, A. 2006, ArXiv astro-ph/0410214
- Thejll et al. (1990) Thejll, P., Shipman, H. L., Macdonald, J., & Macfarland, W. M. 1990, ApJ, 361, 197
- Weidemann (2005) Weidemann, V. 2005, in ASP Conf. Ser. 334: 14th European Workshop on White Dwarfs, ed. D. Koester & S. Moehler, p.15
- Weidemann & Koester (1995) Weidemann, V. & Koester, D. 1995, A&A, 297, 216
Appendix A Graphical display of spectral fits for 60 DQs