1-1 Machikaneyama-cho, Toyonaka, Osaka 560-0043, Japan 55institutetext: International School for Advanced Studies (SISSA-ISAS), Via Beirut 2-4, I-34014 Trieste, Italy 66institutetext: Università degli Studi di Milano “Bicocca”, Piazza delle Scienze, 3, I-20126, Milano, Italy 77institutetext: INAF-Astrophysical Observatory of Arcetri, Largo E. Fermi, 5, I-50125 Firenze, Italy 88institutetext: Kavli Institute for Theoretical Physics University of California Santa Barbara, CA 93106 99institutetext: NASA/Goddard Space Flight Center, Greenbelt, MD 20771 1010institutetext: Department of Astronomy & Astrophysics, 525 Davey Lab., Pennsylvania State University, University Park, PA 16802, USA 1111institutetext: INAF Istituto di Astrofisica Spaziale e Fisica Cosmica Sezione di Palermo, Via Ugo La Malfa 153, I-90146 Palermo, Italy 1212institutetext: JILA, University of Colorado, Boulder, CO 80309, USA 1313institutetext: Department of Physics and Astronomy, University of Leicester, Leicester LE 1 7RH, UK
The multiwavelength afterglow of GRB 050721: a puzzling rebrightening seen in the optical but not in the X-ray. 111Based on observations acquired with ESO telescopes at Paranal, under programs 275.D-5022 and 075.D-0787
Abstract
Context. GRB 050721 was detected by Swift and promptly followed-up, in the X-ray by Swift itself and, in the optical band, by the VLT operated, for the first time, in rapid response mode starting observations about 25 m after the burst. A multiwavelength monitoring campaign was performed in order to study its afterglow’s behavior.
Aims. We present the analysis of the early and late afterglow emission in both the X-ray and optical bands, as observed by , a robotic telescope, and the VLT. We compare early observations with late afterglow observations obtained with Swift and the VLT in different bands in order to constrain the density of the medium in which the fireball is expanding.
Methods. We have analyzed both the X-ray and the optical light curves and compared the spectral energy distribution of the afterglow at two different epochs.
Results. We observed an intense rebrightening in the optical band at about one day after the burst which was not seen in the X-ray band. This is the first observation of a GRB afterglow in which a rebrightening is observed in the optical but not in the X-ray band. The lack of detection in X-ray of such a strong rebrightening at lower energies may be described with a variable external density profile. In such a scenario, the combined X-ray and optical observations allow us to derive that matter located at cm from the burst is about a factor of 10 higher than in the inner region.
Key Words.:
gamma ray: bursts – gamma ray: individual GRB 0507211 Introduction
The Swift Gamma-ray Burst Explorer (Gehrels et al. (2004)) is currently detecting 2–3 gamma-ray bursts (GRBs) per week, distributing coordinates with very small uncertainties (few arcmin down to several arcsec) with delays ranging from few seconds to tens of seconds after the GRB event. Thanks to its fast-pointing capabilities, Swift is able to perform observations of the GRB early afterglow phases, both in the X-ray and ultraviolet/optical bands. Moreover, the prompt Swift alerts also allow follow-up of GRBs with ground-based facilities. In particular the European Southern Observatory (ESO) made its four Very Large Telescope (VLT) units able to quickly react to transient sources, allowing them to repoint and start observations within just 8 min after the trigger, by developing the Rapid Response Mode (RRM) procedure. Before Swift the time needed to determine the GRB position was large and most afterglow measurements could start hours after the burst. Thanks to Swift we can now investigate the characteristics of the very early stages of the afterglow, when the physical properties of the fireball and of the circumburst medium can be derived from the properties of the light curve. Moreover, early observations easily span a long dynamical range in the afterglow lifetime, so that a rich phenomenology can be observed.
Here we report our analysis of GRB 050721, a long, weak burst discovered and located by the Burst Alert Telescope (BAT; Barthelmy et al. (2005)) on board and immediately (186 s after the burst) followed–up with the narrow field instruments: the X-ray Telescope (XRT; Burrows et al. (2005)) and the UV Optical Telescope (UVOT, Roming et al. (2005)). A previously unknown fading X-ray source was detected within the BAT error circle, while no evident optical counterparts were seen in the optical images obtained by UVOT (Antonelli et al. (2005)). The fast accurate localization allowed a 0.3 m robotic telescope, located in New Mexico, to detect the optical afterglow (OA) s after the trigger (Torii (2005)), at the level of mag. The field was also observed by the MISTICI collaboration with the ESO-VLT UT2 telescope operated for the first time in rapid response mode (RRM). The VLT observations started 25 min after the GRB and confirmed the presence of the OA within the XRT error circle (Covino et al. (2005)). Such a prompt identification of the OA allowed a very dense sampling of its light curve at early times, making it one of best examples ever obtained (Testa et al. (2005)). A spectroscopic observation was also performed at VLT but the OA spectrum was heavily contaminated by the contribution of a bright ( mag) foreground star lying very close (1.4″) to the OA. No useful information could be extracted from it.
The OA was extensively observed for several days after the burst with both Swift and the VLT, obtaining a very good multiwavelength coverage.
In the next sections a detailed study of the XRT and the VLT data is presented and discussed.
2 GRB 050721
GRB 050721 was detected by BAT on 2005, July 21 at 04:29:14.3 UT and the BAT on-board calculated location was , (J2000), with an uncertainty of 3′ error radius (90% containment, Antonelli et al. (2005)). The refined BAT ground position was , (J2000), with an error radius of 3′ (90% containment, statistical and systematic). The partial coding was 13% (Fenimore et al. (2005)).
The masked-weighted light curve shows a FRED-like structure with a single large peak starting to rise at s ( being the trigger time), peaking at s and decaying back to background levels by s. The peak is visible in the 15–100 keV energy band, but not at higher energies. The calculated (15–350 keV) is () s (estimated error including systematics).
The power-law photon index of the time-averaged spectrum was . The fluence in the 15–350 keV band was erg cm-2. The 1-s peak photon flux measured from s in the 15–350 keV band was ph cm-2 s-1. All the errors are quoted at the 90% confidence level (Fenimore et al. (2005)).
| Sequence | Obs. mode | Start time | End time | Exposure | Time since trigger |
|---|---|---|---|---|---|
| yyyy-mm-dd hh:mm:ss | yyyy-mm-dd hh:mm:ss | s | s | ||
| 00146970000 | XRT/IM | 2005-07-21 04:32:20 | 2005-07-21 04:32:22 | 2.5 | 186 |
| 00146970000 | XRT/WT | 2005-07-21 04:32:28 | 2005-07-21 05:48:30 | 205 | 194 |
| 00146970000 | XRT/PC | 2005-07-21 04:34:38 | 2005-07-21 05:50:49 | 1291 | 324 |
| 00146970001 | XRT/PC | 2005-07-21 09:00:03 | 2005-07-21 19:01:44 | 8818 | 16249 |
| 00146970003 | XRT/PC | 2005-07-22 00:05:07 | 2005-07-22 23:42:59 | 19169 | 70554 |
| 00146970004 | XRT/PC | 2005-07-23 11:27:27 | 2005-07-24 13:13:58 | 5937 | 197894 |
| 00146970005 | XRT/PC | 2005-08-28 14:50:42 | 2005-08-29 08:52:59 | 8600 | 3320489 |
3 XRT data analysis
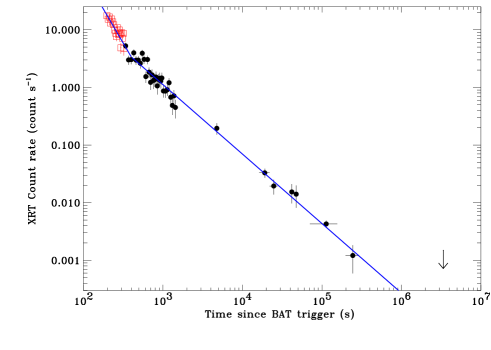
The XRT observations of GRB 050721 started on July 21, 2005 at 04:32:20 UT, only 186 s after the trigger, and ended on July 28 at 08:52:59 UT, thus summing up a total net exposure (in photon counting (PC) mode) of s spread over a d baseline (see Fig. 1). The monitoring was organized in 7 observations. The first one was performed as an automated target (AT) with XRT in auto state. Therefore, during this observation the automated mode switching made XRT take an initial 2.5 s image (IM at s) followed by ( s) a series of windowed timing (WT) frames which were taken until the on-board measured count rate was low enough for XRT to switch to PC mode ( s). After this, XRT remained in PC mode. The log of Swift observations used for this work is summarized in table 1.
The XRT data were processed with the task xrtpipeline (v0.9.9), applying standard calibration and filtering and screening criteria, i.e., we cut out temporal intervals during which the CCD temperature was higher than ∘C, and we removed hot and flickering pixels. An on-board event threshold of 0.2 keV was also applied to the central pixel, which has been proven to reduce most of the background due to either the bright Earth limb or the CCD dark current (which depends on the CCD temperature). For our analysis we further selected XRT grades 0–12 and 0–2 for PC and WT data, respectively (according to Swift nomenclature).
3.1 Spatial analysis
An uncatalogued, fading X-ray source was detected within the BAT error circle. We used the xrtcentroid task (v0.2.7) to derive the afterglow position, obtaining , (J2000). We estimate the uncertainty to be 33 (90% confidence level). This position takes into account the correction for the misalignment between the telescope and the satellite optical axis (Moretti et al. (2005)).
3.2 Temporal analysis
During the first orbit of the XRT observation the intensity of the afterglow was high enough to cause pile-up in the PC mode data. To account for this effect we extracted the source events in an annulus with a 30-pixel outer radius () and a 4-pixel inner radius. For the PC data collected after the first orbit, the entire circular region (30 pixel radius) was used, instead. The WT data were extracted in a rectangular region pixels along the image strip. The selected extraction regions correspond to % (piled-up PC), % (non piled-up PC), and % (WT) of the XRT PSF. To account for the background, data were also extracted in PC mode within an annular region (inner and outer radii of 50 and 100 pixels) centered on the source, and in WT mode within a rectangular box ( pixels) far from background sources. Figure 1 shows the background-subtracted light curve extracted in the 0.2–10 keV energy band, with the BAT trigger as origin of time. The last point is a 3- upper limit. A fit with a broken power law for and for , where is the time of the break, yields slopes and , and a break at s after the BAT trigger (; 52 d.o.f.). The late afterglow (i.e the last 3 observations reported in Table 1) light curve is fitted by a simple power law with .
3.3 Spectral analysis
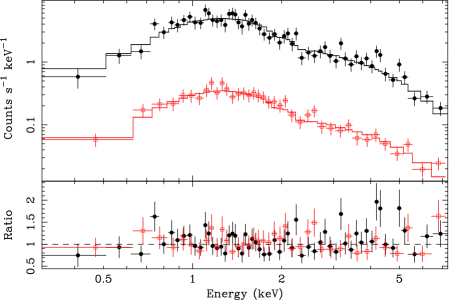
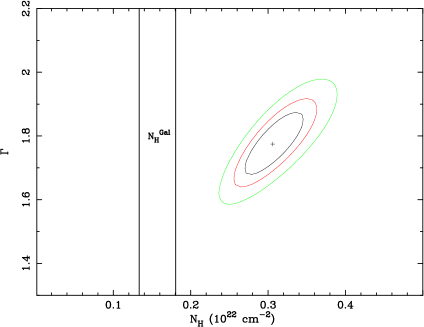
Spectra of the source and background were extracted in both the WT mode and PC mode in the same regions described above at the time corresponding to the first orbit. Ancillary response files were generated with the task xrtmkarf within FTOOLS v6.0.4, and account for different extraction regions and PSF corrections. We used the latest spectral redistribution matrices (RMF, v008). The 0.3–10 keV band spectra were rebinned with a minimum of 20 counts per energy bin to allow the use of and fitted by adopting a simple model of an absorbed power law model, with the Hydrogen column density (at ) kept as a free parameter. In the early part of the observation (first 324 s) the WT mode spectrum yields a photon index and a column density cm-2 (slightly higher than the Galactic value: cm-2; Dickey & Lockman (1990); cm-2: Kalberla et al. (2005)), ; 55 d.o.f. The observed count rate was () cts s-1 corresponding to an unabsorbed flux (0.2–10 keV)=. In the remaining part of the first orbit (324–1450 s) the PC mode spectrum yelds a photon index and a column density cm-2, ; 36 d.o.f. The observed count rate was () cts s-1 corresponding to an unabsorbed flux of (0.2–10 keV)=. In order to enhance statistics, we also performed a simultaneous fit of the WT data and the PC data relevant to the first orbit in the 0.3–10 keV band. A free constant factor was introduced to take into account both the decrease of the mean flux between the WT and PC data and the different size of extraction regions. We obtain a photon index and a column density cm-2, ; 93 d.o.f. (Fig. 2). Figure 3 shows the contour plot of the column density versus the power law photon index, which shows that the column density is higher ( 3- confidence level) than the Galactic value. The PC mode spectrum, obtained by the sum of the last 4 observations (see Tab 1), yields a best fit value of and a column density consistent with the Galactic value (; 18 d.o.f.). The photon index of the late afterglow spectrum, compared with the early afterglow spectrum, observed in the PC mode, shows a possible softening of the photon index by .
4 Optical observations
| Run | Night | UT start | UT end | Filters | Images | Exp. Time [s] | Seeing | Observing Mode |
|---|---|---|---|---|---|---|---|---|
| 1 | 2005 Jul 21 | 04:35:23 | 05:32:31 | 6 | 120 | 1.4″ | Robotic | |
| 2 | 2005 Jul 21 | 04:53:58 | 05:45:21 | 34 | 30 | 0.9″ | VLT+RRM | |
| 3 | 2005 Jul 21 | 06:40:45 | 06:50:35 | , | 2, 4 | 120, 60 | 1.2″ | VLT+ToO |
| 4 | 2005 Jul 22 | 00:47:11 | 04:39:39 | , , | 15, 20, 10 | 60, 10 | 0.6″ | VLT+ToO |
| 5 | 2005 Jul 23 | 02:00:42 | 02:07:41 | 5 | 60 | 1.5″ | VLT+ToO | |
| 6 | 2005 Jul 24 | 00:31:57 | 01:51:58 | , | 10, 20 | 90 | 0.7″ | VLT+ToO |
| 7 | 2005 Oct 06 | 23:49:37 | 00:18:14 | 30 | 900 | 0.65″ | VLT+ToO |
4.1 Prompt observation
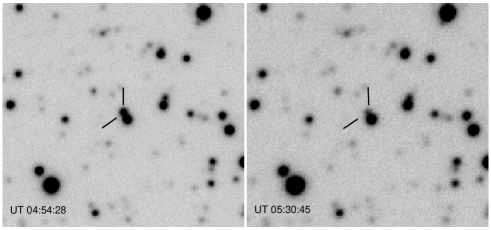
The remotely controlled 0.30m telescope, located in the New Mexico Skies observatory and operated from the Osaka University, observed the field of GRB 050721 starting on 2005 July 21 at 04:35:23 UT (369 s after the burst), collecting 6 frames. A visual comparison of the frames with the DSS and 2MASS images revealed a bright, fading object within the XRT error circle. Due to the large pixel scale (141 per pixel, for a field of view of ) the optical afterglow was indistinguishable from the USNO star (U0616–0429150) at , (J2000), (heareafter star A, see Fig. 4). The contribution from star A was estimated from a second observation performed on 2005 July 25 with the same instrumental configuration and assuming a negligible contribution from the afterglow at that time.
Here we report the first observation only in which the contribution of star A to the afterglow flux was negligible. The observed OA flux was = mag. The field was calibrated using USNO-B1.0 magnitudes and the total systematic error was estimated in absolute photometry as 0.15 mag which is included in the error quoted above.
4.2 Prompt and late VLT observations
VLT optical data were obtained in five series during four nights, as specified in Table 3. The earliest data came from the activation of the rapid response mode, and consist of 33 images in the filter, starting on 2005 Jul 21, 4:54 UT (25 min after the GRB) and lasting 53 min. Since the RRM request also included a spectrum, we used the -band acquisition image for photometry too, hence reaching a total of 34 RRM images in the filter. One hour later, a second series of 4 images in and 2 in were acquired. In the two days after the burst, target-of-opportunity (ToO) observations were activated to extend the light-curve sampling. In total, the optical sample consists of 39 measurements in , 2 in , and 2 in .
| Time since burst | Exp. time | Magnitude | Error |
|---|---|---|---|
| s | s | mag | mag |
| 1484 | 30 | 17.93 | 0.075 |
| 1559 | 30 | 18.00 | 0.075 |
| 1634 | 30 | 18.08 | 0.075 |
| 1710 | 30 | 18.17 | 0.074 |
| 1794 | 30 | 18.21 | 0.074 |
| 1869 | 30 | 18.26 | 0.075 |
| 1945 | 30 | 18.33 | 0.075 |
| 2021 | 30 | 18.39 | 0.073 |
| 2105 | 30 | 18.45 | 0.074 |
| 2181 | 30 | 18.50 | 0.074 |
| 2256 | 30 | 18.55 | 0.074 |
| 2332 | 30 | 18.62 | 0.074 |
| 2415 | 30 | 18.65 | 0.075 |
| 2491 | 30 | 18.70 | 0.074 |
| 2566 | 30 | 18.74 | 0.074 |
| 2642 | 30 | 18.81 | 0.075 |
| 2726 | 30 | 18.94 | 0.075 |
| 2802 | 30 | 18.86 | 0.074 |
| 2878 | 30 | 18.92 | 0.073 |
| 2954 | 30 | 18.95 | 0.074 |
| 3037 | 30 | 18.98 | 0.075 |
| 3113 | 30 | 19.01 | 0.075 |
| 3189 | 30 | 19.05 | 0.075 |
| 3265 | 30 | 19.03 | 0.075 |
| 3348 | 30 | 19.08 | 0.075 |
| 3424 | 30 | 19.12 | 0.077 |
| 3501 | 30 | 19.14 | 0.076 |
| 3577 | 30 | 19.20 | 0.075 |
| 3661 | 30 | 19.18 | 0.074 |
| 3737 | 30 | 19.19 | 0.074 |
| 3813 | 30 | 19.29 | 0.075 |
| 3889 | 30 | 19.35 | 0.077 |
| 3973 | 30 | 19.44 | 0.077 |
| 4537 | 30 | 19.48 | 0.043 |
| 7891 | 240 | 20.28 | 0.077 |
| 73076 | 1000 | 21.58 | 0.016 |
| 78075 | 20 | 21.66 | 0.062 |
| 85946 | 1000 | 21.60 | 0.024 |
| 248595 | 1200 | 22.51 | 0.110 |
| 6721500 | 900 | 25.8 | (5 u.l.) |
4.2.1 Optical data reduction and analysis
The optical afterglow was detected at =, = (J2000), very close (14) to a relatively bright star (=17.4) present in the USNO B1.0 catalog (U0616–0429150), see Fig. 4). In order to avoid any possible contribution from the nearby star, a PSF profile fitting was adopted using DAOPHOT/ALLSTAR (Stetson (1987, 1994)) within IRAF222IRAF is distributed by the National Optical Astronomy Observatories, which are operated by the Association of Universities for Research in Astronomy, Inc., under cooperative agreement with the National Science Foundation. In order to maximize the efficiency in the detection, all the -band images from the RRM run were carefully aligned and averaged together. Since the FWHM varied slightly during the acquisition of the sequence, only the best-seeing frames were used to obtain the average master image. The master was then used to create, with daofind, a list of candidate objects, that was used as input list to process the individual images. Thanks to the good mean seeing conditions, DAOPHOT/ALLSTAR was able to resolve the two components of the pair USNO star/afterglow, providing an excellent PSF fitting. The output photometry lists were then carefully checked for relative zeropoint differences, finding a very good agreement among the measurements without the need of further re-adjustment. All the catalogs from the individual images were translated to a homogeneous coordinate system by transforming pixel coordinates into sky coordinates. The same approach was also used later for the images obtained in the other ToO series. Magnitudes and, where applicable, colors have been obtained for all the objects in the master candidate list. FORS 1 and FORS 2 data have been later matched by transforming all the image coordinates to sky coordinates, obtaining a homogeneous catalog. Image calibration was obtained after applying aperture corrections to the measured objects; calibration relations derived from standard star observations were applied. Standard stars were observed all nights and the calibrations were performed with the IRAF package photcal. Color terms have been fitted against the available magnitudes, i.e. for the and bands, and for the band, and were found to be very small (+0.015 for , for ). Since the standards (Landolt fields PG 1323-086 and SA 110) were observed only once per night, we used the mean extinction coefficients for Paranal.
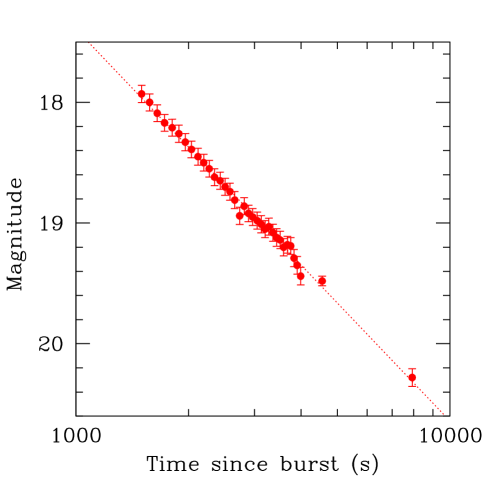
The VLT prompt observations, obtained in RRM, provided a very well sampled light curve. The observed light curve shows the typical fading behavior for GRB afterglows well described by a simple power law () with a slope which is in good agreement with the X-ray slope during the same time interval (see Fig. 6). A late point, obtained at the end of the night ( s after the burst and s after the first point), is well aligned along the early curve. The optical light curve is smoothly decaying and it does not show any significant flaring activity. GRB 050721 was also observed during the second night starting about 20 hr after the burst. We collected our data set in three different images in which the afterglow is still clearly detected and we found it about mag brighter than the value predicted by extrapolating the first night data set. Such a rebrightening was also observed in the following two observations, obtained respectively 45 and 69 hr after the burst. Moreover if we consider these two points only we obtain a power law decay with a steeper slope () but still consistent with the previous one given the large error. A late deep observation (2.5 months later) did not reveal either an afterglow or a host galaxy down to a limiting magnitude of mag (5). We can conclude that the observed flattening was not due to the emergence of the host galaxy, but that a rebrightening was present in the afterglow.
5 Results and discussion
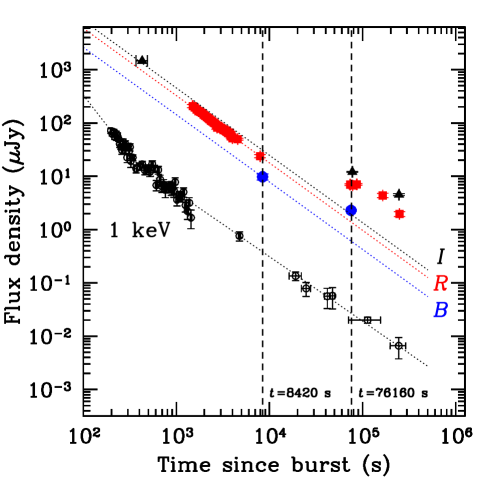
GRB 050721 was promptly observed in both the X-ray and optical bands and it was accurately monitored for several days after the burst. Such a long term multiwavelength monitoring showed a different behavior in the X-ray and optical light curves. Thanks to Swift, it is now well known that the early X-ray light curves of a large fraction of the bursts are characterized by a steep decay, followed by a shallower phase and finally a somewhat steeper decay (Tagliaferri et al. (2005); Nousek et al. (2006); O’Brien et al. (2006)). Many events have superimposed X-ray flares, probably still related to the central engine (Burrows et al. (2005); Falcone et al. (2006); Romano et al. (2006); Zhang et al. (2006); Guetta et al. (2006)). In the case of GRB 050721 we did not detect flares in the X-ray light curve, while we saw the early steep decay, although not one of the steepest so far seen by XRT, followed by a shallower phase at about 400 s after the burst. We also did not see a second break in the 0.2–10.0 keV light curve, which in fact shows a regular fading behaviour up to a time interval of about one week, that can be fitted with a simple power law () yielding a slope of on the entire observation. The optical light curve shows the same regular fading behavior over a time interval of about 7000 s with the same power law () then, at about 24 hours after the burst, a rebrightening of about 1.8 mag is observed.
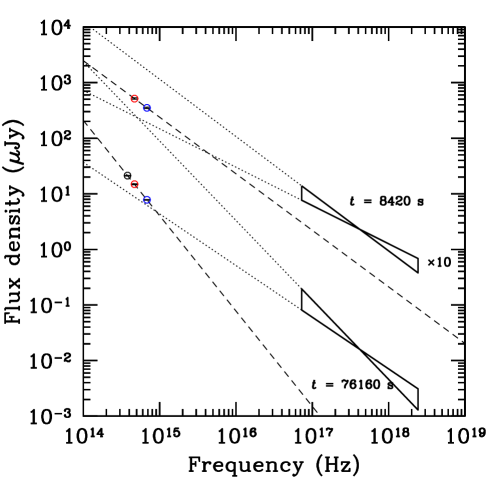
The consistency between the early optical and X-ray decay indices suggests that both emissions result from the same component during the first hours after the GRB. This fact can be futher confirmed by looking at the broadband spectral energy distribution (SED). Figure 7 shows the SED at two times, chosen during the initial decay phase and during the optical bump. At the first epoch, the optical data agree well with the extrapolation of the X-ray spectrum. The optical color ( mag) also provides a spectral index , after correcting for the significant Galactic extinction ( mag, mag; Schlegel et al. 1998). This value, given its large uncertainty, is consistent with that observed in the X-ray range (), and with the broad-band optical-to-X-ray slope (). The picture is therefore consistent with the optical and X-ray emission lying on the same segment of a power-law SED, with slope . Thus, no synchrotron breaks were present between the two bands. Moreover, the extinction affecting the optical data was likely small.
The spectral and temporal properties of the afterglow of GRB 050721 during the first hours are consistent with a fireball expanding inside a uniform external medium (Sari, Piran, & Narayan, (1998)), providing that the cooling frequency lies blueward of the X-ray band. For a spectral index , the predicted decay slope is , in very good agreement with the observed values both in the optical and in the X-ray band (their average being ). The inferred electron distribution index is computed as , or, alternatively, . Such value is not uncommon among GRB afterglows.
The situation changes substantially starting d after the GRB. At this time, the optical flux is significantly brighter than predicted by the early-time decay and the optical spectrum is softer () than observed at earlier time, and steeper than usually observed in GRB afterglows. Both the flux and SED suggest that a new mechanism is powering the optical emission, leaving unaffected the X-ray region.
Among the possible explanations for a bump in the optical light curve, we consider the emergence of an additional energy source like a supernova (SN). It is now well established that long duration GRBs (or a significant fraction of them) are produced in SN explosions (Galama et al. (1998); Stanek et al. (2003); Hjorth et al. (2003); Malesani et al. (2004)). Sometime bumps have been detected during the afterglow decay days/weeks past the GRB (e.g. Bloom et al. (1999); Della Valle et al. (2006)). However, the bump associated with GRB 050721 rose very quickly, only d after the gamma event, which is much shorter than the observed rising time of SNe-Ibc (10-20 days, e.g. Hamuy, (2003)). One possibility is that the SN has occurred before the GRB, as advocated in the Supranova model (Vietri & Stella (1999)). An analysis of the present data suggest that SNe and GRBs go off simultaneously (Della Valle et al. (2005)), nevertheless a few days of delay between SN and GRB events can be yet accommodated within the uncertainties. The major caveat for this hypothesis is represented by the magnitude of the bump (). For a SN as bright as SN 1998bw (; Galama et al. (1998)), the inferred redshift would be . This would be difficult to reconcile with the nondetection of any host galaxy (our limit would correspond to at this redshift). A fainter SN would imply a distance even smaller. We thus consider this hypothesis unlikely.
A more exotic possibility calls for the mini-SN scenario (Li & Paczyński (1998)), which evolutionary timescale is comparable to that of the rebrightening (1–2 d). However this scenario would suffer a problem similar to the one faced by a conventional SN, since the peak magnitude is expected to be comparable to that of a SN.
A plausible explanation for the rebrightening could be given by modifications in the afterglow physics: rebrightenings due to energy injection (e.g. refreshed shock, Guetta et al. (2006)) or fluctuations in the external medium. In the refreshed shock scenario flux fluctuations in both the X-ray and optical bands are expected to be proportional to energy fluctuations of the fireball. Therefore, a bump in both the optical and X-ray light curves is expected. The lack of a rebrightening in the X-ray band rules out this hypothesis.
In the case of fluctuations in the external medium, we expect a bump in the optical light curve (but not in the X-ray one) when the fireball encounters regions with enhanced density (e.g. Lazzati et al. (2002); Berger et al., (2000)). Such a density jumps may be caused by winds termination shock, as proposed for the case of GRB 030329 (Huang et al. (2006)). Nakar, Granot & Piran (2003) have shown that the afterglow flux at different frequencies may be written in terms of the external density in a very simple way. Assuming the typical afterglow parameters, the synchrotron cooling frequency at d from the burst is expected to be Hz (just between optical and X-ray band). Our data on the late X-ray afterglows of GRB 050721 cannot exclude (within uncertainties) both a steepening in the light curve () and a softening of the photon index (), that are compatible with the hypothesis that is shifted to energies lower than the X-ray band at this epoch. In such a case the X-ray flux () is weakly dependent on the external medium density , while the optical flux ( ) is (Nakar et al. (2003)). Since we see a rebrightening only in the optical band () and not in the X-ray band () we can conclude that this is an evidence of fluctuations in the external medium. In particular we can derive an estimate of the variation in the density from the fluctuations in the flux .
However, the optical flux at the second epoch shows a redder spectral distribution than what expected by adopting a simple synchrotron model with parameters extrapolated by the X-ray flux. A possible explanation for such a red spectrum is that the high-density region could be composed of very dense clumps, with a covering factor . In such a scenario, the rebrightening observed in the optical band may be due to the interaction of the fireball with the clumps. Dust in the clumps may survive the intense radiation field, so that the spectrum produced inside them emerges reddened. Since the optical flux did not suffer significant extinction, since only a fraction was intercepted by the high-density clouds.
6 Conclusions
We have presented a comprehensive multiwavelength study of the afterglow of GRB 050721 based on RRM and ToO observation with the VLT, early robotic observations and Swift XRT data. Both the X-ray and optical light-curve are very well sampled and showed a regular fading behavior (with almost the same decay index) within 24 hrs after the burst. At about one day from the burst a remarkable (1.8 mag) rebrightening is observed in the optical afterglow, while no variations are observed in the X-ray light curve at the same epoch. A late optical observation (2.5 months after the burst) did not show any afterglow or host galaxy down to a limiting magnitude of 25.8 (5) confirming that the observed rebrightening was not due to the presence of a bright host galaxy. The broad band SED obtained at two different epochs, during the initial decay and during the rebrightening, suggests that during the second epoch a new mechanism is powering the optical emission, leaving unaffected the X-ray region. Many different scenarios are considered in order to explain such a peculiar rebrightening. Since the rebrightening was observed only in the optical band and not in the X-ray band we propose that this is a plausible evidence of fluctuations in the external medium and we derive an estimate of the variation in the density from the fluctuations in the flux . In order to take into account an optical spectral distribution redder than what expected by adopting a simple synchrotron model, we suggest that the observed rebrightening may be due to the interaction of the fireball with a high-density region composed by very dense clumps, with a covering factor .
Acknowledgements.
This work is supported at OAR, OAB and IFC-PA by funding from ASI on grant number I/R/039/04, at Penn State by NASA contract NAS5-00136 and at the University of Leicester by the PPARC on grant numbers PPA/G/S/00524 and PPA/Z/S/2003/00507. This research was supported in part by the National Science Foundation under Grant No. PHY99-0794. We also thank Alex Kann and an anonymous referee for their helpful comments. We gratefully acknowledge the support from the Swift team and from the ESO VLT staff.References
- Antonelli et al. (2005) Antonelli, L.A., Page, K., Morris, D., et al. 2005, GCN 3654
- Barthelmy et al. (2005) Barthelmy, S., Barbier, L.M., Cummings, J.R., et al. 2005, Space Sci. Rev., 120, 143
- Beloborodov (2003) Beloborodov, A.M. 2003, ApJ, 585, L19
- Berger et al., (2000) Berger, E. et al., 2000, ApJ, 545, 56
- Bloom et al. (1999) Bloom, J.S., Kulkarni, S.R., Djorgovski, S.G., et al. 1999, Nature, 401, 453
- Burrows et al. (2005) Burrows, D.N., Hill, J.E., Nousek, J.A., et al. 2005, Space Sci. Rev., 120, 165
- Burrows et al. (2005) Burrows, D.N., Hill, J.E., Chincarini, G., et al. 2005, ApJ, 622, L85
- Covino et al. (2005) Covino, S., D’Avanzo, P., Bagnulo, S., et al. 2005, GCN 3656
- D’Avanzo et al. (2005) D’Avanzo, P., Covino, S., Malesani, D., et al. 2005, GCN 3658
- Della Valle et al. (2005) Della Valle, M., 2005, in the Proceedings of the 4th Workshop Gamma-Ray Bursts in the Afterglow Era, Rome, 18-22 October 2004. Editors: L. Piro, L. Amati, S. Covino, and B. Gendre. Il Nuovo Cimento, 28, 563
- Della Valle et al. (2006) Della Valle, M., Malesani, D., Bloom, J.S., et al. 2006, ApJ, submitted
- Dickey & Lockman (1990) Dickey, J.M., & Lockman, F.J. 1990, ARA&A, 28, 215
- Fan et al. (2005) Fan, Y.Z., Zhang, B., & Wei, D.M. 2005, ApJ, 628, 298
- Falcone et al. (2006) Falcone, A., Burrows, D.N., Lazzati, D., et al. 2006, ApJ, in press (astro-ph/0512615)
- Fenimore et al. (2005) Fenimore, E., Barbier, L., Barthelmy, S., et al. 2005, GCN 3661
- Fox et al. (2003) Fox, D., Yost, S., Kulkarni, S.R., et al. 2003, Nature, 422, 284
- Galama et al. (1998) Galama, T.J., Vreeswijk, P.M., van Paradijs, J., et al. 1998, Nature, 395, 670
- Gehrels et al. (2004) Gehrels, N., Chincarini, G., Giommi, P., et al. 2004, ApJ, 611, 1005
- Guetta et al. (2006) Guetta, D., Fiore, F., D’Elia, V., et al., 2006, A&A, submitted (astro-ph/0602387)
- Hamuy, (2003) Hamuy, M. 2003, in the Proceedings of Core Collapse of Massive Stars”, Ed. C.L. Fryer, Kluwer, Dordrecht (astro-ph/0301006)
- Henden (2000) Henden, A. 2000, Journ. AVSO, 29, 35
- Hjorth et al. (2003) Hjorth, J., Sollerman, J., Møller, P., et al. 2003, Nature, 423, 847
- Huang et al. (2006) Huang, Y.F., Cheng, K.S., & Gao, T.T., 2006, ApJ, 637, 873.
- Kalberla et al. (2005) Kalberla, P.M.W., Burton, W.B., Hartmann, D., et al. 2005, A&A, 440, 775
- Lazzati et al. (2002) Lazzati, D., Rossi, E., Covino, S., Ghisellini, G., & Malesani, D. 2002, A&A, 396, L5
- Li & Paczyński (1998) Li, L.-X., & Paczyński, B. 1998, ApJ, 507, L59
- Malesani et al. (2004) Malesani, D., Tagliaferri, G., Chincarini, G., et al. 2004, ApJ, 609, L5
- Mazzali et al. (2002) Mazzali, P.A., Deng, J., Maeda, K., et al. 2002, ApJ, 572, L61
- Moran & Reichart (2005) Moran, J.A., & Reichart, D.E. 2006, ApJ, 632, 438
- Moretti et al. (2005) Moretti, A., Perri, M., Capalbi, M., et al. 2005, A&A, 448, L9
- Nakar et al. (2003) Nakar, E., Piran, T., & Granot, J. 2003, New Astr., 8, 495
- Nousek et al. (2006) Nousek, J.A., Kouveliotou, C., Grupe, D., et al. 2006, ApJ, in press (astro-ph/0508332)
- O’Brien et al. (2006) O’Brien, P.T., Willingale, R., Osborne, J., et al. 2006, ApJ, submitted (astro-ph/0512615)
- Romano et al. (2005) Romano, P., Antonelli, L.A., Chincarini, G., et al. 2005, GCN 3659
- Romano et al. (2006) Romano, P., et al. 2006, ApJ, in press (astro-ph/0601773)
- Roming et al. (2005) Roming, P.W.A., Kennedy, T.E., Mason, K.O., et al. 2005, Space Sci. Rev., 120, 95
- Sari, Piran, & Narayan, (1998) Sari, R., Piran, T., & Narayan, R. 1998, ApJ, 497, L17
- Sari & Mészáros (2000) Sari, R., & Mészáros 2000, ApJ, 535, L33
- Schegel et al. (1998) Schlegel, D.J., Finkbeiner, D.P., & Davies, M. 1998, ApJ, 500, 525
- Stanek et al. (2003) Stanek, K.Z., Matheson, T., Garnavich, P.M., et al. 2003, ApJ, 591, L17
- Stetson (1987) Stetson, P.B.E. 1987, PASP, 99, 191
- Stetson (1994) Stetson, P.B., 1994, PASP, 106, 250
- Tagliaferri et al. (2005) Tagliaferri, G., Goad, M., Chincarini, G., et al., 2005, Nature, 436, 985
- Testa et al. (2005) Testa, V., Antonelli, L.A., Malesani, D., et al. 2005, GCN 3662
- Torii (2005) Torii, K. 2005, GCN 3655
- Vietri & Stella (1999) Vietri, M., & Stella, L. 1999, ApJ, 527, L43
- Waxman & Draine (2000) Waxman, E., & Draine, B.T. 2000, ApJ, 537, 796
- Zhang et al. (2006) Zhang, B., Fan, Y., Dyks, J., et al. 2006, ApJ, in press (astro-ph/0508321)