Nearby debris disk systems with high fractional luminosity reconsidered
Abstract
By searching the IRAS and ISO databases we compiled a list of 60 debris disks which exhibit the highest fractional luminosity values () in the vicinity of the Sun ( pc). Eleven out of these 60 systems are new discoveries. Special care was taken to exclude bogus disks from the sample. We computed the fractional luminosity values using available IRAS, ISO, and Spitzer data, and analysed the galactic space velocities of the objects. The results revealed that stars with disks of high fractional luminosity often belong to young stellar kinematic groups, providing an opportunity to obtain improved age estimates for these systems. We found that practically all disks with are younger than 100 Myr. The distribution of the disks in the fractional luminosity versus age diagram indicates that (1) the number of old systems with high is lower than was claimed before; (2) there exist many relatively young disks of moderate fractional luminosity; and (3) comparing the observations with a current theoretical model of debris disk evolution a general good agreement could be found.
1 Introduction
One of the major discoveries of the IRAS mission was that main-sequence stars may exhibit excess emission at infrared (IR) wavelengths (”Vega-phenomenon”, Aumann et al. 1984). Systematic searches in the IRAS catalogues (Backman & Paresce 1993; Mannings & Barlow 1998; Silverstone 2000; Zuckerman & Song 2004a, and references therein) revealed that % of main-sequence stars show infrared excess (Plets & Vynckier, 1999). It was suggested already after the first discovery that the excess can be attributed to thermal emission of dust confined into a circumstellar disk (Aumann et al., 1984). The existence of such debris disks was first confirmed by the coronographic observation of scattered light from the Pic system (Smith & Terrile, 1984). Subsequent imaging of specific systems at mid-infrared (e.g. HR 4796A, Koerner et al. 1998) and submillimeter wavelengths (e.g. Eri, Holland et al. 1998) supported this picture.
The possibility that debris disks might evolve over time was first mentioned by Backman & Gillett (1987) who proposed that disks around Vega, Eridani, and Fomalhaut could be more evolved analogs of the Pic system. Using submillimeter measurements of the best known Vega-like stars Holland et al. (1998) showed that the derived dust mass of the disks decay with stellar age as a power-law. Subsequent studies with the Infrared Space Observatory (ISO, Kessler et al. 1996) demonstrated that debris disks are more common around young stars ( Myr) than around old ones and there is a trend for older debris disks to be less massive than younger ones (Habing et al., 2001; Spangler et al., 2001; Silverstone, 2000). The evolutionary picture was further refined by Decin et al. (2003), who reinvestigated the ISO results and revised the stellar age estimates. Recently Rieke et al. (2005) presented a survey of A-type stars, performed at 24 with the Multiband Imaging Photometer for Spitzer (MIPS, Rieke et al. 2004) onboard the Spitzer Space Telescope (Werner et al., 2004), and observed a general decay on a timescale of 150 Myr.
A new generation of theoretical models has been developed to explain the temporal evolution of debris disks (Kenyon & Bromley, 2002; Dominik & Decin, 2003; Kenyon & Bromley, 2004). These models take into account the fact that the destruction timescales of dust grains orbiting main-sequence stars are significantly shorter than the age of the central star, therefore the observed dust grains in a debris disk must be continuously replenished (Backman & Paresce, 1993). Collisional erosion of minor bodies in exosolar analogs of our Solar System or the sublimation of comets are the best explanations for the replenishment process (Harper et al., 1984; Backman & Paresce, 1993). Most recent models link the temporal evolution of debris disks to the formation and erosion of planetesimals (Kenyon & Bromley, 2002, 2004).
The amount of dust in a debris disk is usually characterised by its fractional luminosity, , defined as the ratio of integrated infrared excess of the disk to the bolometric luminosity of the star. Despite the general evolutionary trend described above, fractional luminosity values of individual systems were found to show a large spread of at almost any age (Decin et al., 2003). Rieke et al. (2005) also found large variations of the IR excess around A-type stars within each age group. They emphasized the role of individual collisional events between large planetesimals as one of the possible explanations of their result.
Particularly interesting is the relatively high number of older systems (t500 Myr) with high fractional luminosity values (). These systems pose a serious challenge even to the new generation of theoretical models. A qualitative explanation for the existence of debris disks with large values around old stars was suggested by Dominik & Decin (2003). According to their theory, different planetesimal disks become active debris systems at different ages, because of the delayed onset of collisional cascades.
The presence of relatively old systems with high fractional luminosity, however, might partly be an observational artifact, since several factors could bias the distribution of debris disks on the vs. diagram. Some stars have been nominated as Vega-candidates due to erroneous infrared photometric measurements, confusion by background sources, or the presence of extended nebulosity (where the IR emission is of interstellar rather than of circumstellar origin). In order to obtain a reliable picture of debris disk evolution these misidentifications (”bogus disks”) have to be found and discarded. The actual positions of confirmed debris disks in the vs. diagram might also be biased by measurement errors in the far-infrared photometry and even more significantly uncertainties in the age determination.
In this paper we study a sample of debris disks which exhibit the highest fractional luminosity values in the solar neighbourhood. Setting a threshold value of and a distance limit of 120 pc we compiled a list of 60 disks, and performed an accurate determination of their infrared excess using IRAS, ISO, and Spitzer data (Sect. 2). In Sect. 3 we present improved age estimates for a large number of stars, derived e.g., by determining their membership in young moving groups. In Sect. 4 we analyze the distribution of the disks in the vs. diagram and find a significant fraction of our sample to be younger than was previously thought. Our conclusions are summarised in Sect. 5. In Appendix A. we list bogus disks identified in our work. Appendix B. lists new members of young moving groups discovered in the present study.
2 Sample selection
We created the input list for this study by: (1) identifying debris disk candidates in the IRAS and ISO databases; (2) rejecting bogus debris disks and suspicious objects; (3) computing infrared fractional luminosity values and selecting disks with .
2.1 Searching the IRAS catalogues for stars with infrared excess
With the aim of compiling a list of main-sequence stars with IR excess, we made a systematic search in the IRAS Faint Source Survey Catalog (FSC, Moshir et al. 1989) and in the IRAS Serendipitous Survey Catalog (SSC, Kleinmann et al. 1986). In order to reduce source confusion, our survey was confined to Galactic latitudes. We selected all infrared sources with at least moderate flux quality at 25 or 60, and their positions were correlated with entries from the Hipparcos Catalogue (ESA 1997) and the Tycho-2 Spectral Type Catalogue (Wright et al., 2003). Positional coincidences within 30 arcsec were extracted. In order to assure that the selected objects are not giant stars, the luminosity class was constrained to IV-V in the Hipparcos, and to V in the Tycho catalogue. We also included several objects whose luminosity class was not available in the Hipparcos catalogue but their absolute magnitudes indicated a main-sequence evolutionary phase. Since the infrared excess from early B-type stars might be due to free-free emission (Zuckerman, 2001) the sample was limited to spectral types later than B9 in both catalogues. Our query is similar to that of Silverstone (2000) but – since we also considered the IRAS 25 band – it is also sensitive to stars with excess from warmer dust disk.
Following the principles of the method by Plets & Vynckier (1999), for each selected star we predicted the far-infrared flux density of the stellar photosphere using the -band magnitude (or V-band, when good quality photometry was not available) and the B–V color index. -band photometry was drawn from the Two Micron All Sky Survey (2MASS) catalog (Cutri et al., 2003), V magnitudes and B–V color indices were taken from the Hipparcos and Tycho Catalogues. As a first step a photospheric 25 flux density was derived from the magnitude and the B–V color of the star using the collection of stellar model predictions by M. Cohen and P. Hammersley (available on the ISO Data Centre home page). Then, color relationships predicting the photospheric flux ratios between 25 and a selection of IRAS, ISO, and Spitzer photometric bands were also derived from the same stellar models. The average accuracy of the predicted far-infrared fluxes is estimated to be around 4% when computed from the -magnitudes, and 8% when computed from V-magnitudes.
In order to compute IR excess values the predicted photospheric flux densities were subtracted from the measured flux densities in each IRAS band. In principle the IRAS fluxes have to be color corrected since the shape of the spectral energy distribution of the system usually differs from the reference spectrum (this spectral shape was assumed while the flux densities quoted in the IRAS catalogues were derived from the detector in-band powers). Since the true spectrum of the system is not known a priori, we decided to multiply the predicted photospheric fluxes – rather than dividing the IRAS flux densities – with color correction factors appropriate for a stellar photosphere (IRAS Explanatory Supplement, Beichman et al. 1988). The significance level of the infrared excess was calculated in each photometric band with the following formula:
| (1) |
where is the quoted uncertainty in the FSC or SSC, and is the uncertainty of the prediction described above. When was greater than 3 either in the 25 or 60 bands, the object was selected as a excess candidate star. Applying the above criteria we identified in total 355 excess candidate stars in the IRAS databases.
2.2 ISO-based selection of stars with infrared excesses
In a second step the IRAS-based list was supplemented with excess stars selected from the ISO databases. The Vega-phenomenon was a key programme for ISO (see Sect. 1) and a number of stars have been observed with ISOPHOT, the onboard photometer (Lemke et al., 1996). We collected all ISOPHOT observations of normal stars from different observers performed in mini-map, sparse-map or staring mode (a detailed description of these observing modes is given in The ISO Handbook Vol. IV, Laureijs et al. 2003), and performed a homogeneous re-evalution of the whole sample (Ábrahám et al. 2003; Ábrahám et al., 2006, in prep.). For details of the data analysis and criteria for candidate excess stars, see Ábrahám et al. (2006, in prep.). We note that most selected candidates have already been published by the original observers (Decin et al., 2000; Habing et al., 2001; Spangler et al., 2001; Silverstone, 2000), but due to their different processing schemes the published flux densities cannot be directly merged for a homogeneous catalogue. The merged IRAS- and ISO-based lists includes altogether 364 IR excess stars.
2.3 Rejection of suspicious objects
Since our goal is to compile a list of debris disks, we excluded all known young stellar objects (e.g. T Tauri or Herbig Ae/Be stars) which harbour protoplanetary disks. The sample could also be contaminated by source confusion: due to the low spatial resolution of IRAS at far-IR wavelengths, many of the positional coincidences between a star and a far-IR source could be bogus and the far-IR emission is related to a foreground or background object.
For part of the sample (110 stars) higher spatial resolution infrared maps are available, obtained either by the ISOPHOT or the MIPS instrument. We downloaded ISOPHOT data from the ISO Data Archive (IDA) and processed with the Phot Interactive Analysis (PIA) version 10.0 (Gabriel et al., 1997). MIPS Basic Calibrated Data (BCD) files were downloaded from the Spitzer Science Center (SSC) data archive. These latter products are composed of 2-dimensional FITS image files which included all general calibrations and corrections for MIPS detectors (Gordon et al., 2005). In each case these data were coadded and corrected for array distortions with the SSC MOPEX (MOsaicking and Point source Extraction, Makovoz & Marleau 2005) software. Bad data flagged in the BCD mask files, as well as permanently damaged pixels flagged in the static pixel mask file were ignored during the data combination. Output mosaics had pixels with size of 2.5′′ at 24 and 4′′ at 70. SSC MOPEX/APEX software package was used to detect sources and determine their positions on the final maps.
The positions of the infrared sources were determined on the ISO and Spitzer maps and objects whose coordinates differed from the optical position (and in some cases coincided with a nearby background object), and/or associated with extended nebulosity, were discarded from the list. For positional discrepancy the threshold value was set to half of the width of a point source’s footprint. In the case of ISOPHOT the large pixel size dominated the footprint and in the 60–100 range the threshold was 23′′. In the case of MIPS arrays footprint was defined by the telescope Point Spread Function and we adopted threshold values of 3′′ and 9′′ at 24 and 70, respectively. The absolute pointing uncertainty was less than these values for both satellites. In total 24 disk candidates were dropped from the list.
When neither ISO nor Spitzer maps were available we made an attempt to filter out bogus disks by assuming that an object is possibly affected by source confusion if:
-
•
a known galaxy or evolved star (OH/IR source, Mira variable) is located within 1 arcmin of the IRAS position;
- •
-
•
a 2MASS source with an excess in the band (identified in the vs. diagram in comparison with the locus of the main-sequence and taken into account the reddening path) is located within 1 arcmin of the IRAS position;
-
•
the 60-to-100 flux ratio of the candidate source resembles the color of infrared cirrus , which correspond blackbody temperatures lower than K ). At least moderate flux quality flags were required in both IRAS bands.
These cases were also discarded from our list of debris disk candidates (48 objects).
In an earlier study, Kalas et al. (2002) used high-angular resolution coronographic observations at optical wavelengths and found cases where the far-infrared excess observed by IRAS was of interstellar – rather than circumstellar – origin (”Pleiades-phenomenon”), leading to false entries in the Vega-candidate lists. They also suggested that a significant fraction of Vega-candidates beyond the Local Bubble might be bogus, since the star illuminates nearby interstellar matter rather than a circumstellar disk. After checking the positions of our sources projected on recent maps of the Local Bubble (Lallement et al., 2003), we discarded all objects situated in the wall of the bubble or beyond. The wall was defined as the isocontours corresponding to the 50 NaI D2-line equivalent widths in the maps. In practice nearly all of our sources beyond 120 pc were removed, while within this radius only a few were dropped. Thus we defined a maximum distance limit of 120 pc for our stars, constructing a nearly complete volume-limited sample.
2.4 The list of disks with high fractional luminosity
In order to compute fractional luminosity values for each candidate star, we constructed spectral energy distributions by combining infrared fluxes from the FSC, SSC, ISOPHOT (re-evaluated by us, see Ábrahám et al., 2006, in prep.) and additional MIPS and submillimeter fluxes from the literature. The excess above the predicted photosphere was fitted by a single temperature modified blackbody, where the emissivity was assumed to vary as where was set to 100m (see e.g. Williams et al., 2004). We fixed equal to 1, which is a typical value in the case of debris systems (Dent et al., 2000). If the excess was detected at one wavelength only, we adopted a modified blackbody whose peak (in ) coincided with that single wavelength. From the fitted spectral shape color correction factors were computed and applied to the data. Then again a modified blackbody was fitted resulting in new color correction factors, and this procedure was repeated until the color correction factors converged. Finally, the fractional dust luminosity was calculated as . In order to estimate the uncertainties on our fractional luminosity values we performed a Monte Carlo simulation. We added Gaussian noise to the photometric data points using their quoted 1 photometric errors and then recomputed the fractional dust luminosities. Formal uncertainties of the predicted theoretical photospheric fluxes were also taken into account. Final uncertainties were derived as the standard deviation of these values after 1000 repetitions. We note that these values include only random uncertainties; systematic errors due to e.g. limited wavelength coverage are not taken into account.
Artymowicz (1996) argued that debris disks are confined to and sources with higher fractional luminosity probably contain a significant amount of gas (e.g. T Tau and Herbig Ae/Be stars, ”transition” objects). Therefore we excluded objects with from our sample. Then the remaining sample was sorted by decreasing values and stars with (60 stars) were taken for the further analysis presented in this paper.
Basic stellar parameters for these 60 objects, as well as derived fractional luminosities and their uncertainties, are presented in Table Nearby debris disk systems with high fractional luminosity reconsidered. Infrared data used in our analysis, including both the original flux values as listed in the catalogues or provided by our reduction algorithm, as well as corrected fluxes, where color correction was applied, are given in Table Nearby debris disk systems with high fractional luminosity reconsidered. The table also contains photospheric flux predictions for the specific wavelengths. Inspecting the flux density values obtained by different instruments at the same wavelength (e.g. IRAS and ISOPHOT at 60m) one finds discrepancies which may arise e.g. from the different beams and different calibration strategies of the instruments. Comparing the IRAS and ISOPHOT flux values in Table Nearby debris disk systems with high fractional luminosity reconsidered a general good agreement within 1 was found, with no deviations above the 3 limit (the uncertainty was computed as the quadratic sum of quoted uncertainties from the two instruments). We also compared our ISOPHOT flux densities with the results of earlier evaluations of the same observations in the literature. In most cases the results were consistent (except HD 10647 and HD 53143 where Decin et al. (2000) derived significantly higher values at 60m; the probable explanation is that we used a more advanced version, V10.0, of the PIA software).
As was discussed in Sect. 2.1, during the analysis we rejected several systems as bogus disks or suspicious objects. Those rejected stars which were previously proposed to harbour debris disks in the literature and would have been included in our final list (on the basis of their quoted fractional luminosity in the original paper) are presented in Appendix A. together with a brief description of the reason of rejection.
3 Age determination
3.1 Membership in young moving groups
Age determination for main-sequence field stars is challenging, and sometimes results in very uncertain values. Ages of open cluster members, however, can be estimated more accurately e.g. by fitting their main-sequence locus in the color-magnitude diagram with theoretical isochrones or by determining the location of the ”lithium depletion edge” in the cluster and comparing it with the predictions of theoretical evolutionary models. A number of young clusters ( Per, Pleiades, Hyades etc.) have been dated so far (Meynet et al., 1993; Stauffer et al., 1998). Similarly, the ages of young stellar kinematic groups, discovered mainly in recent years, are relatively well determined (e.g. Zuckerman & Song 2004b). It was a very important result that several stars with the strongest infrared excess turned out to be members of such moving groups, and in some cases the ages of these stars had to be revised significantly (e.g. the case of Pic, Barrado y Navascués et al. 1999). In order to obtain more reliable ages for our sample, we performed a systematic investigation of the possible relationship between our excess stars and nearby kinematic moving groups, stellar associations or open clusters.
A common method to decide whether an object belongs to a moving group is to compare its Galactic space velocity components with the mean velocity components of the group. In order to compute the space velocity for the stars in Table Nearby debris disk systems with high fractional luminosity reconsidered, we collected parallaxes and proper motions from the Hipparcos and Tycho-2 catalogues. When accurate parallax information was not available, a photometric distance was adopted.
Radial velocities were taken from the literature (see Table Nearby debris disk systems with high fractional luminosity reconsidered for references), or from our own observations. The new observations were carried out with the 2.3m ANU-telescope at the Siding Spring Observatory, Australia, on 11 nights between 21 March and 22 August 2005. The spectra were taken with the Double Beam Spectrograph using a 1200mm-1 grating in the red arm. The recorded spectra covered 1000 Å between 5800–6800 Å, with a dispersion of 0.55 Åpx-1. This leads to a nominal resolution of about 1 Å. The exposure time ranged between 30 s and 200 s depending on the brightness of the target and the weather conditions. We obtained on average 4–7 spectra for each star. Since all the target stars are bright objects (V10 mag), we could easily reach S/N150–200 for every spectrum. All spectra were reduced with standard tasks in IRAF111IRAF is distributed by the National Optical Astronomy Observatories, which are operated by the Association of Universities for Research in Astronomy, Inc., under cooperative agreement with the National Science Foundation.. Reduction consisted of bias and flat field corrections, aperture extraction, wavelength calibration and continuum normalization. We did not attempt flux calibration because the conditions were often non-photometric and the main aim was to measure radial velocities. Radial velocities were determined by cross-correlation, using the IRAF task fxcor, choosing HD 187691 as a stable IAU velocity standard. The cross-correlated region was 100 Å centered on the H line, which is far the strongest spectral feature in our range. The finally adopted velocities were calculated as simple mean values of the individual measurements. Our experiences have shown that the typical measurement errors were about 4–7 km s-1 per point, so that the mean values have 1–3 km s-1 standard deviations. These were adopted as the uncertainties shown in Table Nearby debris disk systems with high fractional luminosity reconsidered.
In the calculation of the Galactic space velocity we used a right-handed coordinate system (U is positive towards the Galactic centre, V is positive in the direction of galactic rotation and W is positive towards the North galactic pole) and followed the general recipe described in ”The Hipparcos and Tycho Catalogues” (ESA 1997). The computed Galactic space velocity components and their uncertainties are given in Table Nearby debris disk systems with high fractional luminosity reconsidered.
Table Nearby debris disk systems with high fractional luminosity reconsidered summarizes the basic properties of the relevant moving groups and associations within 120 pc from the Sun. The probability that star is a member of moving group , can be computed by:
| (2) |
where and are the Galactic space velocity components of the star and their uncertainties, respectively, while and are the mean Galactic space velocity components of the specific kinematic group as well as the corresponding errors. In this formula we assumed that the velocity distribution within a group is Gaussian. When parameters were not available in the literature, we computed them from the velocity dispersion of known members around the mean. Our newly calculated mean values were always consistent with those from the literature within the uncertainties. In those few cases where no sufficient membership information could be found in the literature, we adopted km s-1 (a characteristic value in the previous cases).
Probability values for each star with respect to each group were computed. Then we checked the resulting values for objects already assigned to a group in the literature. The numbers spread in the range of , therefore we set as a lower limit for the new moving group member candidates as well. Stars assigned to any group above this threshold were further checked by comparing their 3-dimensional space location with the volume occupied by the group (most groups are rather confined in space). There were a few stars which could be assigned to both the Tucana-Horologium and GAYA2 associations; these cases are analyzed in Appendix B. Table Nearby debris disk systems with high fractional luminosity reconsidered presents the final assignments between stars and kinematic groups.
From our sample of 60 objects, 26 sources could be linked to stellar associations; 13 of them are new members identified in the present study. For 10 stars out of these 13, age estimates are available in the literature. For these ten objects we directly compare our age estimates with previous values in Table Nearby debris disk systems with high fractional luminosity reconsidered. In most cases ages derived in our study are younger than the earlier values. The discrepancy is particularly obvious in the case of ages derived from isochrone fitting (for example Nordström et al. 2004). However, this problem is not related only to the present study. For example, HD 105 has a moving group age of Myr (Mamajek et al., 2004a) while Nordström et al. (2004) quoted Myr from isochrone fitting. Similar objects in our sample are HD 25457 ( Myr from moving group, Zuckerman & Song 2004b and Myr from isochrones, Nordström et al. 2004); HD 164249 ( Myr, Song et al. 2003 and Myr, Nordström et al. 2004); HD 181327 ( Myr, Song et al. 2003 and Myr, Nordström et al. 2004). The age uncertainty related to isochrone fitting might arise from the lack of information on whether the star is in the pre-main-sequence phase of its evolution or is an evolved object above the main-sequence. In ambiguous cases we always adopted age estimates derived from stellar kinematic group membership.
3.2 Statistical age estimates for the disk sample
For stars not assigned to any moving groups other age estimation methods are needed. Before focusing on individual systems, in this subsection we analyze what can be learned about the age distribution of our sample of debris disk systems.
3.2.1 Distribution of the excess stars in the velocity space
The distribution of the derived Galactic space velocities (Table Nearby debris disk systems with high fractional luminosity reconsidered) are displayed in Fig. 1a-b. Overplotted is the box occupied by young disk population stars defined by (Leggett, 1992) on the basis of a systematic study of Eggen (1989). The plots show that most stars from our sample belong to this population. This fact suggest that the majority of our sample of stars from Table Nearby debris disk systems with high fractional luminosity reconsidered are relatively young.
3.2.2 Location of A-type stars on the CMD
For a sample of bright A-type stars Jura et al. (1998) demonstrated that three objects with strong infrared excess (HR 4796A, HD 9672, ) are located close to the lower boundary of the distribution in the Color-Magnitude Diagram (CMD). Comparing their locations with the loci of the youngest, nearby open clusters ( Per, IC2391, Pleiades), Lowrance et al. (2000) argued that stars with strong infrared excess are typically younger than these clusters. Adopting this idea we selected stars with BV ranging between -0.1 and 0.33 (corresponding mainly to A-type stars) from Table Nearby debris disk systems with high fractional luminosity reconsidered, and plotted them in the CMD of Fig. 2. In addition we overplotted a volume-limited sample of A-type stars ( pc) extracted from the Hipparcos Catalogue (it was requested that the parallax error was less than 10% and the BV uncertainty was lower than 0.01 mag). For comparison, members of the open clusters Per (80 Myr) and Hyades (600 Myr) are marked. The older cluster, Hyades, covers the upper part of the distribution, while Per stars are situated at lower absolute magnitudes for the same color. Pleiades (100 Myr, not plotted in the figure for clarity) occupies the same region as Per (see Fig. 3 in Lowrance et al. 2000).
Figure 2 shows that the majority of the objects from our sample of high stars appear to be close to the lower boundary of the area occupied by A-stars, and are located below the region of Per and Pleiades, with some overlap. This suggests that the early spectral type stars from our sample of high disks are young, probably close to the zero age main-sequence (ZAMS), and they are presumably not older than 100 Myr, the age of the Pleiades.
3.3 Ages of individual objects
For those objects which could be assigned to one of the moving groups or associations the age of that group as well as its uncertainty was adopted (26 objects). For a number of stars not associated with groups or with associations, age estimates could be found in the literature (19 stars, for references see Table Nearby debris disk systems with high fractional luminosity reconsidered). Sometimes literature data for a specific star scatter significantly; in these cases we adopted an age range which covers all quoted values and their uncertainties. When the literature search did not yield any dating, we made age estimates by plotting the stars on the HR diagram and comparing their positions to isochrones. For stars with spectral types in the range B9-G5 the isochrone age was estimated following the general outline described by Lachaume et al. (1999), using the Padova theoretical isochrones (Girardi et al., 2000). This method was applied to 13 objects.
This isochrone method gives only upper limits for some A-type stars. As a best estimate for these stars (five cases), we adopted an upper limit of 100, consistent with our results shown in Fig. 2 and discussed in Section 3.2.2. For stars of later spectral type there are some widely used age indicators, like the strength of the Ca II H&K lines or the X-ray luminosity of the star. In the case of HD 121812 our age estimate is based on the former method, taking the measured value from Strassmeier et al. (2000) and using the calibration of Lachaume et al. (1999). HD 130693 has a ROSAT counterpart and its X-ray luminosity of erg s-1 was compared with the X-ray luminosity distribution function of late-type members in different associations (see figure 2 in Stelzer & Neuhäuser 2000), yielding an age range of Myr. In Table Nearby debris disk systems with high fractional luminosity reconsidered we summarize the age estimates for each object.
4 Discussion
4.1 Connection between debris disks and young moving groups
From our sample of 60 main-sequence stars exhibiting strong infrared excess, 26 can be assigned to young stellar kinematic groups. In order to test whether the frequency of stars belonging to young stellar kinematic groups is similar in a general sample we determined the corresponding ratio within a volume-limited sample of normal stars. First we created this sample by selecting stars from the Hipparcos catalogue using the following criteria: (1) they are closer as 120 pc (the same volume-limit than in our sample); (2) their Survey flag in the catalogue222Field H68 in the Hipparcos catalogue. ’S’ indicates that the entry is contained within the ‘survey’, which was the basic list of bright stars added to and merged with the total list of proposed stars, to provide a stellar sample almost complete to well-defined limits. The limiting magnitude was a function of the stars’s spectral types and galactic latitude. was set to ”S”; (3) they have radial velocity measurement with uncertainty less than km s-1. The second condition guarantees that stars observed in various individual projects do not introduce a bias in the analysis of the velocity distribution (Skuljan et al., 1999). In addition, Binney et al. (1997) noted that radial velocities are preferentially observed for high-proper-motion stars which may cause a kinematical bias in our sample. Following the proposal of Skuljan et al. (1999) we constrained the sample for stars exhibiting low transverse velocity, and excluded all stars with km s-1 in order to avoid this bias.
The query resulted in 7519 objects, for which we computed the UVW Galactic space motion components. For each star in the two samples (the 60 debris systems in Table Nearby debris disk systems with high fractional luminosity reconsidered, and the newly defined volume-limited stellar sample) we determined the Euclidean distance in the 3D velocity space from the closest moving group, . In this analysis we considered only groups younger than 150 Myr. In Fig. 3 we plotted the histograms of for the two samples. A two-sided Kolmogorov-Smirnov test shows that the two distributions are different with a probability higher than 99.99%. This result indicates that debris systems of high infrared fractional luminosity are much more intimately linked to the nearby young stellar kinematic groups than the majority of normal stars.
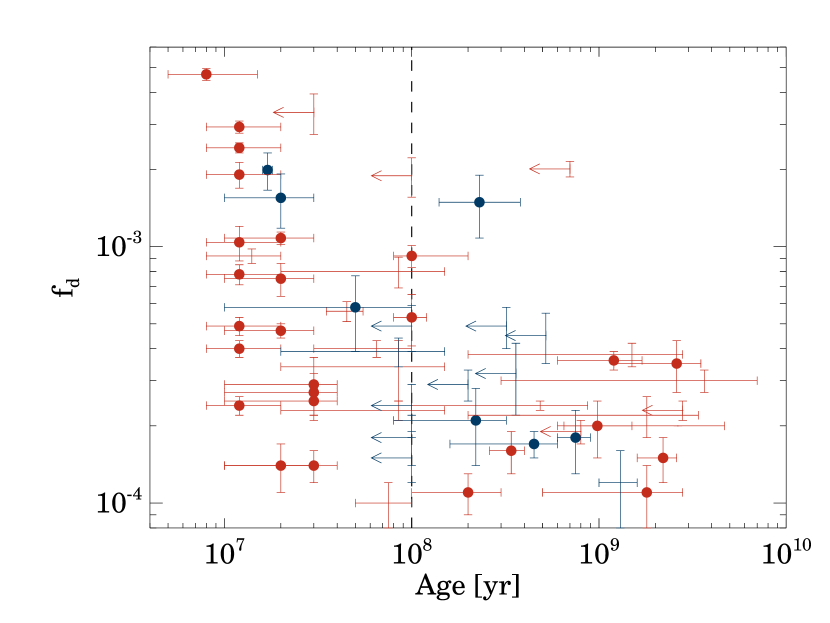
4.2 The relationship between fractional luminosity and age
Zuckerman & Song (2004b) hypothesised that stars with are younger than 100 Myr, and therefore a high value can be used as an age indicator. This proposal is in contradiction with the conclusion of Decin et al. (2003), who claimed the existence of high disks around older stars. In order to test which proposal is supported by our data, in Fig. 4 we plotted the distribution of ages as a function of the fractional luminosity from Table Nearby debris disk systems with high fractional luminosity reconsidered. We plotted in red the debris disks whose presence was explicitely confirmed by an instrument independent of IRAS (see Col. 8 in Table Nearby debris disk systems with high fractional luminosity reconsidered). The confirmation could be based e.g. on high spatial resolution infrared images (ISO/ISOPHOT, Spitzer/MIPS), or on mid-infrared spectra (Spitzer/IRS), or on coronographic images (HST/ACS, HST/NICMOS). We found 43 confirmed debris disks in total.
Most data points with fall below the age threshold of 100 Myr (marked by a dashed line), while objects with lower show a larger spread in age. This trend can be recognized in the whole sample, but is especially clear in the confirmed subsample (red symbols). There is only one noteworthy case: HD 121812 with an age of Myr exhibits fractional luminosity exceeding the threshold value. However, the presence of a debris disk around this star has not been confirmed independently of IRAS. On the basis of this result we conclude that – according to the suggestion of Zuckerman & Song (2004b) – the majority of debris disks with are younger than 100 Myr, and high fractional luminosities can be used as an indicator of youth. Nevertheless the opposite is not true, i.e. a low value is not correlated with age, and in particular is not an indicator of antiquity.
There is a growing list of debris disk systems which have been discovered by the sensitive detectors of the Spitzer Space Telescope (Beichman et al., 2005a; Bryden et al., 2005; Chen et al., 2005a, b; Kim et al., 2005; Low et al., 2005; Meyer et al., 2004; Stauffer et al., 2005; Uzpen et al., 2005), and one may wonder whether these new observations support our previous conclusion. As a preliminary check we collected from the cited papers all debris disks with . We used fractional luminosity values and age estimates as quoted in the papers. We found that all of these new disks discovered so far belong to the 16 Myr old Lower Centaurus Crux subgroup of the Scorpius-Centaurus association (HD 106906, HD 113556, HD 113766, HD 114082, HD 115600, HD 117214; Chen et al. 2005a), or to the TWA (TWA 7, TWA 13A, TWA 13B; Low et al. 2005), or to the star forming region RCW 49 (18 possible warm debris disks, Uzpen et al. 2005), which unambigously shows that these objects are young, in agreement with the conclusion of the present paper.
4.3 Debris disk evolution and the cases of old systems
There are a number of models in the literature (see Sect.1) to describe the temporal evolution of debris disks. In the following we compare our results with predictions.
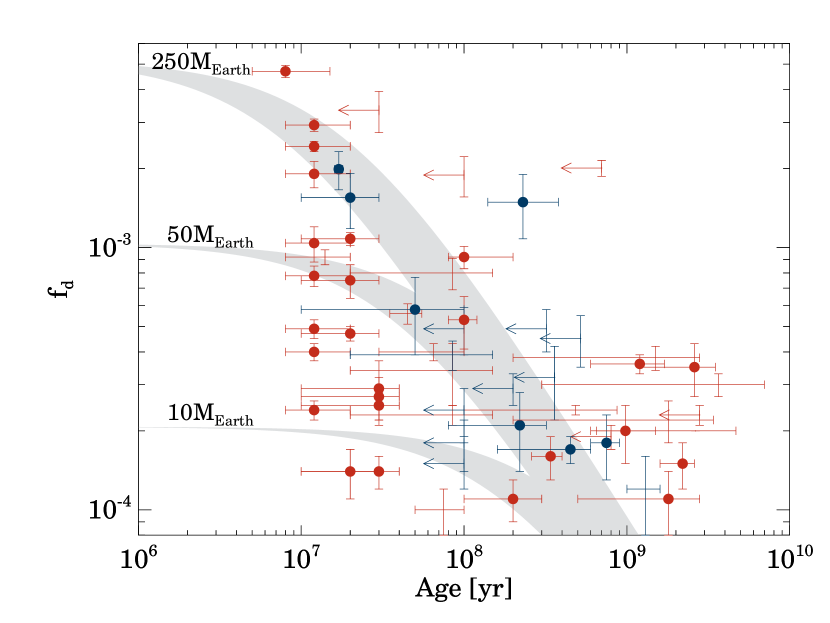
Dominik & Decin (2003) proposed a simple collisional model which assumes that all dust grains in the debris disk are produced in collisions between planetesimals within a ring whose radius is constant during the whole evolution. In collisional equilibrium – when the dust production and destruction rates are in balance – the grain loss mechanism governs the amount of dust visible in the system. If dust destruction is dominated by collisions the fractional luminosity decreases proportionally to . If the dust removal process is dominated by the Poynting-Robertson drag, . It is predicted that in disks with the evolution is dominated by collisions (Dominik & Decin, 2003; Wyatt, 2005).
Three families of disk evolution models, computed from eqs. 7, 35-40 of Dominik & Decin (2003), are plotted as shadowed bands in Figure 5. The data points and symbols in this figure are identical to those in Fig. 4. The main differences between the model families are related to disk mass: (a) ; (b) 50 ; and (c) 250 . The width of each band corresponds to a range in stellar mass from 0.5 to 3. Additional parameters are: the characteristic radius of the ring of planetesimals ; the radius of planetesimals km; the density of the planetesimal material g cm-3 (proposed for icy bodies with small rocky component, Greenberg 1998; Kenyon 2002); the size of the smallest visible grains (taken from Jura et al. 2004); the absorption efficiency of the dust particles ; and (defined in eq. 22 in Dominik & Decin 2003).
Figure 5 shows that the location of most stars on the evolutionary diagram can be explained by the models. The number of older stars exhibiting high values incompatible with the models is relatively low. Most of these disks are located in the yr and area. A possible explanation for the origin of these stars was proposed by Dominik & Decin (2003) who assumed that different planetesimal disks become active debris system at different ages because of the delayed onset of the collisional cascade. Large collisional events may also increase the brightness of a debris disk temporarily (Rieke et al., 2005). Extraordinary events during the evolution like e.g. a proposed ’supercomet’ in the HD 69830 system (Beichman et al. 2005b) cannot be excluded, too. Nevertheless, the low number of systems incompatible with the models, especially at , indicates that the above scenarios do not represent the main evolutionary trend.
It is important to note that a large spread in fractional luminosities () can be observed in the figure among young debris systems ( Myr). This result resembles the findings of Rieke et al. (2005) among A-type stars but somewhat contradicts to Decin et al. (2003) and Dominik & Decin (2003) who found only few young stars with moderate or small infrared excesses, and proposed that it might be related to the effect of stirring. A possible explanation of the large spread among young stars could be that the initial conditions of the disks (especially initial disk mass) are far from being homogeneous.
5 Conclusions
We searched the IRAS and ISO databases and compiled a list of debris disks exhibiting the highest fractional luminosity values () in the vicinity of the Sun ( pc). Utilizing high-resolution far-infrared maps we attempted to exclude bogus disks from the sample. The fractional luminosity value for each disk was recomputed using available IRAS, ISO, and Spitzer data, and analysed the galactic space velocities of the objects as well as the distribution of the disks on the fractional luminosity versus age diagram. Our results are summarized as follows:
-
1.
We compiled a list of 60 debris disk systems of high fractional luminosity. Eleven of them are new discoveries and 4 out of these 11 have been confirmed by Spitzer observations;
-
2.
Disks with high fractional luminosity often belong to young stellar kinematic groups, providing an opportunity to obtain improved age estimates for these disks;
-
3.
Practically all objects with are younger than 100 Myr;
-
4.
The number of old systems with high seems to be lower than was claimed before, mainly as a consequence of the age revision in connection to the young stellar kinematic groups;
-
5.
There exist many young disks of moderate fractional luminosity;
-
6.
Comparing the theoretical evolutionary model of Dominik & Decin (2003) with the observations in the vs. diagram good general agreement was found.
6 Acknowledgments
We are grateful to the anonymous referee for his/her comments which improved the paper.
This research has made use of the IRAS and Hipparcos Catalogs (ESA, 1997), as well as the SIMBAD database and the VizieR tool operated by CDS, Strasbourg, France. Two Micron All Sky Survey (2MASS) is a joint project of the University of Massachusetts and the Infrared Processing and Analysis Center/California Institute of Technology, funded by the National Aeronautics and Space Administration and the National Science Foundation.
This work is based on observations made with the Spitzer Space Telescope, which is operated by the Jet Propulsion Laboratory, California Institute of Technology under a contract with NASA. Support for this work was provided by NASA through an award issued by JPL/Caltech.
This material is partly based upon work supported by the National Aeronautics and Space Administration through the NASA Astrobiology Institute under Cooperative Agreement No. CAN-02-OSS-02 issued through the Office of Space Science.
The ISO Data Archive is maintained at the ISO Data Centre, Villafranca, Madrid, and is part of the Science Operations and Data Systems Division of the Research and Scientific Support Department. ISOPHOT observations were reduced using the ISOPHOT Interactive Analysis package PIA, which is a joint development by the ESA Astrophysics Division and the ISOPHOT Consortium, lead by the Max-Planck-Institut für Astronomie (MPIA).
The work was partly supported by the grants OTKA K62304 and T043739 of the Hungarian Scientific Research Fund.
Appendix A Bogus debris disks
In the last few years several IRAS-based debris disk candidates turned out to be bogus. Examples are HD 155826 (Lisse et al., 2002), or the list of Kalas et al. (2002). Most common problems are contamination by background objects (cirrus knots, galaxies), Pleiades like nebulosity, or unreliable point source detection by IRAS. Our list of debris disk candidates is based on IRAS data, however when higher resolution far-infrared observations were available we checked whether the above mentioned problems could have affected the detection of the disk. In Table Nearby debris disk systems with high fractional luminosity reconsidered we list those objects which were identified as debris system in the literature (and claimed to have in the original paper), but our analysis indicates that they are very likely bogus disks. In the following we briefly describe the reason of rejection.
HD 34739
The source position in the MIPS 70m map differs from the star’s position by 26″, but coincides with the near-infrared source 2MASS J05163646-5257397 with an offset of 2″.
HD 53842
This system is not a real bogus disk, since at 24m the star shows infrared excess (Moór et al. 2006, in prep.) but at 70m the IR emission comes from an independent compact source separated by 19″. This nearby source coincides with a 2MASS J06460135-8359359, within a distance of 2″. Due to this fact the fractional luminosity of HD 53842 decreased below our lower limit.
HD 56099
The source position in the MIPS 70m map differs from the star’s position by 24″, but coincides with the near-infrared source 2MASS J07190966+5907219 with an offset of 2″.
HD 72390
The peak brightness position in the ISOPHOT maps at 60 and 90m differs from the stellar position by 36″. Coordinates of this peak are very close to those of 2MASS J08143635-8423260 which is an extended 2MASS source (XSC 1524951), with an offset of 5″.
HD 82821
We have detected two infrared sources in the MIPS 70m map, but their positions significantly differ from the position of the star. The position of the brighter one lies at 70″ from the nearby IRAS source (FSC 09319+0346); and is located just outside the 2 error ellipse (nearly along the major axis) but well inside the 3 error ellipse. We assume that this source, whose position coincides well with the near-infrared source 2MASS J09343630+0332417 (XSC 2391850) within a distance of 3″, is responsible for the source confusion. The second source was probably below the IRAS sensitivity limit.
HD 143840
ISOPHOT mini-map observation at 90m and Spitzer MIPS image at 70m show extended IR emission. The image of the Digitized Sky Survey also shows a reflection nebulosity around this star. We think that the excess far-infrared emission comes from the nebula.
HD 185053
Magakian (2003) proposed that HD 185053 is the illuminating source of the reflection nebula GN 19.41.5. Spitzer MIPS observation at 24 and 70m shows extended IR emission around the star. We think that the excess far-infrared emission is related to the nebula rather than to a debris disk.
HD 204942
The source position in the MIPS 70m map differs from the star’s position by 22″, but coincides with the near-infrared source 2MASS J21323602-2409319 with an offset of 4″.
HD 23484, HD 158373, HD 164330
ISOPHOT mini-map observations of these stars at 60 and 90m did not show excess above the photosphere. This discrepancy between the IRAS based excesses and the non-detection of excesses by ISOPHOT (which had better spatial resolution than IRAS at far-infrared wavelengths) was already mentioned by Silverstone (2000), who suggested cirrus contamination as the reason.
For stars when no higher resolution data were available a set of criteria were applied to filter out suspicious objects which might be bogus disk (see Sect. 2.3). In Table Nearby debris disk systems with high fractional luminosity reconsidered we listed those objects which were earlier identified as debris disk in the literature (with ) but were rejected from the further analysis according to our criteria. Nevertheless, future high spatial resolution infrared data are needed to prove or disprove our judgment.
Appendix B New members in the young stellar kinematic groups
Pictoris moving group (BPMG).
We identified two stars which are candidate members of this group: HD 15115 and HD 191089. HD 15115 is a northern object. Though the first surveys found BPMG members only in the Southern hemisphere (Barrado y Navascués et al., 1999; Zuckerman et al., 2001a) recently Song et al. (2003) proposed several new northern candidates. One of those, HIP 12545 is located within four degrees to HD 15115 on the sky. HD 15115 has a ROSAT counterpart with fractional X-ray luminosity of ( erg s-1). These properties are comparable to those of stars with similar mass in young star associations (see fig. 9,10 in de la Reza & Pinzón 2004).
HD 191089 is somewhat more distant (see Table Nearby debris disk systems with high fractional luminosity reconsidered) than known members of the group in the list of Zuckerman & Song (2004b). However, large part of this list is based on a volume limited survey within , and other authors proposed candidates at larger distances (Torres et al., 2002). HD 191089 shows several signs of youth. Mamajek (2004b) classified this star as younger than Pleiades because of its lithium abundance (EW(Li) = m) was higher than 95% of Pleiades stars with similar effective temperatures. Isochronal age of the star ( Myr, Mamajek 2004b) is in good agreement with the age of Pictoris moving group ( Myr, see Table Nearby debris disk systems with high fractional luminosity reconsidered). Moreover HD 191089 rotates rapidly compared with typical F5 type stars ( km s-1, Nordström et al. 2004). Its ROSAT X-ray luminosity of erg s-1 and X-ray fractional luminosity of . These values are also comparable with the properties of stars with similar spectral types in nearby kinematic groups (see fig. 9,10 in de la Reza & Pinzón 2004).
The GAYA2 and TucHor associations.
The Great Austral Young Association2 (GAYA2) and Tucana/Horologium (TucHor) Association can be discussed together since they overlap both in their location on the projected sky plane and in velocity space. GAYA2 was discovered in the framework of the SACY (Search for Associations Containing Young stars) survey (Torres et al., 2002), and the known members are confined mostly in the right ascension (R.A.) range . Recently identified members of TucHor occupy a similar region () and several of them show only slightly different Galactic space motions compared to the mean UVW velocities of the Tucana nucleus and resemble the mean space motions of GAYA2. Although GAYA2 is more distant (located at a mean distance of , while TucHor members located in the same sky region have a mean distance of ), there is an overlap in radial distance, as well. Studying the relationship between the two associations is out of the scope of this work. As a practical solution, we assigned all doubtful sources (see Fig. 6) of to the TucHor association and the more distant ones to GAYA2. Thus we propose that one of these sources, HD 37484 belongs to TucHor (its space velocity is not inconsistent with that of other neighbouring TucHor members). The measured lithium abundance of the star (Favata et al., 1993) is a strong indication of its youth. HD 21997, HD 30447, HD 35841, HD 38206 and HD 38207 are classified as members of the GAYA2 group. It is worth to mention that these five stars form a spectacular concentration of high debris disks within a relatively small area on the sky.
Local Association.
We propose that HD 10472, HD 10638, HD 218396 and HD 221853 belong to the Local Association. HD 10472 was previously a TucHor candidate (Torres et al., 2000; Zuckerman et al., 2001b), but recently Zuckerman & Song (2004b) suggested that its membership status is uncertain, thus it may be consistent with our result.
IC 2391 supercluster
HD 110058
was earlier classified as a member of the Lower Centaurus Crux (LCC) association using convergent-point method (de Zeeuw et al., 1999). However, according to our results, its Galactic space velocity is inconsistent with the mean velocity of the LCC. Nevertheless HD 110058 seems to be a very young object on the basis of its position on the Color-Magnitude Diagram of A-type stars (see Sect. 3.2.2).
References
- Ábrahám et al. (2003) Ábrahám, P., Moór, A., Kiss, Cs., Héraudeau, P., & del Burgo, C., Exploiting the ISO Data Archive. Infrared Astronomy in the Internet Age, held in Siguenza, Spain 24-27 June, 2002. Edited by C. Gry, S. Peschke, J. Matagne, P. Garcia-Lario, R. Lorente, & A. Salama. Published as ESA Publications Series, ESA SP-511. European Space Agency, 2003, p. 129.
- Ardila et al. (2005) Ardila, D. R., Golimowski, D. A., Krist, J. E., et al. 2004, ApJ, 617, L147
- Artymowicz (1996) Artymowicz, P. 1996, in The Role of Dust in the Formation of Stars, ed. H. U. Kaüfl & R. Siebenmorgen (New York: Springer), 137
- Aumann et al. (1984) Aumann, H. H., Beichman, C. A., Gillett, F. C. et al., 1984, ApJ, 278, L23
- Backman & Gillett (1987) Backman, D., & Gillett, F. C. 1987, in Cool Stars, Stellar Systems and the Sun, ed. J. L. Linsky & R. E. Stencel (Lecture Notes in Physics 291; Berlin: Springer), 340
- Backman & Paresce (1993) Backman, D. E., & Paresce, F. 1993, in Protostars and Planets III, ed. E. H. Levy & J. I. Lunine (Tucson: Univ. Arizona Press), 1253
- Barrado y Navascués (1998) Barrado y Navascués, D. 1998, A&A, 339, 831
- Barrado y Navascués et al. (1999) Barrado y Navascués, D., Stauffer, J. R., Song, I., & Caillault, J.-P. 1999, ApJ, 520, L123
- Beichman et al. (1988) IRAS Explanatory Supplement, 1988, ed. Beichman, C. A., Neugebauer, G., Habing, H. J., Clegg, P. E., & Chester T. J. (Washington, DC: US GPO)
- Beichman et al. (2005a) Beichman, C. A., Bryden, G., Rieke, G. H., et al. 2005a, ApJ, 622, 1160
- Beichman et al. (2005b) Beichman, C. A., Bryden, G., Gautier, T. N., et al. 2005b, ApJ, 626, 1061
- Binney et al. (1997) Binney J. J., Dehnen W., Houk N., Murray C. A., Penston M. J., 1997, Proc. ESA Symp., Hipparcos - Venice ’97. ESA SP-402, 473
- Bryden et al. (2005) Bryden, G., Beichman, C. A., Trilling, D. E., et al. 2005, astro-ph/0508165
- Carpenter et al. (2005) Carpenter, J.M., Wolf, S., Schreyer, K., Launhardt R., & Henning T. 2005, AJ, 129, 1049
- Chen et al. (2005a) Chen, C. H., Jura, M., Gordon, K. D., & Blaylock, M. 2005a, ApJ, 623, 493
- Chen et al. (2005b) Chen, C. H., Patten, B. M., Werner, W., et al. 2005b, ApJ preprint doi:10.1086/’497124’
- Cutri et al. (2003) Cutri, R. M., et al., 2003, Explanatory Supplement to the 2MASS All Sky Data Release (Pasadena: IPAC)
- Decin et al. (2000) Decin, G., Dominik, C., Malfait, K., Mayor, M., & Waelkens, C. 2000, A&A, 357, 533
- Decin et al. (2003) Decin, G., Dominik, C., Waters, L. B. F. M., & Waelkens, C. 2003, ApJ, 598, 636
- de la Reza & Pinzón (2004) de la Reza, R. & Pinzón, G. 2004, AJ, 128, 1812
- Dent et al. (2000) Dent, W. R. F., Walker, H. J., Holland, W. S., & Greaves, J. S. 2000, MNRAS, 314, 702
- Dominik & Decin (2003) Dominik, C., & Decin, G. 2003, ApJ, 598, 626
- Eggen (1989) Eggen, O. J. 1989, PASP, 101, 54
- ESA (1997) ESA, 1997, The Hipparcos and Tycho Catalogues, ESA SP-1200
- Evans (1967) Evans, D. S. 1967, Determination of Radial Velocities and their Applications, Proceedings from IAU Symposium no. 30 held at the University of Toronto 20-24 June, 1966. Edited by Alan Henry Batten and John Frederick Heard. International Astronomical Union. Symposium no. 30, Academic Press, London, p.57
- Favata et al. (1993) Favata, F., Barbera, M., Micela, G., & Sciortino, S. 1993, A&A, 277, 428
- Gabriel et al. (1997) Gabriel, C., Acosta-Pulido, J., Heinrichsen, I., Morris, H., & Tai, W.-M. 1997, The ISOPHOT Interactive Analysis PIA, a calibration and scientific analysis tool, in Astronomical Data Analysis Software and Systems (ADASS) VI, ed. G. Hunt, & H. E. Payne (San Francisco: ASP), ASP Conf. Ser., 125, 108
- Gerbaldi et al. (1999) Gerbaldi, M., Faraggiana, R., Burnage, R., Delmas, F., Gómez, A. E., & Grenier, S. 1999, A&AS, 137, 273
- Girardi et al. (2000) Girardi, L., Bressan, A., Bertelli, G., & Chiosi, C. 2000, A&AS, 141, 371
- Gordon et al. (2005) Gordon, K. D., Rieke, G., Engelbracht C., et al. 2005, PASP, 117, 503
- Greaves et al. (2000) Greaves, J. S., Mannings, V., & Holland, W. S. 2000, Icarus, 143, 155
- Greenberg et al. (1998) Greenberg, J. M. 1998, A&A, 330, 375
- Grenier et al. (1999) Grenier, S., Baylac, M. O., Rolland, L., et al. 1999, A&AS, 137, 451
- Habing et al. (2001) Habing, H. J., Dominik, C., Jourdain de Muizon, M. et al. 2001, A&A, 365, 545
- Harper et al. (1984) Harper, D. A., Loewenstein, R. F., & Davidson, J. A. 1984, ApJ, 285, 808
- Heinrichsen et al. (1999) Heinrichsen, I., Walker, H. J., Klaas, U., Sylvester, R. J., & Lemke, D. 1999, MNRAS, 304, 589
- Helou & Walker (1988) IRAS Catalogs: The Small Scale Structure Catalog, 1988, ed. G. Helou and D.W. Walker, NASA RP-1190, vol 7 (Washington, DC: GPO)
- Hines et al. (2005) Hines, D.C. et al. 2005, ”FEPS Data Explanatory Supplement,” Version 3.0, (Pasadena: SSC).
- Holland et al. (1998) Holland, W., Greaves, J., Zuckerman, B., et al. 1998, Nat, 392, 788
- Jarrett et al. (2000) Jarrett, T. H., Chester, T., Cutri, R., et al. 2000, AJ, 120, 298
- Jura (1991) Jura, M. 1991, ApJ, 383, L79
- Jura et al. (1998) Jura, M., Malkan, M., White, R., et al. 1998, ApJ, 505, 897
- Jura et al. (2004) Jura, M., Chen, C. H., Furlan, E., et al. 2004, ApJS, 154, 453
- Kalas et al. (2002) Kalas, P., Graham, J. R., Beckwith, S. V. W., Jewitt, D. C., & Lloyd, J. P. 2002, ApJ, 567, 999
- Kalas et al. (2005) Kalas, P., Graham, J. R., & Clampin, M. 2005, Nature, 435, 1067
- Kalas (2005) Kalas, P. 2005, astro-ph/0511244
- Kenyon (2002) Kenyon, S. J. 2002, PASP, 114, 265
- Kenyon & Bromley (2002) Kenyon, S. J., & Bromley, B. C. 2002, ApJ, 577, L35
- Kenyon & Bromley (2004) Kenyon, S. J., & Bromley, B. C. 2004, ApJ, 127, 513
- Kessler et al. (1996) Kessler, M. F., Steinz, J. A., Anderegg, M. F., et al. 1996, A&A, 315, L27
- Kharchenko (2004) Kharchenko N.V., Piskunov A.E., Scholz R.-D. 2004, Astron. Nachr., 325, 439
- Kim et al. (2005) Kim, J. S, Hines, D. C., Backman, D. E., et al. 2005, ApJ, 632, 659
- King et al. (2003) King, J. R., Villarreal, A. R., Soderblom, D. R., Gulliver, A. F., & Adelman, S. J. 2003, AJ, 125, 1980
- Kleinmann et al. (1986) Kleinmann, S.G., Cutri, R.M., Young, E.T., Low, F.J., & Gillett, F.C. 1986, Explanatory Supplement to the IRAS Serendipitous Survey Catalog (Pasadena: JPL).
- Koerner et al. (1998) Koerner, D. W., Ressler, M. E., Werner, M. W., & Backman, D. E. 1998, ApJ, 503, L83
- Krist et al. (2005) Krist, J. E., et al. 2005, AJ, 129, 1008
- Lachaume et al. (1999) Lachaume, R., Dominik, C., Lanz, T., & Habing, H. J. 1999,A&A, 348, 897
- Lallement et al. (2003) Lallement, R., Welsh, B. Y., Vergely, J. L., Crifo, F., & Sfeir, D. 2003, A&A, 411, 447
- Laureijs et al. (2003) Laureijs, R. J., Klaas, U., Richards, P. J., Schulz, B., & Ábrahám, P. 2003, The ISO Handbook Vol. IV.: PHT - The Imaging Photo-Polarimeter, Version 2.0.1, ESA SP-1262, European Space Agency
- Leggett (1992) Leggett, S. K. 1992, ApJS, 82, 351
- Lemke et al. (1996) Lemke, D., Klaas, U., Abolins, J., et al. 1996, A&A, 315, L64
- Lisse et al. (2002) Lisse, C., et al. 2002, ApJ, 570, 779
- Liu et al. (2004) Liu, M. C., Matthews, B. C., Williams, J. P., & Kalas, P. G. 2004, ApJ, 608, 526
- Low et al. (2005) Low, F. J., Smith, P. S., Werner, M., et al. 2005, ApJ, 631, 1170
- Lowrance et al. (2000) Lowrance, P. J., Schneider, G., Kirkpatrick, J. D., et al. 2000, ApJ, 541, 390
- Luhman et al. (2005) Luhman, K. L., Stauffer, John R., Mamajek, E. E. 2005, ApJ, 628, L69
- Magakian (2003) Magakian, T. Y. 2003, A&A, 399, 141
- Makovoz & Marleau (2005) Makovoz, D., & Marleau, F. 2005, PASP, 117, 1113
- Mamajek et al. (2002) Mamajek, E. E., Meyer, M. R., Liebert, J. 2002, AJ, 124, 1617
- Mamajek et al. (2004a) Mamajek, E. E., Meyer, M. R., Hinz, P. M., et al. 2004a, ApJ, 612, 496
- Mamajek (2004b) Mamajek, E. E., 2004b, PhD Thesis, The University of Arizona
- Mannings & Barlow (1998) Mannings, V., & Barlow, M. 1998, ApJ, 497, 330
- Meyer et al. (2004) Meyer, M. R., Hillenbrand, L. A., Backman, D. E., et al. 2004, ApJS, 154, 422
- Meynet et al. (1993) Meynet, G., Mermilliod, J.-C., & Maeder, A. 1993, A&AS, 98, 477
- Montes et al. (2001) Montes, D., et al. 2001, MNRAS, 328, 45
- Moshir et al. (1989) Moshir, M., et al. 1989, Explanatory Supplement to the IRAS Faint Source Survey (Pasadena: JPL) (FSC)
- Nordström et al. (2004) Nordström, B., et al. 2004, A&A, 418, 989
- Oudmaijer et al. (1992) Oudmaijer, R. D., van der Veen, W. E. C. J., Waters, L. B. F. M., et al. 1992, A&AS, 96, 625
- Patten & Willson (1991) Patten, B. M., & Willson, L. A. 1991, AJ, 102, 323
- Plets & Vynckier (1999) Plets, H., & Vynckier, C. 1999, A&A, 343, 496
- Rebull et al. (2004) Rebull, L. M., Stapelfeldt, K. R., Chen, C., et al. 2004, AAS, 205, 1703
- Rieke et al. (2004) Rieke, G. H., et al. 2004, ApJS, 154, 25
- Rieke et al. (2005) Rieke, G. H., et al. 2005, ApJ, 620, 1010
- Rocha-Pinto et al. (2004) Rocha-Pinto, H. J., Flynn, C., Scalo, J. et al. 2004, A&A, 423, 517
- Sadakane & Nishida (1986) Sadakane, K., & Nishida, M. 1986, PASP, 98, 685
- Sartori et al. (2003) Sartori, M. J., Lépine, & J. R. D., Dias, W. D. 2003, A&A, 404, 913
- Schneider et al. (1999) Schneider, G., et al. 1999, ApJ, 513, L127
- Schneider et al. (2005) Schneider, G., Silverstone, M. D., & Hines, D. C. 2005, ApJ, 629, 117L
- Silverstone (2000) Silverstone, M. D. 2000, Ph.D. thesis, UCLA
- Skuljan et al. (1999) Skuljan, J., Hearnshaw, J. B., & Cottrell, P. L. 1999, MNRAS, 308, 731
- Smith & Terrile (1984) Smith, B., & Terrile, R. 1984, Sci, 226, 1421
- Song et al. (2000) Song, I., Caillault, J.-P., Barrado y Navascués, D., Stauffer, J. R., & Randich, S. 2000, ApJ, 533, L41
- Song et al. (2001) Song, I., Caillault, J.-P., Barrado y Navascués, D., & Stauffer, J. R. 2001, ApJ, 546, 352
- Song et al. (2003) Song, I., Zuckerman, B., & Bessell, M. S. 2003, ApJ, 599, 342
- Song et al. (2004) Song, I., Zuckerman, B., & Bessell, M. S. 2004, ApJ, 614, L125
- Spangler et al. (2001) Spangler, C., Sargent, A. I., Silverstone, M. D., Becklin, E. E., & Zuckerman, B. 2001, ApJ, 555, 932
- Stauffer et al. (1998) Stauffer, J.R., Schultz, G., & Kirkpatrick, J.D., 1998, ApJ, 499, L199
- Stauffer et al. (2005) Stauffer, J.R., Rebull, L. M., Carpenter, J. et al. 2005, AJ, 130, 1834
- Stelzer & Neuh user (2000) Stelzer, B., & Neuhäuser, R. 2000, A&A, 361, 581
- Stencel & Backman (1991) Stencel, R. E.,& Backman, D. E. 1991, ApJS, 75, 905
- Strassmeier et al. (2000) Strassmeier, K., Washuettl, A., Granzer, Th., Scheck, M., & Weber, M. 2000, A&AS, 142, 275
- Sylvester & Mannings (2000) Sylvester, R., Mannings, V. 2000, MNRAS, 313, 73
- Thi et al. (2001) Thi, W. F., et al. 2001, ApJ, 561, 1074
- Torres et al. (2000) Torres, C. A. O., da Silva, L., Quast, G. R., de la Reza, R., & Jilinski, E. 2000, AJ, 120, 1410
- Torres et al. (2002) Torres, C. A. O., Quast, G. R., de la Reza, R., da Silva, L., & Melo, C. H. F. 2002, astro-ph/0207078
- Uzpen et al. (2005) Uzpen, B., Kobulnicky, H. A., Olsen, K. A. G., et al. 2005, ApJ, 629, 512
- Walker & Heinrichsen (2000) Walker, H.J., & Heinrichsen, I. 2000, Icarus, 143, 147
- Webb et al. (1999) Webb, R. A., Zuckerman, B., Platais, I., et al. 1999, ApJ, 512, L63
- Weintraub et al. (2000) Weintraub, D. A., Saumon, D., Kastner, J. H., & Forveille, T. 2000, ApJ, 530, 867
- Werner et al. (2004) Werner, M. W., et al. 2004, ApJS, 154, 1
- Williams et al. (2004) Williams, J. P., Najita, J., Liu, M. C., et al. 2004, ApJ, 604, 414
- Wilson (1953) Wilson R.E., 1953, General Catalogue of Stellar Radial Velocities, Carnegie Inst. of Washington Publ. 601, Washington DC
- Wright et al. (2003) Wright C.O., Egan M.P., Kraemer K.E., Price S.D., 2003, AJ, 125, 359
- Wright et al. (2004) Wright, J. T., Marcy, G. W., Butler, R. P., & Vogt, S. S. 2004, ApJ, 152, 261
- Wyatt (2005) Wyatt, M. C. 2005, A&A, 433, 1007
- de Zeeuw et al. (1999) de Zeeuw, P. T., Hoogerwerf, R., de Bruijne, J. H. J., Brown, A. G. A., Blaauw, A. 1999, AJ, 117, 354
- Zuckerman & Webb (2000) Zuckerman, B., & Webb, R. A. 2000, ApJ, 535, 959
- Zuckerman (2001) Zuckerman, B. 2001, ARA&A, 39, 549
- Zuckerman et al. (2001a) Zuckerman, B., Song, I., Bessel, M. S. & Webb, R. A. 2001a, ApJ, 562, L87
- Zuckerman et al. (2001b) Zuckerman, B., Song, I., Webb, R. A. 2001b, ApJ, 559, 388
- Zuckerman & Song (2004a) Zuckerman, B., & Song, I. 2004a, ApJ, 603, 738
- Zuckerman & Song (2004b) Zuckerman, B., & Song, I. 2004b, ARA&A, 42, 685
| Name | Other | Spectral | V | B-V | Distance | First reference | Debris disk | Reference | Age | Age | |
|---|---|---|---|---|---|---|---|---|---|---|---|
| Name | Type | to debris disk | confirmation | Reference | |||||||
| (mag) | (mag) | (pc) | () | (Myr) | |||||||
| HD 105 | … | G0V | 7.51 | 0.595 | 40 | (27) | ISO/MIPS | (9,27) | 2.50.3 | Table 4 | |
| HD 377 | … | G2V | 7.59 | 0.626 | 40 | (9) | MIPS | (9) | 4.00.3 | [30,100] | (4,30) |
| HD 3003 | … | A0V | 5.07 | 0.038 | 46 | (29) | MIPS∗ | … | 1.40.2 | Table 4 | |
| HD 6798 | … | A3V | 5.60 | 0.008 | 83 | (20) | IRS | (12) | 1.60.3 | this work | |
| HD 8907 | … | F8 | 6.66 | 0.505 | 34 | (27) | ISO/MIPS | (9,27) | 2.40.1 | [100,870] | (4,35,36) |
| HD 9672 | 49 Cet | A1V | 5.62 | 0.066 | 61 | (24) | ISO | (33) | 9.20.6 | [8,20] | (32,36) |
| HD 10472 | … | F2IV/V | 7.62 | 0.420 | 67 | (27) | MIPS∗ | (21) | 3.40.9 | [20,150] | Table 4 |
| HD 10647 | … | F8V | 5.52 | 0.551 | 17 | (31) | ISO/MIPS∗ | (6) | 3.00.3 | [300,7000] | (18,36) |
| HD 10638 | … | A3 | 6.73 | 0.247 | 72 | (27) | … | … | 3.90.5 | [20,150] | Table 4 |
| HD 15115 | … | F2 | 6.79 | 0.399 | 45 | (27) | ISO/MIPS | (27) | 4.90.4 | Table 4 | |
| HD 15745 | … | F0 | 7.47 | 0.360 | 64 | (27) | ISO/MIPS | (27) | 20.11.4 | 700 | (18,36) |
| HD 16743 | … | F0/F2III/IV | 6.78 | 0.387 | 60 | this work | MIPS | … | 3.60.3 | (18) | |
| HD 17390 | … | F3IV/V | 6.48 | 0.387 | 45 | (27) | ISO/MIPS∗ | (1) | 1.90.2 | 800 | (18,36) |
| HD 21997 | … | A3IV/V | 6.38 | 0.120 | 74 | (20) | IRS | (12) | 4.70.3 | Table 4 | |
| HD 24966 | … | A0V | 6.89 | 0.023 | 104 | (27) | … | … | 2.40.5 | 100 | this work |
| HD 25457 | … | F5V | 5.38 | 0.516 | 19 | (27) | ISO/MIPS | (9,27) | 1.00.2 | [50,100] | Table 4 |
| HD 30447 | … | F3V | 7.85 | 0.393 | 78 | (27) | ISO/MIPS | (1) | 7.51.1 | Table 4 | |
| HD 32297 | … | A0 | 8.13 | 0.199 | 112 | (27) | COR | (26) | 33.46.0 | 30 | (13) |
| HD 35841 | … | F5V | 8.91 | 0.496 | (27) | … | … | 15.53.7 | Table 4 | ||
| HD 37484 | … | F3V | 7.26 | 0.404 | 60 | (20) | ISO/MIPS | (9,27) | 2.70.5 | Table 4 | |
| HD 38207 | … | F2V | 8.47 | 0.391 | (27) | ISO/MIPS | (9,27) | 10.80.6 | Table 4 | ||
| HD 38206 | … | A0V | 5.73 | -0.014 | 69 | (17) | MIPS | (22) | 1.40.3 | Table 4 | |
| HD 38678 | A2Vann | 3.55 | 0.104 | 22 | (19) | ISO/MIPS∗ | (7) | 1.10.2 | Table 4 | ||
| HD 39060 | A3V | 3.85 | 0.171 | 19 | (28) | ISO/COR/SUBM | (8,10,28) | 24.31.1 | Table 4 | ||
| HD 50571 | … | F7III-IV | 6.11 | 0.457 | 33 | this work | MIPS∗ | … | 1.10.3 | (18) | |
| HD 53143 | … | K0IV-V | 6.81 | 0.786 | 18 | (17) | ISO | (6) | 2.00.5 | (6) | |
| HD 54341 | … | A0V | 6.52 | -0.008 | 93 | this work | … | … | 1.80.4 | 100 | this work |
| HD 69830 | … | K0V | 5.95 | 0.754 | 13 | (17) | IRS | (3) | 2.0aaBeichman et al. (2005b) demonstrated the presence of strong spectral features for this object, therefore we took their fractional luminosity estimate rather than fitting the photometric points by a modified blackbody | [600,4700] | (29,35) |
| HD 76582 | … | F0IV | 5.68 | 0.209 | 49 | (27) | … | … | 1.70.2 | this work | |
| HD 78702 | … | A0/A1V | 5.73 | 0.000 | 80 | (27) | … | … | 2.10.7 | this work | |
| HD 84870A | … | A3 | 7.20 | 0.233 | 90 | (27) | … | … | 4.51.0 | 520 | this work |
| HD 85672 | … | A0 | 7.59 | 0.159 | 93 | (27) | … | … | 4.91.0 | 100 | this work |
| HD 92945 | … | K1V | 7.72 | 0.873 | 22 | (27) | MIPS | (5) | 5.31.2 | 100 | (30,35) |
| HD 107146 | … | G2V | 7.04 | 0.604 | 29 | (27) | MIPS/COR/SUBM | (2,9,34) | 9.20.9 | (34,36) | |
| HD 109573A | HR 4796A | A0V | 5.78 | 0.003 | 67 | (11) | MIR/COR | (14,25) | 47.02.5 | Table 4 | |
| HD 110058 | … | A0V | 7.99 | 0.148 | 100 | (17) | ISO | (1) | 18.93.3 | 100 | this work |
| HD 115116 | … | A7V | 7.07 | 0.205 | 85 | this work | … | … | 3.21.0 | 360 | this work |
| HD 120534 | … | A5V | 7.02 | 0.275 | (27) | … | … | 4.90.9 | 320 | this work | |
| HD 121812 | … | K0 | 8.53 | 0.820 | 38 | this work | … | … | 14.94.1 | this work | |
| HD 122106 | … | F8V | 6.36 | 0.486 | 78 | this work | … | … | 1.20.4 | [1000,1600] | (18,23) |
| HD 127821 | … | F4IV | 6.10 | 0.428 | 32 | (27) | MIPS∗ | … | 2.20.4 | [200,3400] | (18,36) |
| HD 130693 | … | G6V | 8.20 | 0.734 | this work | … | … | 5.81.9 | this work | ||
| HD 131835 | … | A2IV | 7.88 | 0.192 | 111 | this work | … | … | 19.93.3 | Table 4 | |
| HD 157728 | … | F0IV | 5.70 | 0.229 | 43 | (31) | … | … | 2.90.4 | 200 | this work |
| HD 158352 | … | A8V | 5.41 | 0.237 | 63 | (19) | … | … | 1.80.5 | this work | |
| HD 164249 | … | F5V | 7.01 | 0.458 | 47 | (27) | ISO/MIPS∗ | (27) | 10.41.6 | Table 4 | |
| HD 169666 | … | F5 | 6.68 | 0.444 | 51 | this work | MIPS | … | 1.50.3 | (18) | |
| HD 170773 | … | F5V | 6.22 | 0.429 | 36 | (24) | ISO/MIPS∗ | (27) | 3.80.4 | [200,2800] | (18,36) |
| HD 172555 | … | A7V | 4.78 | 0.199 | 29 | (19) | MIPS∗ | … | 7.80.7 | Table 4 | |
| HD 181296 | A0Vn | 5.03 | 0.020 | 48 | (17) | ISO/MIPS∗ | (27) | 2.40.2 | Table 4 | ||
| HD 181327 | … | F5/F6V | 7.04 | 0.480 | 51 | (17) | ISO/MIPS∗ | (1) | 29.31.6 | Table 4 | |
| HD 182681 | … | B8/B9V | 5.66 | -0.014 | 69 | this work | … | … | 1.50.3 | 100 | this work |
| HD 191089 | … | F5V | 7.18 | 0.480 | 54 | (17) | ISO/MIPS∗ | (1) | 19.12.2 | Table 4 | |
| HD 192758 | … | F0V | 7.02 | 0.317 | (27) | ISO/MIPS | (1) | 5.60.5 | [35,55] | Table 4 | |
| HD 197481 | AU Mic | M1Ve | 8.81 | 1.470 | 10 | (27) | MIPS/COR/SUBM | (5,15,16) | 4.00.3 | Table 4 | |
| HD 202917 | … | G5V | 8.65 | 0.690 | 46 | (27) | MIPS∗ | (27) | 2.90.8 | Table 4 | |
| HD 205674 | … | F3/F5IV | 7.19 | 0.396 | 53 | this work | MIPS∗ | … | 3.50.8 | (18) | |
| HD 206893 | … | F5V | 6.69 | 0.439 | 39 | (27) | ISO/MIPS∗ | (27) | 2.30.2 | 2800 | (18,36) |
| HD 218396 | … | A5V | 5.97 | 0.259 | 40 | (27) | ISO | (27) | 2.30.2 | [20,150] | Table 4 |
| HD 221853 | … | F0 | 7.35 | 0.405 | 71 | (27) | ISO/MIPS | (27) | 8.01.1 | [20,150] | Table 4 |
Note. — Col.(1): Names. Col.(2): Other names. Cols.(3-5): Data are from the Hipparcos or the Tycho-2 Spectral Type Catalog. Col.(6): Distances. P indicates photometric distances otherwise Hipparcos distances were used. Col.(7): Reference for first identification as debris disks. Col.(8): Observations following the original IRAS discovery which independently confirmed the existence of the debris disk. COR: Coronographic observation; ISO: ISOPHOT; MIR: Observation at mid-infrared wavelengths; IRS: Spitzer IRS; MIPS: Spitzer MIPS; SUBM: Observation at submillimeter wavelengths. ∗ marks those MIPS observations when we extracted only astrometrical information from the maps, but did not determine photometric fluxes. Col.(9): References for papers related to observations of Col.(8). Col.(10): Fractional dust luminosities and their uncertainties. Col.(11): Ages estimates. [t1,t2] marks an age interval. Col.(12) References for age estimates.
References. — (1) Ábrahám et al., 2006, in prep.; (2) Ardila et al. (2004); (3) Beichman et al. (2005b); (4) Carpenter et al. (2005); (5) Chen et al. (2005b); (6) Decin et al. (2000); (7) Habing et al. (2001); (8) Heinrichsen et al.(1999); (9) http://data.spitzer.caltech.edu/popular/feps/20051123_enhanced_v1/, FEPS Data Explanatory Supplement v3.0, Hines et al. (2005); (10) Holland et al. (1998); (11) Jura (1991); (12) Jura et al. (2004); (13) Kalas (2005); (14) Koerner et al. (1998); (15) Krist et al. (2005); (16) Liu et al. (2004); (17) Mannings & Barlow (1998); (18) Nordström et al. (2004); (19) Oudmaijer et al. (1992); (20) Patten & Willson (1991); (21) Rebull et al. (2005); (22) Rieke et al. (2005); (23) Rocha-Pinto et al. (2004); (24) Sadakane & Nishida (1986); (25) Schneider et al. (1999); (26) Schneider et al. (2005); (27) Silverstone (2000); (28) Smith & Terrile (1984); (29) Song et al. (2000); (30) Song et al. (2004); (31) Stencel & Backman (1991); (32) Thi et al.(2001); (33) Walker and Heinrichsen (2000); (34) Williams et al. (2004); (35) Wright et al. (2004); (36) Zuckerman & Song (2004a); ’Table 4’ refers to ages of stellar kinematic groups, as presented in Table 4.
| Name | Instrument | Wavelength | Measured flux | Flux | Photosph. | Ref. | |
|---|---|---|---|---|---|---|---|
| uncorrected | corrected | quality | flux | ||||
| [m] | [Jy] | [Jy] | [Jy] | ||||
| HD 105 | ISOPHOT | 60 | 0.1070.014 | 0.1080.014 | … | 3.9e-03 | 1 |
| MIPS | 70 | 0.1450.012 | 0.1640.014 | … | 2.9e-03 | 4 | |
| ISOPHOT | 90 | 0.1470.010 | 0.1590.011 | … | 1.7e-03 | 1 | |
| MIPS | 160 | 0.1660.028 | 0.1710.029 | … | 5.5e-04 | 4 | |
| HD 377 | MIPS | 24 | 0.0350.002 | 0.0350.002 | … | 0.025 | 4 |
| IRAS | 60 | 0.1790.014 | 0.1850.015 | 3 | 4.0e-03 | 5 | |
| MIPS | 70 | 0.1460.017 | 0.1580.018 | … | 2.9e-03 | 4 | |
| HD 3003 | IRAS | 25 | 0.3430.027 | 0.3200.026 | 3 | 0.063 | 8 |
| HD 6798 | IRAS | 25 | 0.1110.018 | 0.1080.017 | 3 | 0.039 | 8 |
| IRAS | 60 | 0.4030.048 | 0.4140.050 | 2 | 6.7e-03 | 8 | |
| HD 8907 | IRAS | 60 | 0.2850.054 | 0.3050.058 | 3 | 7.4e-03 | 8 |
| ISOPHOT | 60 | 0.2240.020 | 0.2320.021 | … | 7.4e-03 | 1 | |
| MIPS | 70 | 0.2320.007 | 0.2560.008 | … | 5.4e-03 | 4 | |
| ISOPHOT | 90 | 0.2640.018 | 0.2700.018 | … | 3.3e-03 | 1 | |
| HD 9672 | IRAS | 25 | 0.3840.042 | 0.4380.048 | 3 | 0.041 | 8 |
| IRAS | 60 | 2.020.12 | 2.090.13 | 3 | 7.0e-03 | 8 | |
| IRAS | 100 | 1.880.21 | 1.850.20 | 2 | 2.5e-03 | 8 | |
| ISOPHOT | 120 | 1.450.38 | 1.320.35 | … | 1.7e-03 | 1 | |
| ISOPHOT | 170 | 0.8620.181 | 0.7720.162 | … | 8.7e-04 | 1 | |
| HD 10472 | IRAS | 60 | 0.1400.032 | 0.1450.033 | 2 | 2.4e-03 | 8 |
| HD 10647 | IRAS | 60 | 0.8150.106 | 0.8770.114 | 3 | 0.024 | 8 |
| ISOPHOT | 60 | 0.8030.040 | 0.8240.041 | … | 0.024 | 1 | |
| IRAS | 100 | 1.080.17 | 1.080.17 | 2 | 8.7e-03 | 8 | |
| HD 10638 | IRAS | 60 | 0.3480.038 | 0.3600.040 | 3 | 3.6e-03 | 8 |
| HD 15115 | MIPS | 24 | 0.0550.006 | 0.0540.006 | … | 0.032 | 7 |
| IRAS | 60 | 0.4410.048 | 0.4730.052 | 3 | 5.1e-03 | 8 | |
| ISOPHOT | 60 | 0.4010.019 | 0.4150.020 | … | 5.1e-03 | 1 | |
| ISOPHOT | 90 | 0.4190.029 | 0.4270.030 | … | 2.2e-03 | 1 | |
| HD 15745 | MIPS | 24 | 0.1620.016 | 0.1680.017 | … | 0.016 | 7 |
| IRAS | 25 | 0.1770.028 | 0.2070.033 | 2 | 0.015 | 8 | |
| IRAS | 60 | 0.8680.061 | 0.8750.061 | 3 | 2.6e-03 | 8 | |
| ISO | 60 | 0.7530.038 | 0.7700.039 | … | 2.6e-03 | 1 | |
| ISO | 90 | 0.5320.037 | 0.5150.036 | … | 1.1e-03 | 1 | |
| HD 16743 | MIPS | 24 | 0.0490.005 | 0.0490.005 | … | 0.029 | 7 |
| IRAS | 60 | 0.3040.033 | 0.3230.036 | 3 | 4.6e-03 | 8 | |
| HD 17390 | IRAS | 60 | 0.2260.034 | 0.2400.036 | 3 | 6.4e-03 | 8 |
| ISO | 60 | 0.2530.021 | 0.2620.022 | … | 6.4e-03 | 1 | |
| ISO | 90 | 0.2280.023 | 0.2310.023 | … | 2.8e-03 | 1 | |
| HD 21997 | IRAS | 60 | 0.5950.036 | 0.6460.039 | 3 | 3.9e-03 | 8 |
| IRAS | 100 | 0.6360.108 | 0.6290.107 | 2 | 1.4e-03 | 8 | |
| HD 24966 | IRAS | 60 | 0.1840.031 | 0.1900.032 | 3 | 1.9e-03 | 8 |
| HD 25457 | MIPS | 24 | 0.2020.011 | 0.2040.011 | … | 0.147 | 4 |
| IRAS | 60 | 0.2870.075 | 0.2850.074 | 2 | 0.023 | 8 | |
| ISOPHOT | 60 | 0.2930.030 | 0.2970.030 | … | 0.023 | 1 | |
| MIPS | 70 | 0.2880.012 | 0.3100.013 | … | 0.017 | 4 | |
| ISOPHOT | 90 | 0.2460.018 | 0.2420.018 | … | 0.010 | 1 | |
| HD 30447 | MIPS | 24 | 0.0280.003 | 0.0280.003 | … | 0.012 | 7 |
| IRAS | 60 | 0.2740.030 | 0.2960.033 | 3 | 1.9e-03 | 8 | |
| ISO | 60 | 0.2470.062 | 0.2560.064 | … | 1.9e-03 | 1 | |
| ISO | 90 | 0.2710.065 | 0.2770.067 | … | 8.3e-04 | 1 | |
| HD 32297 | IRAS | 25 | 0.2110.034 | 0.2560.041 | 2 | 5.7e-03 | 8 |
| IRAS | 60 | 1.120.07 | 1.140.07 | 3 | 9.7e-04 | 8 | |
| HD 35841 | IRAS | 60 | 0.1880.040 | 0.1950.041 | … | 8.1e-04 | 8 |
| HD 37484 | MIPS | 24 | 0.0530.003 | 0.0550.003 | … | 0.021 | 4 |
| IRAS | 60 | 0.1280.036 | 0.1240.035 | 2 | 3.3e-03 | 8 | |
| ISOPHOT | 60 | 0.0940.012 | 0.0950.012 | … | 3.3e-03 | 1 | |
| MIPS | 70 | 0.1040.011 | 0.1100.012 | … | 2.4e-03 | 4 | |
| ISOPHOT | 90 | 0.0470.012 | 0.0440.011 | … | 1.5e-03 | 1 | |
| HD 38207 | MIPS | 24 | 0.0170.003 | 0.0170.003 | … | 6.9e-03 | 4 |
| ISOPHOT | 60 | 0.2050.015 | 0.2120.015 | … | 1.1e-03 | 1 | |
| MIPS | 70 | 0.1780.006 | 0.1940.007 | … | 7.9e-04 | 4 | |
| ISOPHOT | 90 | 0.1770.013 | 0.1770.013 | … | 4.8e-04 | 1 | |
| HD 38206 | MIPS | 24 | 0.1150.023 | 0.1190.024 | … | 0.033 | 9 |
| IRAS | 25 | 0.1100.021 | 0.1130.021 | 2 | 0.030 | 8 | |
| IRAS | 60 | 0.3130.038 | 0.3130.038 | 3 | 5.1e-03 | 8 | |
| HD 38678 | IRAS | 25 | 1.160.09 | 0.970.08 | 3 | 0.296 | 8 |
| IRAS | 60 | 0.3660.073 | 0.3020.060 | 3 | 0.051 | 8 | |
| ISOPHOT | 60 | 0.4040.020 | 0.3900.019 | … | 0.051 | 1 | |
| HD 39060 | IRAS | 12 | 3.400.14 | 2.380.10 | 3 | 1.09 | 8 |
| IRAS | 25 | 8.810.35 | 10.290.41 | 3 | 0.254 | 8 | |
| IRAS | 60 | 19.70.79 | 18.920.76 | 3 | 0.043 | 8 | |
| IRAS | 100 | 11.00.44 | 9.320.37 | 3 | 0.015 | 8 | |
| ISOPHOT | 120 | 7.91.2 | 6.681.01 | … | 0.011 | 1 | |
| ISOPHOT | 150 | 4.800.73 | 4.390.67 | … | 6.8e-03 | 1 | |
| ISOPHOT | 170 | 4.00.6 | 3.290.49 | … | 5.4e-03 | 1 | |
| ISOPHOT | 200 | 2.100.35 | 2.030.34 | … | 3.9e-03 | 1 | |
| HD 50571 | IRAS | 60 | 0.1830.040 | 0.1860.041 | 2 | 0.011 | 8 |
| HD 53143 | IRAS | 60 | 0.1520.040 | 0.1550.040 | 2 | 0.012 | 8 |
| ISOPHOT | 60 | 0.2140.011 | 0.2190.011 | … | 0.012 | 1 | |
| ISOPHOT | 90 | 0.1450.011 | 0.1420.011 | … | 5.1e-03 | 1 | |
| HD 54341 | IRAS | 60 | 0.2030.047 | 0.2100.048 | 2 | 2.7e-03 | 8 |
| HD 69830 | IRAS | 25 | 0.3410.038 | 0.2920.032 | 3 | 0.142 | 8 |
| HD 76582 | IRAS | 60 | 0.3910.047 | 0.4030.048 | 3 | 9.2e-03 | 8 |
| HD 78702 | IRAS | 60 | 0.3140.047 | 0.3270.049 | 2 | 5.6e-03 | 8 |
| IRAS | 100 | 0.9540.267 | 0.9870.276 | 2 | 2.0e-03 | 8 | |
| HD 84870A | IRAS | 60 | 0.2430.046 | 0.2520.048 | 3 | 2.4e-03 | 8 |
| HD 85672 | IRAS | 60 | 0.1930.037 | 0.2000.038 | 3 | 1.4e-03 | 8 |
| HD 92945 | IRAS | 60 | 0.2480.045 | 0.2700.049 | 3 | 6.3e-03 | 8 |
| MIPS | 70 | 0.2710.060 | 0.3010.067 | … | 4.6e-03 | 2 | |
| HD 107146 | MIPS | 24 | 0.0600.003 | 0.0590.003 | … | 0.042 | 4 |
| IRAS | 60 | 0.7050.056 | 0.7770.062 | 3 | 6.7e-03 | 8 | |
| MIPS | 70 | 0.6480.014 | 0.7270.016 | … | 4.9e-03 | 4 | |
| IRAS | 100 | 0.9100.155 | 0.9130.155 | 2 | 2.4e-03 | 8 | |
| SCUBA | 450 | 0.1300.040 | 0.1300.040 | … | 1.1e-04 | 10 | |
| SCUBA | 850 | 0.0200.004 | 0.0200.004 | … | 3.2e-05 | 10 | |
| HD 109573A | IRAS | 12 | 0.2840.011 | 0.2140.009 | 3 | 0.131 | 5 |
| IRAS | 25 | 3.730.00aaNo quoted flux uncertainty in the IRAS Serendipitous Survey Catalog. We assumed Jy, and Jy (4% relative uncertainty in both cases). | 4.380.00aaNo quoted flux uncertainty in the IRAS Serendipitous Survey Catalog. We assumed Jy, and Jy (4% relative uncertainty in both cases). | 3 | 0.031 | 5 | |
| IRAS | 60 | 8.070.00aaNo quoted flux uncertainty in the IRAS Serendipitous Survey Catalog. We assumed Jy, and Jy (4% relative uncertainty in both cases). | 7.710.00aaNo quoted flux uncertainty in the IRAS Serendipitous Survey Catalog. We assumed Jy, and Jy (4% relative uncertainty in both cases). | 3 | 5.2e-03 | 5 | |
| IRAS | 100 | 4.090.08 | 3.860.08 | 3 | 1.9e-03 | 5 | |
| SCUBA | 850 | 0.0190.004 | 0.0190.004 | … | 2.5e-05 | 3 | |
| HD 110058 | IRAS | 25 | 0.2660.029 | 0.3000.033 | 3 | 5.7e-03 | 8 |
| IRAS | 60 | 0.3680.062 | 0.3410.058 | 2 | 9.8e-04 | 8 | |
| ISOPHOT | 60 | 0.3870.085 | 0.3870.085 | … | 9.8e-04 | 1 | |
| ISOPHOT | 90 | 0.2180.050 | 0.2010.046 | … | 4.3e-04 | 1 | |
| HD 115116 | IRAS | 60 | 0.1920.054 | 0.1980.056 | 2 | 2.5e-03 | 8 |
| HD 120534 | IRAS | 60 | 0.3150.047 | 0.3260.049 | … | 3.3e-03 | 8 |
| HD 121812 | IRAS | 60 | 0.2630.047 | 0.2890.052 | 3 | 2.7e-03 | 8 |
| IRAS | 100 | 0.4840.135 | 0.4920.138 | 2 | 9.6e-04 | 8 | |
| HD 122106 | IRAS | 60 | 0.1610.042 | 0.1640.043 | 2 | 9.2e-03 | 8 |
| HD 127821 | IRAS | 60 | 0.3440.041 | 0.3760.045 | 3 | 0.011 | 8 |
| IRAS | 100 | 0.5250.137 | 0.5290.138 | 2 | 3.8e-03 | 8 | |
| HD 130693 | IRAS | 60 | 0.1490.042 | 0.1540.043 | … | 3.2e-03 | 8 |
| HD 131835 | IRAS | 25 | 0.1860.034 | 0.2240.040 | 2 | 6.1e-03 | 8 |
| IRAS | 60 | 0.6840.062 | 0.6810.061 | 3 | 1.0e-03 | 8 | |
| HD 157728 | IRAS | 25 | 0.2130.019 | 0.2210.020 | 3 | 0.053 | 8 |
| IRAS | 60 | 0.5360.048 | 0.5310.048 | 3 | 9.0e-03 | 8 | |
| HD 158352 | IRAS | 25 | 0.2580.044 | 0.2550.043 | 3 | 0.075 | 8 |
| IRAS | 60 | 0.3660.062 | 0.3480.059 | 2 | 0.013 | 8 | |
| HD 164249 | IRAS | 60 | 0.6470.091 | 0.6690.094 | 2 | 4.7e-03 | 8 |
| ISOPHOT | 60 | 0.7400.037 | 0.7610.038 | … | 4.7e-03 | 1 | |
| ISOPHOT | 90 | 0.5680.040 | 0.5600.039 | … | 2.1e-03 | 1 | |
| HD 169666 | MIPS | 24 | 0.0870.009 | 0.0900.009 | … | 0.039 | 7 |
| IRAS | 25 | 0.1010.013 | 0.0880.011 | 3 | 0.036 | 8 | |
| HD 170773 | IRAS | 60 | 0.5040.086 | 0.5550.094 | 2 | 9.1e-03 | 8 |
| ISOPHOT | 60 | 0.5470.027 | 0.5620.028 | … | 9.1e-03 | 1 | |
| ISOPHOT | 90 | 0.7710.054 | 0.8210.057 | … | 4.0e-03 | 1 | |
| HD 172555 | IRAS | 12 | 1.520.06 | 1.340.05 | 3 | 0.508 | 8 |
| IRAS | 25 | 1.090.06 | 0.910.05 | 3 | 0.119 | 8 | |
| IRAS | 60 | 0.3060.046 | 0.2410.036 | 3 | 0.020 | 8 | |
| HD 181296 | IRAS | 12 | 0.4810.024 | 0.3510.018 | 3 | 0.264 | 8 |
| IRAS | 25 | 0.4910.025 | 0.4960.025 | 3 | 0.061 | 8 | |
| IRAS | 60 | 0.4950.045 | 0.4490.040 | 3 | 0.011 | 8 | |
| ISOPHOT | 60 | 0.4360.022 | 0.4330.022 | … | 0.011 | 1 | |
| ISOPHOT | 90 | 0.3070.022 | 0.2860.021 | … | 4.6e-03 | 1 | |
| HD 181327 | IRAS | 25 | 0.2480.020 | 0.2860.023 | 3 | 0.027 | 8 |
| IRAS | 60 | 1.860.07 | 1.930.08 | 3 | 4.7e-03 | 8 | |
| ISOPHOT | 60 | 1.690.17 | 1.730.17 | … | 4.7e-03 | 1 | |
| ISOPHOT | 90 | 1.400.14 | 1.410.14 | … | 2.1e-03 | 1 | |
| IRAS | 100 | 1.720.21 | 1.690.20 | 2 | 1.7e-03 | 8 | |
| ISOPHOT | 170 | 0.8200.214 | 0.7360.192 | … | 5.9e-04 | 1 | |
| HD 182681 | IRAS | 60 | 0.4120.066 | 0.4260.068 | 2 | 5.6e-03 | 8 |
| HD 191089 | IRAS | 25 | 0.3390.051 | 0.3870.058 | 2 | 0.024 | 8 |
| IRAS | 60 | 0.7110.057 | 0.7290.058 | 3 | 4.1e-03 | 8 | |
| ISOPHOT | 60 | 0.7740.080 | 0.7810.081 | … | 4.1e-03 | 1 | |
| ISOPHOT | 90 | 0.3940.040 | 0.3700.038 | … | 1.8e-03 | 1 | |
| HD 192758 | MIPS | 24 | 0.0420.004 | 0.0410.004 | … | 0.022 | 7 |
| IRAS | 60 | 0.3600.050 | 0.3880.054 | … | 3.5e-03 | 8 | |
| ISOPHOT | 60 | 0.3700.022 | 0.3830.023 | … | 3.5e-03 | 1 | |
| ISOPHOT | 90 | 0.3750.026 | 0.3840.027 | … | 1.6e-03 | 1 | |
| HD 197481 | IRAS | 60 | 0.2690.046 | 0.2520.043 | 2 | 0.024 | 8 |
| MIPS | 70 | 0.1960.015 | 0.2070.016 | … | 0.017 | 2 | |
| SHARC | 350 | 0.0720.020 | 0.0720.020 | … | 6.8e-04 | 2 | |
| SCUBA | 850 | 0.0140.002 | 0.0140.002 | … | 1.1e-04 | 6 | |
| HD 202917 | ISOPHOT | 60 | 0.0460.014 | 0.0470.014 | … | 1.9e-03 | 1 |
| HD 205674 | IRAS | 60 | 0.1990.040 | 0.2050.041 | 3 | 3.7e-03 | 8 |
| HD 206893 | IRAS | 60 | 0.2280.039 | 0.2470.042 | 3 | 6.3e-03 | 8 |
| ISOPHOT | 60 | 0.2340.015 | 0.2420.016 | … | 6.3e-03 | 1 | |
| ISOPHOT | 90 | 0.2590.018 | 0.2680.019 | … | 2.8e-03 | 1 | |
| HD 218396 | IRAS | 60 | 0.4100.061 | 0.4500.068 | 3 | 8.6e-03 | 8 |
| ISOPHOT | 60 | 0.4000.020 | 0.4120.021 | … | 8.6e-03 | 1 | |
| ISOPHOT | 90 | 0.5530.039 | 0.5850.041 | … | 3.8e-03 | 1 | |
| HD 221853 | MIPS | 24 | 0.0790.008 | 0.0820.008 | … | 0.019 | 7 |
| IRAS | 60 | 0.3270.062 | 0.3290.062 | 3 | 3.0e-03 | 8 | |
| ISO | 60 | 0.3680.031 | 0.3760.032 | … | 3.0e-03 | 1 | |
| ISO | 90 | 0.2310.016 | 0.2230.015 | … | 1.3e-03 | 1 | |
Note. — Col.(1): Names. Col.(2): Instrument. Col.(3): Wavelength. Cols.(4-5): Measured flux density and uncertainty at the specific wavelength. On the infrared flux density values in Col.(5) color correction was applied. No color correction was applied on submillimeter fluxes. Col.(6): Quality of flux density, if available. Col.(7): Predicted flux density of the stellar photosphere at the specific wavelength. For a detailed description of the prediction method, see Sect. 2.1. Col.(8): References for papers related to the quoted flux and its uncertainty in Cols.(4-5).
References. — (1) Ábrahám et al., 2006, in prep.; (2) Chen et al. (2005b); (3) Greaves et al. (2000); (4) http://data.spitzer.caltech.edu/popular/feps/20051123_enhanced_v1/, FEPS Data Explanatory Supplement v3.0, Hines et al. (2005); (5) Kleinmann et al. (1986); (6) Liu et al. (2004); (7) Moór et al. (2006), in prep.; (8) Moshir et al. (1989); (9) Rieke et al. (2005); (10) Williams et al. (2004).
| Name | Ref. | U | V | W | Assoc. SKG | Prob. | Ref. | |
|---|---|---|---|---|---|---|---|---|
| [km s-1] | [km s-1] | [km s-1] | [km s-1] | [%] | ||||
| HD 105 | 7 | 78 | 6 | |||||
| HD 377 | 7 | … | … | 15 | ||||
| HD 3003 | 13 | 85 | 15 | |||||
| HD 6798 | 5 | … | … | … | ||||
| HD 8907 | 7 | … | … | … | ||||
| HD 9672 | 5 | … | … | … | ||||
| HD 10472 | this work | 38 | this work | |||||
| HD 10647 | 7 | … | … | … | ||||
| HD 10638 | 11 | 29 | this work | |||||
| HD 15115 | this work | 22 | this work | |||||
| HD 15745 | this work | … | … | … | ||||
| HD 16743 | this work | … | … | … | ||||
| HD 17390 | 7 | … | … | … | ||||
| HD 21997 | 5 | 62 | this work | |||||
| HD 24966 | this work | … | … | … | ||||
| HD 25457 | 7 | 30 | 16 | |||||
| HD 30447 | this work | 54 | this work | |||||
| HD 32297 | this work | … | … | … | ||||
| HD 35841 | this work | 56 | this work | |||||
| HD 37484 | this work | 25 | this work | |||||
| HD 38207 | this work | 32 | this work | |||||
| HD 38206 | 5 | 27 | this work | |||||
| HD 38678 | 5 | 28 | 1 | |||||
| HD 39060 | 14 | 98 | 2 | |||||
| HD 50571 | 7 | … | … | … | ||||
| HD 53143 | 7 | … | … | … | ||||
| HD 54341 | this work | … | … | … | ||||
| HD 69830 | 7 | … | … | … | ||||
| HD 76582 | 11 | … | … | … | ||||
| HD 78702 | 5 | … | … | … | ||||
| HD 84870A | this work | … | … | … | ||||
| HD 85672 | 4 | … | … | … | ||||
| HD 92945 | 7 | … | … | … | ||||
| HD 107146 | 7 | … | … | … | ||||
| HD 109573A | 5 | 64 | 10 | |||||
| HD 110058 | this work | … | … | … | ||||
| HD 115116 | 4 | … | … | … | ||||
| HD 120534 | this work | … | … | … | ||||
| HD 121812 | 8 | … | … | … | ||||
| HD 122106 | 7 | … | … | … | ||||
| HD 127821 | 7 | … | … | … | ||||
| HD 130693 | this work | … | … | … | ||||
| HD 131835 | this work | 50 | 12 | |||||
| HD 157728 | 11 | … | … | … | ||||
| HD 158352 | 11 | … | … | … | ||||
| HD 164249 | 7 | 20 | 9 | |||||
| HD 169666 | 7 | … | … | … | ||||
| HD 170773 | 7 | … | … | … | ||||
| HD 172555 | 11 | 96 | 9 | |||||
| HD 181296 | 13 | 87 | 9 | |||||
| HD 181327 | 7 | 57 | 9 | |||||
| HD 182681 | 3 | … | … | … | ||||
| HD 191089 | 7 | 38 | this work | |||||
| HD 192758 | this work | 50 | this work | |||||
| HD 197481 | 5 | 56 | 2 | |||||
| HD 202917 | 7 | 48 | 15 | |||||
| HD 205674 | this work | … | … | … | ||||
| HD 206893 | 7 | … | … | … | ||||
| HD 218396 | 5 | 62 | this work | |||||
| HD 221853 | this work | 94 | this work |
Note. — Col.(1): Names. Col.(2): Radial velocity and its uncertainty. Col.(3): Reference for the source of measurement. Cols.(4-6): U,V,W Galactic space velocity components,U is positive towards the Galactic centre, V is positive in the direction of galactic rotation and W is positive towards the North galactic pole. Col.(7): Assigned stellar kinematic group (see Table 4). Col.(8): Membership probability. Col.(9): Reference for membership identification.
References. — (1) Barrado y Navascués et al. (1998); (2) Barrado y Navascués et al. (1999); (3) Evans (1967); (4) Grenier et al. (1999); (5) Kharchenko et al. and references therein (2004); (6) Mamajek et al. (2004a); (7) Nordström et al. and references therein (2004); (8) Strassmeier et al. (2000); (9) Song et al. (2003); (10) Webb et al.(1999); (11) Wilson (1953); (12) de Zeeuw et al. (1999); (13) Zuckerman & Webb (2000); (14) Zuckerman et al. (2001a); (15) Zuckerman et al. (2001b); (16) Zuckerman & Song (2004b)
| Group Name | U,V,W | Ref. | Age | Ref. |
|---|---|---|---|---|
| [km s-1] | [Myr] | |||
| AB Dor Moving Group | -8, -27, -14 | 13 | 50 | 13 |
| 100 | 3 | |||
| Pictoris Moving Group | -11, -16, -9 | 13 | 11 | |
| Castor Moving Group | -10.7, -8.0, -9.7 | 1 | 1 | |
| Great Austral Young Association2 | -11.0, -22.5, -4.6 | 9 | 9 | |
| Hyades cluster | -40, -17, -3 | 13 | 600 | 13 |
| IC 2391 supercluster | -20.6, -15.7, -9.1 | 5 | 35–55 | 5 |
| Local Association | -11.6, -21.0, -11.4 | 5 | 20–150 | 5 |
| Lower Centaurus Crux | -8.2, -18.6, -6.4 | 6 | 4 | |
| Upper Centaurus Lupus | -6.8, -19.3, -5.7 | 6 | 4 | |
| Tucana/Horologium | -11, -21, 0 | 13 | 13 | |
| 10–30 | 7 | |||
| 20 | 8 | |||
| 10–40 | 12 | |||
| TW Hydrae Association | -11, -18, -5 | 13 | 8 | 13 |
| 5–15 | 10 | |||
| Ursa Major Moving Group | +14, +1, -9 | 13 | 300 | 13 |
| 500 | 2 |
References. — (1) Barrado y Navascués et al. (1998); (2) King et al. (2003); (3) Luhman et al. (2005); (4) Mamajek et al. (2002); (5) Montes et al. and references therein (2001); (6) Sartori et al. (2003); (7) Stelzer & Neuhäuser (2000); (8) Torres et al. (2000); (9) Torres et al. (2002); (10) Weintraub et al. (2000); (11) Zuckerman et al.(2001a); (12) Zuckerman et al. (2001b); (13) Zuckerman & Song and references therein (2004b);
| Name | Age estimates | References |
|---|---|---|
| [Myr] | ||
| HD 10472 | 5 | |
| 30 | 8 | |
| [20,150] | this study | |
| HD 15115 | 5 | |
| 100 | 8 | |
| this study | ||
| HD 21997 | 100 | 8 |
| this study | ||
| HD 30447 | 5 | |
| 8 | ||
| this study | ||
| HD 37484 | 5 | |
| [30,100] | 1 | |
| this study | ||
| HD 38207 | [100,300] | 1 |
| this study | ||
| HD 38206 | 3 | |
| this study | ||
| HD 191089 | 4 | |
| 5 | ||
| 8 | ||
| this study | ||
| HD 218396 | 7 | |
| 30 | 8 | |
| [20,150] | this study | |
| HD 221853 | 800 | 6 |
| 1800 | 2 | |
| 5 | ||
| 8 | ||
| [20,150] | this study |
References. — (1) Carpenter et al. (2005); (2) Decin et al. (2000); (3) Gerbaldi et al. (1999); (4) Mamajek (2004); (5) Nordström et al. (2004); (6) Silverstone (2000); (7) Song et al. (2001); (8) Zuckerman & Song (2004a);
| Name | Nearby IRAS | First reference | Reason | Instrument | Position of unrelated | |
|---|---|---|---|---|---|---|
| Source | as debris disk | of rejection | nearby IR source | |||
| candidate | RA(2000) | DEC(2000) | ||||
| HD 23484 | F03423–3826 | 2aaSilverstone (2000) selected as debris disk candidate on the basis of IRAS data, but found that ISOPHOT observations did not confirm the detection of IR excess. He proposed that the non-detection of far-infrared flux excess towards the star’s position can be explained by cirrus contamination. | no detectable excessaaSilverstone (2000) selected as debris disk candidate on the basis of IRAS data, but found that ISOPHOT observations did not confirm the detection of IR excess. He proposed that the non-detection of far-infrared flux excess towards the star’s position can be explained by cirrus contamination. | ISOPHOT | … | … |
| HD 34739 | F05154–5301 | 2 | source confusion | MIPS | 5 16 36.3 | -52 57 40 |
| HD 53842 | F06539–8355 | 1 | source confusionbbHD 53842 is not really bogus. At 24m it shows IR excess above the photosphere (see Moór et al. 2006, in prep.). However at 70m the excess emission is related to a nearby infrared source. | MIPS | 6 46 02.8 | -83 59 37 |
| HD 56099 | F07149+5913 | 2 | source confusion | MIPS | 7 19 09.6 | +59 07 20 |
| HD 72390 | F08210–8414 | 2 | source confusion | ISOPHOT | 08 14 39 | -84 23 23 |
| HD 82821 | F09319+0346 | 2 | source confusion | MIPS | 09 34 36.2 | +03 32 39 |
| HD 143840 | F16001–0440 | 2 | extended emission | ISOPHOT, MIPS | … | … |
| HD 158373 | F17265–0957 | 2aaSilverstone (2000) selected as debris disk candidate on the basis of IRAS data, but found that ISOPHOT observations did not confirm the detection of IR excess. He proposed that the non-detection of far-infrared flux excess towards the star’s position can be explained by cirrus contamination. | no detectable excessaaSilverstone (2000) selected as debris disk candidate on the basis of IRAS data, but found that ISOPHOT observations did not confirm the detection of IR excess. He proposed that the non-detection of far-infrared flux excess towards the star’s position can be explained by cirrus contamination. | ISOPHOT | … | … |
| HD 164330 | F17559+6236 | 2aaSilverstone (2000) selected as debris disk candidate on the basis of IRAS data, but found that ISOPHOT observations did not confirm the detection of IR excess. He proposed that the non-detection of far-infrared flux excess towards the star’s position can be explained by cirrus contamination. | no detectable excessaaSilverstone (2000) selected as debris disk candidate on the basis of IRAS data, but found that ISOPHOT observations did not confirm the detection of IR excess. He proposed that the non-detection of far-infrared flux excess towards the star’s position can be explained by cirrus contamination. | ISOPHOT | … | … |
| HD 185053 | F19415–8123 | 2 | extended emission | MIPS | … | … |
| HD 204942 | F21297–2422 | 2 | source confusion | MIPS | 21 32 35.8 | -24 09 30 |
Note. — Col.(1): Name. Col.(2): Identification of nearby IRAS source. The IRAS source is always located within 30′′ of the star position. Col.(3): Reference for first mention as debris disk. Col.(4): Reason why the object was classified as bogus disk and rejected from further analyses. Col.(5): Instrument. Cols.(6-7): When the object was nominated as bogus disk due to source confusion, position of the unrelated nearby IR source is given. In the cases of MIPS observations MOPEX was used to extract source coordinates from 70 MIPS images. The coordinates of peak brightness in ISOPHOT maps were determined by fitting a point source profile.
References. — (1) Mannings & Barlow (1998); (2) Silverstone (2000).
| Name | Nearby IRAS | First reference | Reason of | Name of |
|---|---|---|---|---|
| Source | as debris disk | suspicion | background source | |
| candidate | ||||
| HIP 13005 | F02444+1505 | 2 | nearby extended 2MASS sourceaaZuckerman & Song (2004a) also found suspicious this debris candidate based on the offset between its IRAS positions measured at 12 and 60. | 2MASS J02471368+1518315 (XSC 122165) |
| HD 33095 | F05049–1927 | 2 | cirrus | … |
| HD 36162 | F05275+1519 | 2 | nearby extended 2MASS source | 2MASS J05303093+1521513 (XSC 2620748) |
| HD 39944 | F05526-2535 | 1 | nearby galaxybbSylvester & Mannings (2000) also noted this coincidence between the position of the IRAS source and the nearby galaxy. | ESO 488-41 |
| HD 83870 | F09393+4111 | 2 | nearby galaxy | PGC 27759 |
| HD 97455 | F11107+5541 | 2 | nearby galaxy | PGC 34197 |
| HD 124718 | F14129–2707 | 2 | nearby 2MASS source with an | 2MASS J14155109-2721050 |
| excess in the band | ||||
| HD 140775 | F15429+0536 | 2 | star locates in the wall of | … |
| Local Bubble or beyond | ||||
| HD 154145 | F17011–0004 | 2 | star locates in the wall of | … |
| Local Bubble or beyond |
Note. — Col.(1): Name. Col.(2): Identification of nearby IRAS source. The IRAS source is always located within 30′′ of the star position. Col.(3): Reference for first mention as debris disks. Col.(4): Reason of suspicion. For more details see Sect. 2.3. Col.(5): Name of background source.
References. — (1) Mannings & Barlow (1998); (2) Silverstone (2000).