Characterizing Stellar Populations in Spiral Disks
Abstract
It is now possible to measure detailed spectral indices for stellar populations in spiral disks. We propose to interpret these data using evolutionary synthesis models computed from the Star Formation Histories obtained from chemical evolutionary models. We find that this technique is a powerful tool to discriminate between old and young stellar populations. We show an example of the power of Integral Field spectroscopy in unveiling the spatial distribution of populations in a barred galaxy.
1 Introduction
The information obtained for a spiral galaxy may come from two sources: the gas or the stars. It is usually obtained from emission or absorption lines respectively (see hen99 for a review). In the case of spiral galaxies the spectra of the Hii regions which will display emission lines of H, [OIII] etc., provide information on the chemical abundances in the gas and/or the present Star Formation Rate (SFR). The atomic and/or molecular gas densities may also be estimated from observations. These data represent the present time state of a galaxy.
It is currently possible to perform spectrophotometric observations in different wavelength bands in order to obtain the radial distribution of surface brightness, colors, or even of spectral indices that quantify the absorption lines of the stellar disk. These observations measure the added light of all the stellar generations still present on the disk of the galaxy, thus providing information on the average properties of the disk over the galaxy life time.
The question then is how to use these two types of data, emission and absorption, to determine the history of a spiral galaxy. What are the possible evolutionary paths followed by a galaxy in order to reach the present observed state of its youngest generation while displaying the observed average properties?
2 Observing Spiral Disks
The measurement of the stellar absorption lines indices of a galaxy is important since these provide information on the averaged properties of the various stellar populations and thus represents a powerful tool in braking the age-abundance degeneracy (see next section). Historically observations of stellar absorption lines in spiral disks have been difficult to obtain because the flux level from the sky is usually very close to that emitted by the stellar populations under study, especially in the outer disk regions. The solution has been to obtain narrow-band images with filters specially designed for each galaxy beau97 or to perform Fabry-Perot interferometry with a Taurus-Tunable filter ryd05 . Both methods are conceptually similar, although the instrumentation is different. The idea resides in measuring fluxes within wavelength bands corresponding to specific spectral indices, as close in time as possible with the observations of the corresponding continuum bands. The galaxy disk is divided in concentric rings and the flux is then integrated azimuthally so that the effective signal-to-noise for the specific absorption line increases. A more modern approach is the use of a 3D spectroscopic instrument such as OASIS can05 or SAURON fal04 which offer high spatial and spectral resolution. These instruments allow separation of the gas and young stars emission line regions from the older phases of star formation.
3 The Degeneracy Problem : Theoretical Models
The information from the gas phase, such as density, abundance, actual star formation rate, is usually analyzed using chemical evolutionary models. They describe how the proportion of heavy elements present in the interstellar medium (ISM) increases, starting from primordial abundances, when stars evolve and die. Modern codes solve numerically the equation system used to describe a scenario based on initial conditions for the total mass of the region, the existence of infall or outflow of gas, and the initial mass function (IMF). Stellar mean-lifetimes and yields, known from stellar evolutionary tracks are also included. Finally, a star formation rate is assumed. These many inputs, which greatly influence the final results of a model, imply that a large number of parameters must be chosen. The best model for a galaxy will of course be the one which reproduces the observational data as closely as possible. The resulting star formation history (SFH) and the age-metallicity relation (AMR) might be taken as the basic relations to describe the evolution of the galaxy.
Chemical evolutionary models, however, suffer from the well known uniqueness problem: it is usually impossible to describe the evolution of a galaxy only by knowing the final state or present day abundances, since more than one evolutionary scenario can be used to reach the present situation. A solution is feasible however if the number of observations is larger than the number of parameters used to constrain the model.
On the other hand, data related to the stellar phase, such as the radial distribution of the surface brightness or colors, are usually analyzed through (evolutionary) synthesis models – see del05 for a recent and updated evolutionary synthesis model –, based on single stellar population (SSP) created by an instantaneous burst of star formation. These codes compute the spectral energy distribution (SED), , colors and spectral absorption indices emitted by a SSP of metallicity and age , from the sum of spectra of all stars created and distributed along a HR diagram, convolved with an initial mass function. This SED is a characteristic of each SSP of a given age and metallicity.
These models suffer, in turn, from a degeneracy problem: the old and metal-poor SSP show a similar SED than the young and metal-rich ones. A possible solution is to use absorption spectral indices, since some of them depend on while some others, particularly the Balmer and other hydrogen lines, depend only on . Thus, with two orthogonal indices, it is possible to find the parameters (, ) for a SSP. This technique was first developed and used to study globular clusters and elliptical galaxies, for which it was assumed that the star formation occurred in a short and early burst. It seems possible from this scheme to find when the burst took place, based on the age of the stellar population, and also what the metallicity of the stars is.
4 Applying Synthesis Models to Spiral Disks
When the star formation does not occur in a single burst, as it seems to be the case in spiral galaxies where the star formation is continuous, the characteristics found using a SSP model represent only averaged values. These are weighted by the luminosity of each stellar generation, since the final SED corresponds to the one emitted by the sum of different SSP’s when a convolution with the SFR, , is done :
| (1) |
where .
We must find, e.g. using a least square method, the best superposition of these SSP’s which will fit the data. We must estimate the proportion of each SSP defined by an age and a metallicity which better reproduce the observation. This would give the SFH, , and AMR (i.e. ). However, this method, in addition to being costly in computing-time, may produce some unphysical solutions. Due to this the SFH is usually assumed, not computed, e.g. an exponentially decreasing function of time. This also requires some hypotheses about the shape and the intensity of the SFR or, to avoid a bias, the adoption of many functions. This last option leads to an excessively large number of models. A second point, usually forgotten, is that , that is, the metallicity changes with time since stars continue to form. Therefore, it is not clear which must be selected at each time step without knowing how it is evolving in the galaxy. Usually, only one is used for the whole integration.
We suggest here a method to explore spiral galaxies, which are very well studied objects from the chemical evolutionary point of view. Since a large number of emission data is available, it is possible to compute and constrain chemical evolutionary models. The SFR and the AMR obtained as a result of these models may be used as an input for Eq. 1. If the SED, colors or absorption indices are well fitted simultaneously with the present–time data, we then have a good characterization of the evolutionary history of the galaxy.
We applied our technique to three Virgo galaxies for which the radial distribution of the spectral indices Fe5270 and Mg2 had been observed beau97 ; mol99 . We first computed the multiphase chemical evolutionary models for these galaxies, using a code that was developed for the Solar Neighbourhood fer92 and later applied to the Milky Way Galaxy (MWG) and to other spiral disks (see mol05 and references therein). As we explained in mol99 , the radial distribution of the spectral indices were predicted using Eq.1 where the SFH and AMR result from the best chemical evolution model.
In order to study the problems of uniqueness and degeneracy of these models, we performed 500 different models for one of the three Virgo galaxies: NGC 4303 mol02 . From a statistical analysis using a method, we determine that only 20 ( a 4%) of these models can reproduce the present day data. The evolutionary synthesis code was then applied to these 20 models to calculate the radial distribution of the Fe5270 and Mg2 spectral indices. Only 6 (a 1%) of them were able to fit simultaneously both sets of observations. Furthermore, these latter models defined a very small region in the parameter space. This implies that the SFR and AMR obtained for each radial region of the galaxy can be known with a high level of confidence. Our technique is therefore quite powerful in estimating the evolutionary history of a spiral galaxy when both emission and absorption lines data are available.
5 The Barred Galaxies: NGC 4900 and NGC 5430
We have observed two barred galaxies NGC 4900 and NGC 5430 with OASIS, an optical integral-field spectrograph at the Canada-France-Hawaii Telescope can05 . About 1000 spectra in the wavelength ranges from 4700 to 5500Å and from 6270 to 7000Å have been collected with a spatial resolution of 0.80′′ within the central 12 of each galaxy.
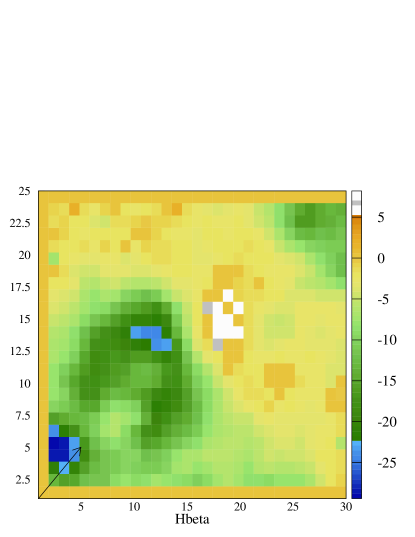
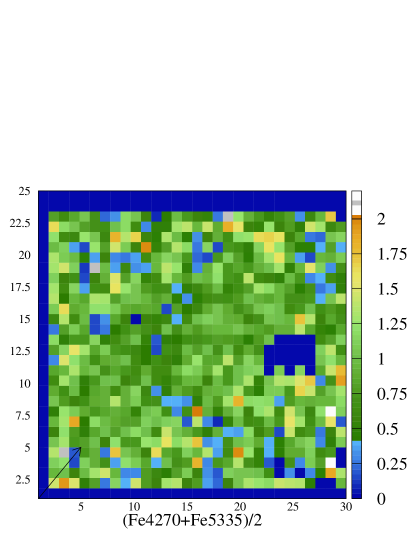
As shown in Figure 1, these data allow us to create detailed maps for the different spectral indices showing various morphologies. When compared with model predictions, the values for the H, and spectral indices allow us to locate the gas and the stellar populations. Thus, in NGC 4900, the youngest stellar population (as described by H, left panel of Fig.1) are located parallel to the galaxy large scale bar (marked by the arrow), while the older stars, as described by Fe5270 and Fe5335 spectral indices, are distributed around the bar.
6 Conclusions
- 1.
-
2.
The use of chemical evolutionary tracks and evolutionary synthesis models to interpret these data results in a powerful tool to determine with precision the evolutionary history of spiral galaxies.
-
3.
The properties of spatially-resolved spiral regions, as the central region of barred galaxies, observed using 3D spectroscopy, may be related to other processes, e.g. to a bar which may produce new star forming bursts. These effects may be quantify using our combined evolutionary models.
References
- (1) Beauchamp, D., & Hardy, E. 1997, AJ, 113, 1666
- (2) Cantin, S., Robert. C., Pellerin, A. & Mollá, M. 2005, New Astronomy Review, in press
- (3) Delgado, R. M. G., Cerviño, M., Martins, L. P., Leitherer, C., & Hauschildt, P. H. 2005, MNRAS, 357, 945
- (4) Falcón-Barroso, J., et al. 2004, MNRAS, 350, 35
- (5) Ferrini, F., Matteucci, F., Pardi, C., & Penco, U. 1992, ApJ, 387, 138
- (6) Henry, R. B. C., & Worthey, G. 1999, PASP, 111, 919
- (7) Mollá, M., & Díaz, A. I. 2005, MNRAS, 358, 521
- (8) Mollá, M., & Hardy, E. 2002, AJ, 123, 3055
- (9) Mollá, M., Hardy, E., & Beauchamp, D. 1999, ApJ, 513, 695
- (10) Ryder, S. D., Fenner, Y., & Gibson, B. K. 2005, MNRAS, 358, 1337