Deep seawater inherent optical properties in the Southern Ionian Sea
Abstract
The NEMO (NEutrino Mediterranean Observatory) Collaboration has been carrying out since 1998 an evaluation programme of deep sea sites suitable for the construction of the future Mediterranean km3 Čerenkov neutrino telescope. We investigated the seawater optical and oceanographic properties of several deep sea marine areas close to the Italian Coast. Inherent optical properties (light absorption and attenuation coefficients) have been measured as a function of depth using an experimental apparatus equipped with standard oceanographic probes and the commercial transmissometer AC9 manufactured by WETLabs. This paper reports on the visible light absorption and attenuation coefficients measured in deep seawater of a marine region located in the Southern Ionian Sea, 60100 km SE of Capo Passero (Sicily). Data show that blue light absorption coefficient is about 0.015 m-1 (corresponding to an absorption length of 67 m) close to the one of optically pure water and it doe not show seasonal variation.
keywords:
underwater Čerenkov neutrino telescope , deep seawater optical properties , light attenuation , light absorptionPACS:
95.55.Vj , 29.40.Ka , 92.10.Pt , 07.88.+y, , , , , , , , , , , , , , , , , , , , , , , , , , , , , , , , , , , , , , , , , , , , , , , , , , , , , , , , , , , , , , , , , , , , , , , , , , , , , , , , , , , , , , , , , , ,
1 Introduction
The construction of km3-scale high energy neutrino telescopes will complement and extend the field of high energy astrophysics allowing the identification of the highest energy cosmic ray sources. The search for astronomical sources of high energy cosmic rays is possible with particles that reach un-deflected the detectors. The observational horizon of high energy cosmic gamma rays and nuclei from ground based detectors is limited to few tens of Mpc by the interaction with cosmic matter and radiation: this should imply the well known GZK cutoff GaisserHalzenStanev1995 ; LearnedMannheim2000 in the energy distribution of ultra high energy extragalactic cosmic rays. On the contrary, the low cross section of weak interaction allows neutrinos to reach the Earth un-deflected from the farthermost regions of the Universe. Active Galactic Nuclei Mannheim1995 , Galactic Supernova Remnants Protheroe1997 , Microquasars Distefano2002 and Gamma Ray Bursters WaxmanBahcall1997 are some of the most promising candidate of high energy muon-neutrino sources. On the basis of high energy neutrino fluxes, calculated using astrophysical models, neutrino detectors with an effective area of 1 km2 will be able to collect, in one year, a statistically significant number of events from point-like astrophysical neutrino sources.
Underwater Čerenkov telescopes detect high energy neutrinos indirectly, tracking the Čerenkov light wavefront radiated, in seawater or in ice, by charged leptons originated in Charged Current neutrino interactions. Seawater, therefore, acts as a neutrino target and as a Čerenkov radiator. An undersea location at a depth of more than 3000 m provides an effective shielding for atmospheric muons background and allows the construction of such detectors, usually referred as Neutrino Telescopes markov1961 . Two smaller scale neutrino detectors, AMANDA and BAIKAL, have already collected and reported candidate neutrino events AMANDAPRL2003 ; BAIKALICRC2003 . AMANDA is located in the South Pole icecap AMWWW at a depth between 1400 and 2400 m. The present size is relatively small, about 25000 m2 for TeV muons, compared to IceCube IQWWW , the future detector now under construction. BAIKAL NT-200, the pioneer underwater detector, is deployed in the Siberian Lake Baikal at about 1000 m depth and has a detection area close to 104 m2 for TeV muons BAWWW .
In the Northern Hemisphere, the Mediterranean Sea offers several areas with depths greater than 3000 m; few are close to scientific and logistic infrastructures and offer optimal conditions to install an underwater km3 neutrino telescope. The future IceCube and the Mediterranean km3 will complement each other providing a global 4 observation of the sky. The long light absorption length of the Antarctic ice is expected to allow good energy resolution, the long light effective scattering length of the Mediterranean seawater should also allow excellent angular resolution. Three collaborations, NESTOR NEWWW , ANTARES ANWWW and NEMO NMWWW , are presently active in the Mediterranean Sea. NESTOR proposes the installation of a Čerenkov detector, with a tower-shaped geometry, moored a few nautical miles off the south-west tip of the Peloponnese (Greece), at about 4000 m depth. ANTARES is building a detector in the vicinity of Toulon (France) at 2450 m depth to possibly detect astrophysical neutrinos and to demonstrate the feasibility of a km3-scale underwater neutrino telescope.
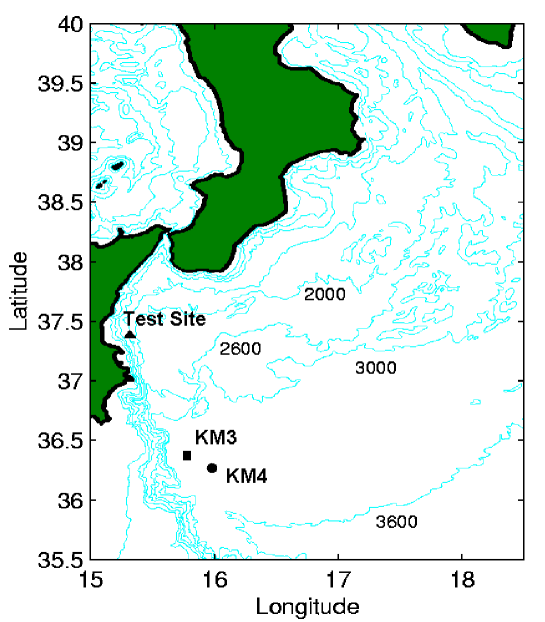
The NEMO Collaboration is active in the design and tests for the Mediterranean km3 neutrino telescope. After a long period of activity, at present the collaboration is ready to install a prototype station (NEMO phase 1) at 2000 m depth, 25 km offshore the town of Catania, in Sicily (Test Site in Figure 1). Since 1998 we have performed more than 25 oceanographic campaigns in the Central Mediterranean Sea in order to characterize and eventually seek an optimal submarine site for the installation of the Mediterranean km3 NEMOHamburg2001 . Three areas close to the Italian Coast have been compared, on the basis of two requirements: depth 3000 m and distance from shore 100 km. Two of these sites are trenches located in the Southern Tyrrhenian Sea close to the Alicudi and Ustica Islands (at depth 3500 m). Measurements of deep seawater optical properties were performed by the NEMO Collaboration in these sites and results were published Capone2001 . The third site is a submarine plateau, whose average depth is 3500 m, located at a distance of 40100 km South East of Capo Passero, Sicily (see Figure 1). In this paper we report on deep seawater optical properties (absorption and attenuation coefficients) measured in the Capo Passero marine region during a period extending from December 1999 to July 2003. The results refer to two sites located 60 km (’N,’E) and 80 km (’N,’E) offshore Capo Passero, hereafter indicated respectively as and . The programme of characterisation of deep seawater in Capo Passero site, carried out by the NEMO Collaboration, includes also long term measurements of optical background (due to bioluminescence and radioactive decays), water temperature and salinity, deep sea currents, sedimentation rate and bio-fouling. The results of this work are presented elsewhere NEMOAppec2003 and will be published soon.
2 Measurements of water optical properties with the AC9
The propagation of light in water is quantified, for a given wavelength , by the water Inherent Optical Properties (IOP): the absorption , scattering and attenuation coefficients. The light propagation in water can be described by the laws:
where is the optical path traversed by the light and () is the source intensity. A complete description of light scattering in water would require the knowledge of another IOP, i.e. the scattering angular distribution, or volume scattering function, (). Integrating this function over the diffusion angle one gets . In this paper we shall report on measurements of and for visible light wavelengths performed with a commercial transmissometer, the AC9 manufactured by WETLabs WETLabs . It is worth to mention that the AC9 performs measurements of the attenuation coefficient in a collimated geometry: the angular acceptance of the channel is . The reported values of are not directly comparable with the results often reported by other authors that concern the effective light attenuation length (or light transmission length). This quantity is defined as , where is the average cosine of the volume scattering function Mobley1994 .
Water IOPs are wavelength dependent: the light transmission is extremely favoured in the range 350550 nm Mobley1994 where the photomultipliers used in neutrino telescopes to detect Čerenkov radiation reach the highest quantum efficiency. In natural seawater, IOPs are also function of water temperature, salinity and dissolved particulate Pope1997 ; Kou1993 . The nature of particulate, either organic or inorganic, its dimension and concentration affect light propagation. All these environmental parameters may vary significantly, for each marine site, as a function of depth and time. It is important, therefore, to perform a long term programme of in situ measurements spanning over a long time interval Duntley1963 . It is known, indeed, that seasonal effects like the increase of surface biological activity (typically during spring) or the precipitation of sediments transported by flooding rivers, enlarge the amount of dissolved and suspended particulate, worsening the water transparency.
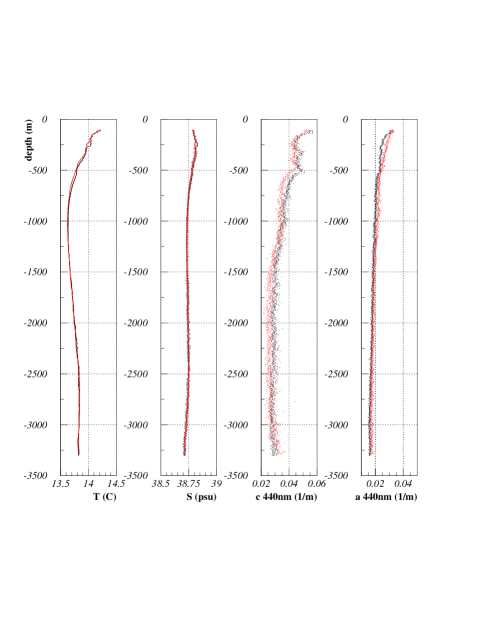
We carried out light attenuation and absorption measurements in deep seawater using an experimental set-up based on the AC9. This device performs attenuation and absorption measurements, independently, using two different light paths and spanning the light spectrum over nine different wavelengths (412, 440, 488, 510, 532, 555, 650, 676, 715 nm) Twardowski1999 ; Zaneveld1994 ; Pegau1997 . The setup designed for deep seawater measurements consists of an AC9, powered by a submersible battery pack, connected to an Idronaut Ocean MK317 CTD (Conductivity, Temperature, Depth) probe. The whole apparatus is mounted inside an AISI-316 stainless-steel cage and it is operated from sea surface down to deep sea, using an electro-mechanical cable mounted on a winch onboard oceanographic research vessels. The same cable is used to transmit the data stream to the ship deck. The DAQ is designed to acquire, about six times per second, water temperature, salinity, () and () ( nm). The apparatus is typically deployed at m/s vertical speed, allowing the acquisition of roughly 10 data samples per metre of depth Capone2001 ; Balkanov2002 . As an example we show in Figure 2 the profiles, as a function of depth, of salinity (in practical salinity units [psu]), temperature ([∘C]), (=440 nm) and (=440 nm) ([m-1]) measured in two deployments at the site during December 1999. Each plotted point represents the average value over 10 m depth. The two measurements (red dots and black dots), carried out in two consecutive days, are nearly superimposed. The Figure indicates that deep waters in do not show relevant variations of oceanographic and optical properties in the depth interval 20003250 m.
2.1 AC9 Calibration and systematic errors
As described in previous papers Capone2001 ; Balkanov2002 , the AC9 measures the difference between the absorption and attenuation coefficients of seawater with respect to the coefficients for pure water. The AC9 manufacturer provides a set of instrument calibration coefficients, that refer to the instrument response to pure water and dry air, used to obtain the absolute values of () and (). In order to reduce systematic uncertainties associated to the measurements, during each naval campaign, the AC9 calibration coefficients have been verified several times (before and after each deployment), recording the instrument readings for light transmission in high purity grade nitrogen atmosphere. With this calibration procedure we estimated that systematic errors amount to [m-1] for the and measurements. We performed in each site at least two deployments of the AC9 setup at short time interval (typically less than 1 day).
3 Comparison of deep sea sites in the Central Mediterranean Sea
The first measurements of IOP in Capo Passero were carried out in December 1999, in the and sites. A comparison among the vertical profiles of salinity, temperature, (440 nm) and (440 nm) as a function of depth, recorded in the two sites is shown in Figure 3. Between 1250 m and 3250 m depth, the water column in the site shows variations of the attenuation coefficients as a function of depth. We attribute this variation of () to extra sources of light scattering, due to particulate present in this site, which is close to the Maltese shelf break. We never observed this effect in , a site farther from the Maltese Escarpment. Figure 3, indeed, shows that optical properties measured in are almost constant as a function of depth (for depth m). Table 1 summarises the values of and , measured at the and sites, averaged over an interval of about 400 m depth, 150 m above the seabed (3400 m in ), which is a suitable range for the installation of neutrino telescopes. As explained above two deployments were carried out in each site. Results are reported in the table. During deployments about 10 data acquisitions per metre of depth are recorded, this implies that large statistics is collected with the instrument in a 400 m depth interval allowing to achieve small statistical errors for each absorption or attenuation coefficient. Table 1 does not report the measured values of the (676 nm) coefficient since its value is used in the off-line analysis as a normalization parameter to estimate corrections due to the not perfect reflectivity mirror in the AC9 absorption channel (see reference Capone2001 ). During the December 1999 sea campaign, the attenuation channel at =555 nm was not properly working therefore the (555 nm) value is not given in Table 1.
| coefficient | KM3 | KM3 | KM4 | KM4 |
|---|---|---|---|---|
| measurement | measurement | measurement | measurement | |
| a412 | ||||
| a440 | ||||
| a488 | ||||
| a510 | ||||
| a532 | ||||
| a555 | ||||
| a650 | ||||
| a715 | ||||
| c412 | ||||
| c440 | ||||
| c488 | ||||
| c510 | ||||
| c532 | ||||
| c650 | ||||
| c676 | ||||
| c715 |
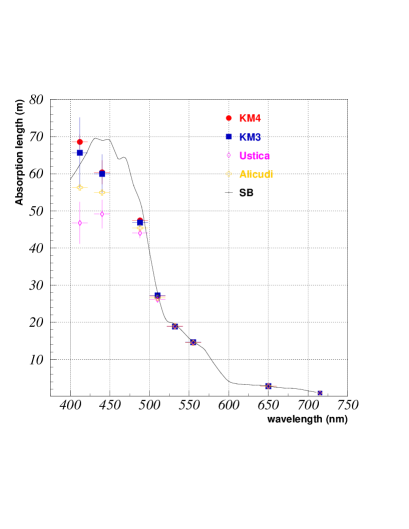
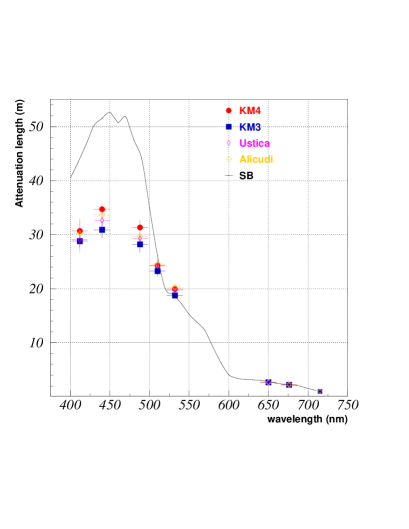
Figure 4 shows the absorption and attenuation lengths (, ), as a function of the wavelengths (measured in the depth range 28503250 m) in and (see reference Capone2001 ) and at the and sites. Data presented for each site are the averages over two deployments; the errors are the RMS of the observed distributions. The same Figure also shows that the values of and measured in the region of Capo Passero are larger than the ones measured in the other sites. In particular the values of are comparable to the ones of optically pure seawater quoted by Smith and Baker SmithBaker1981 . These results lead us to the conclusion that in Capo Passero site the deep seawater optical properties are close to optically pure water ones. Absorption and attenuation coefficients are almost constant for a large interval of depths making this site optimal for the installation of an underwater neutrino telescope. site was not considered a valid choice, in spite of the advantage to be closer to the coast, since the measured water optical properties are not constant along the vertical water column: this effect is supposed to be due to the proximity to the shelf break.
4 Long term study of optical properties at the Capo Passero site
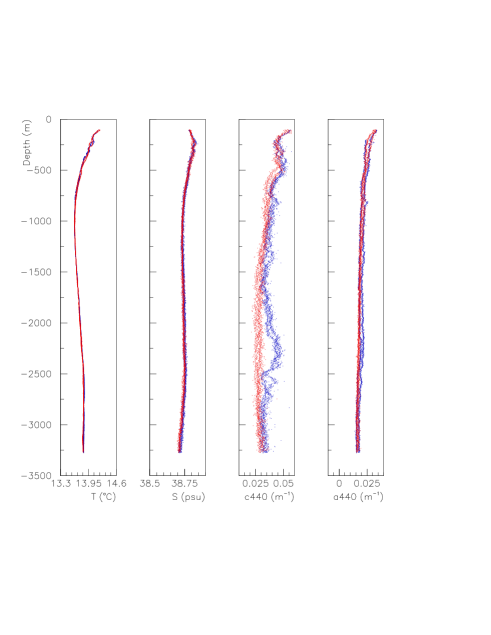
In order to verify the occurrence of seasonal variations of deep seawater IOPs in , we are continuously monitoring this site using the experimental setup described above. The data collected during oceanographic campaigns of December 1999, March 2002, May 2002, August 2002 and July 2003 are reported here. In Figure 5 the profiles of water temperature, salinity, (440 nm) and (440 nm), as a function of depth, are shown. The whole collected data sample consists of: 2 deployments in December 1999 (red dots), 4 deployments in March 2002 (yellow dots), 2 deployments in May 2002 (blue dots), 3 deployments in August 2002 (orange dots), 2 deployments in July 2003 (light blue dots). Seasonal variations are observed only in shallow waters, down to the thermocline depth of about 500 m. At depths greater than 2000 m the (440) and (440) coefficients measured in different seasons are compatible within the instrument experimental error (C, psu, m-1).
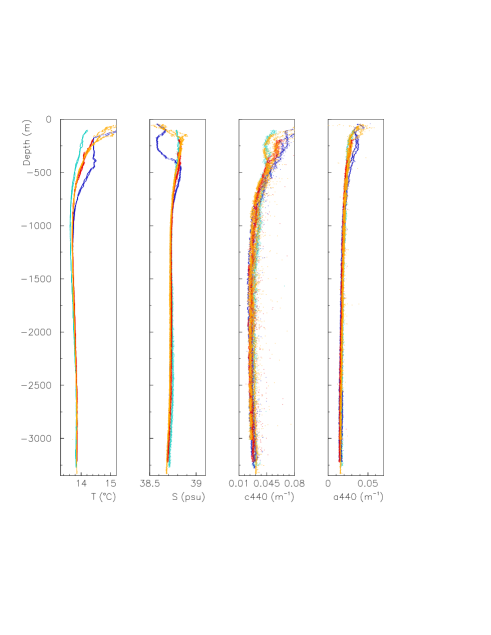
Table 2 gives, for each campaign, the weighted average values of the absorption and attenuation coefficients, as a function of wavelength. Weighted average is calculated from the values of () and (), measured in each deployment at depths between 2850 and 3250 m. Statistical errors are calculated from the RMS of the observed distributions. In Figure 6 the absorption and attenuation lengths are shown. During December 1999 and March 2002 campaigns the channel (555) was not properly working; the same happened to channels (488) during all the campaigns after May 2002 and to (488) in July 2003. The corresponding data are not reported here.
| coefficient | December 1999 | March 2002 | May 2002 | August 2002 | July 2003 |
|---|---|---|---|---|---|
| a412 | |||||
| a440 | |||||
| a488 | |||||
| a510 | |||||
| a532 | |||||
| a555 | |||||
| a650 | |||||
| a715 | |||||
| c412 | |||||
| c440 | |||||
| c488 | |||||
| c510 | |||||
| c532 | |||||
| c555 | |||||
| c650 | |||||
| c676 | |||||
| c715 |
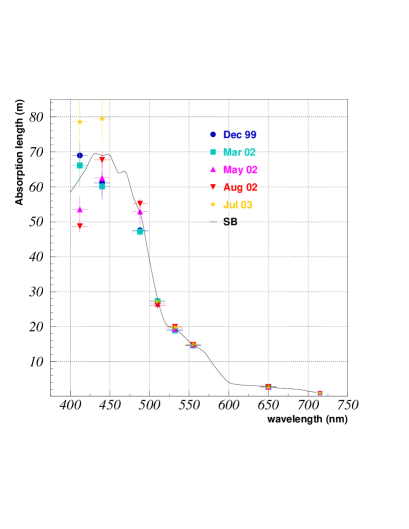
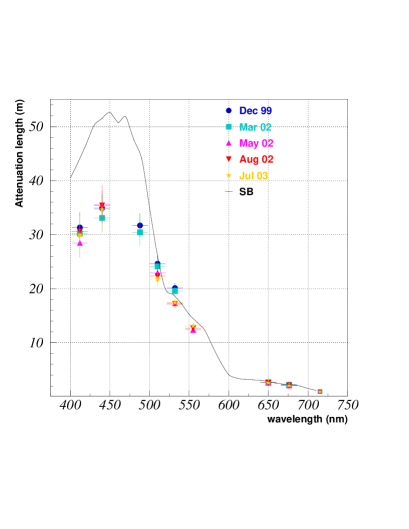
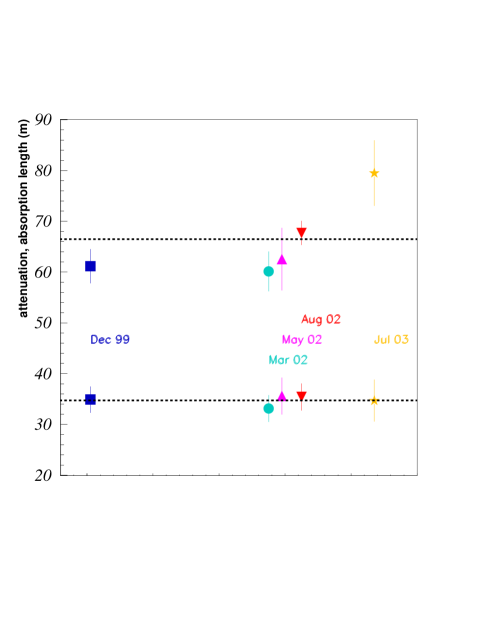
Figure 7 shows the time dependence of the average values of (440 nm) and (440 nm) as a function of time. The plotted error bars are statistical errors. The average absorption length, calculated using the values of Table 2 weighted with their statistical errors, is ( = 440 nm) = 66.5 m close to the value of optically pure water. The weighted average attenuation length is ( = 440 nm)= 34.7 m close to published values of ocean waters measured in conditions of collimated beam and detector geometry Duntley1963 . The value of measured in Capo Passero is larger than the one reported by Khanaev and Kuleshov Khanaev1993 for the NESTOR site. We remind that other results (by DUMAND Bradner1981 , NESTOR Anassontzis1994 and ANTARES Aguilar2004 ) have been obtained measuring the effective light attenuation in conditions of not collimated geometry, i.e. using a diffused light source and a large area detector; these results therefore deal with the effective attenuation coefficients and cannot be directly compared with our results.
5 Conclusions
The NEMO Collaboration measured, as a function of depth, the salinity, temperature and inherent optical properties in several abyssal sites of the central Mediterranean Sea using an experimental apparatus consisting of an AC9 transmissometer and a standard CTD probe. In order to compare the water transparency to Čerenkov light of different sites we have averaged the measured values of and in a range of about 400 m, at the depths which are suitable for the deployment of a km3 neutrino telescope. The data of presented for Capo Passero site are close to the ones reported by Smith and Baker for optically pure seawater SmithBaker1981 . For blue light, the average absorption length is 67 m, the average attenuation length is 35 m. It is worth to mention that all the measurements reported in this paper have been carried out over an area of about 10 km2 around the reference point of . We conclude that optical and oceanographic properties in Capo Passero site are homogeneous in a large region and constant over the investigated timescale. The measured absolute values of IOP and the homogeneity of the water column, for more than one thousand metres above the seabed, make Capo Passero an optimal site for the installation of the future Mediterranean km3 underwater neutrino telescope.
6 Acknowledgements
This work has been been conducted in collaboration with: Department of Physical Oceanography INOGS (Trieste), Istituto Sperimentale Talassografico CNR (Messina) and Istituto di Oceanografia Fisica CNR (La Spezia). We thank Captains E. Gentile, V. Lubrano, A. Patané, the officers and the crew of the R/V Alliance, Thetis and Urania for their outstanding experience shown during the sea campaigns.
References
- (1) T.K. Gaisser, F. Halzen and T. Stanev, Phys. Rep. 258, 173 (1995).
- (2) J. Learned and K. Mannheim, Ann. Rev. Nuc. Part. Sci. 50, 679 (2000).
- (3) K. Mannheim, Astron. and Astrophys 3, 295 (1995).
- (4) R. Protheroe et al, Astropart. Phys. 9, 1 (1998).
- (5) C. Distefano et al, Astrophys. J. 575, 378 (2002).
- (6) E. Waxmann and J. Bahcall, Phys. Rev. Lett. 78, 2292 (1997).
- (7) M.A. Markov and I.M. Zheleznykh, Nucl. Phys. 27, 385 (1961).
- (8) J. Aahrens et al, Phys. Rev. Lett. 90, 251101 (2003).
- (9) V. Ayutdinov et al., Proc. of the 28th International Cosmic Ray Conference, Tsukuba, Japan (2003).
- (10) http://amanda.berkely.edu.
- (11) http://icecube.wisc.edu.
- (12) http://desy.ifh.de/.
- (13) http://www.nestor.org.gr.
- (14) http://antares.in2p3.fr.
- (15) http://nemoweb.lns.infn.it.
- (16) G. Riccobene for the NEMO Collaboration, Proc. of the Workshop on methodical aspects for underwater neutrino telescopes, Hamburg, Germamy (2001).
- (17) A. Capone et al., Nucl. Instr. Meth. A487 423 (2002).
- (18) NEMO Collaboration, Study and characterization of a deep sea site for a underwater neutrino telescope, Report to ApPEC Peer Review Committee, (2003), http://nemoweb.lns.infn.it/sites/sitereport.
- (19) http://www.wetlabs.com.
- (20) C.D. Mobley, Light and Water, Academic Press, San Diego (1994).
- (21) R.M. Pope and E.S. Fry, Applied Optics 36 33 (1997).
- (22) L. Kou, D. Labrie and P. Chylek Applied Optics 32 3531 (1993).
- (23) S.Q. Duntley, J. Opt. Soc. Am. 53 214 (1963).
- (24) M.S. Twardowski et al., J. of Atm. and Ocean. Tech. 16 691 (1999).
- (25) J.R.V. Zaneveld and J.C. Kitchen, SPIE Vol. 2258 Ocean Optics XII, 49 (1994).
- (26) W.S. Pegau, D. Gray and J.R.V. Zaneveld, Applied Optics 36 6035 (1997).
- (27) V. Balkanov et al., Nucl. Instr. Meth. A489 231 (2003) .
- (28) R.C. Smith and K.S. Baker, Applied Optics 20 177 (1981).
- (29) S.A. Kanaev and A.P. Kuleshov, Proceedings of the 3rd NESTOR Workshop, Pylos (1983).
- (30) H. Bradner and G. Blackinton, Applied Optics 23 1009 (1984).
- (31) E.G. Anassontzis et al., Nucl. Inst. Met. A349 242 (1994).
- (32) J.A. Aguilar et al., Astropart. Phys. 23 (2005) 131.