M 33 X–7: ChASeM33 reveals the first eclipsing black hole X-ray binary
Abstract
The first observations conducted as part of the Chandra ACIS survey of M 33 (catalog ) (ChASeM33) sampled the eclipsing X-ray binary M 33 X7 (catalog ) over a large part of the 3.45 d orbital period and have resolved eclipse ingress and egress for the first time. The occurrence of the X-ray eclipse allows us to determine an improved ephemeris of mid-eclipse and binary period as HJD and constrain the eclipse half angle to . There are indications for a shortening of the orbital period. The X-ray spectrum is best described by a disk blackbody spectrum typical for black hole X-ray binaries in the Galaxy. We find a flat power density spectrum and no significant regular pulsations were found in the frequency range of 10-4–0.15 Hz. HST WFPC2 images resolve the optical counterpart, which can be identified as an O6III star with the help of extinction and colour corrections derived from the X-ray absorption. Based on the optical light curve, the mass of the compact object in the system most likely exceeds . This mass, the shape of the X-ray spectrum and the short term X-ray time variability identify M 33 X7 (catalog ) as the first eclipsing black hole high mass X-ray binary.
1 Introduction
M 33 X7 (catalog ) (hereafter X7) was detected as a variable source by the Einstein observatory with a maximum luminosity in the 0.15–4.5 keV band (assuming an absorption column of cm-2) that exceeds erg s-1 (Long et al., 1981; Markert & Rallis, 1983). The source stayed active in all following observations. Its variability was explained by an eclipsing X-ray binary (XRB) with an orbital period of 1.7 d and an eclipse duration of 0.4 d (Peres et al., 1989; Schulman et al., 1993, 1994). Based on ROSAT and ASCA data (Larson & Schulman, 1997; Dubus et al., 1999, hereafter DCL99), the orbital period was found to be twice as long. DCL99 described the shape of the eclipse by a slow ingress (), an eclipse duration of and a fast eclipse egress () with an ephemeris for the mid-eclipse time of HJD 244 8631.50.1 + N(3.45350.0005). DCL99 also report 3 evidence for a 0.31 s pulse period. They come to that conclusion by splitting PSPC and HRI data of 500 s intervals of continuous data where X7 was positively detected and calculating the summed Rayleigh power spectrum. The linearly binned power spectrum showed an significant excess (at 99.9 per cent confidence) at the proposed period when compared to simulated data assuming a Poisson distribution with the X7 mean flux. The signal is broader than what would be expected from a simple sinusoidal pulse. It was not possible to check if the variability is coherent. DCL99 conclude “Although pulsed emission seems a reasonable assumption, the power excess could arise from variability of a different nature (e.g. broad-band variability increasing the chance of spurious detection).” The orbital period, pulse period and observed X-ray luminosity are remarkably similar to those of the Small Magellanic Cloud neutron star XRB SMC X1 (catalog ) (Liu et al., 2000). X7 was the first and only identified eclipsing accreting binary system with an X-ray source in an external galaxy other than the Magellanic Clouds before the detection of similar behavior based on XMM-Newton and Chandra data of the NGC 253 X-ray source RX J004717.4-251811 (Pietsch et al., 2003).
Pietsch et al. (2004, hereafter PMM2004) analyzed several observations of the XMM-Newton M 33 (catalog ) survey and an archival Chandra observation where X7 was in the field of view. The observations cover a large part of the 3.45 d orbital period, however not eclipse in- and egress. PMM2004 detected emission of X7 during eclipse and a soft X-ray spectrum of the source out-of eclipse that can best be described by bremsstrahlung or disk blackbody models. No significant regular pulsations of the source in the range 0.25–1000 s were found. The average source luminosity out of eclipse was 5 erg s-1 (0.5–4.5 keV, corrected for Galactic foreground absorption). In a special analysis of DIRECT111For information on the DIRECT project see http://cfa-www.harvard.edu/~kstanek/DIRECT/. observations PMM2004 identified as the optical counterpart a B0I to O7I star of 18.89 mag in V which shows the ellipsoidal light curve of a high mass X-ray binary (HMXB) with the X7 binary period. Based on the location of the X-ray eclipse and the optical minima, PMM2004 derived an improved binary ephemeris and argued that the compact object in the system is a black hole. Those authors reached this conclusion based on the mass of the compact object derived from orbital parameters and the optical companion mass, the lack of pulsations, and the X-ray spectrum. X7 would be the first detected eclipsing high mass black hole XRB.
The Chandra ACIS-I survey of M 33 (catalog ) (ChASeM33) is a very large program which will accumulate in seven deep pointings, each 200 ks in length, a total exposure of 1.4 Ms. During several of these pointings X7 is in the field of view. We report here on ChASeM33 observations of X7 spread over just 20 binary orbits, which resolved for the first time the eclipse ingress and egress and allowed us to constrain the light curve of X7 for binary phases around eclipse. Preliminary results of the first observations were announced by Sasaki et al. (2005). In addition we identify the source on archival HST WFPC2 images. Throughout the paper, we assume a distance to M 33 (catalog ) of 795 kpc (van den Bergh, 1991).
2 Chandra observations and results
X7 was sampled by the ACIS-S3 chip in one Chandra observation and by the I0, I1 and I2 chips during 11 additional observations. Table 1 summarizes these observations giving observation identification (ObsID) in column 1, observation start date (2), elapsed time (3), the ACIS chip covering X7 (4), the offset of X7 from the pointing direction (5), and the X7 binary phase during the observation (6) using ephemeris that will be discussed in Sect. 2.1 and 4.1. The source brightness varied from 3 ct s-1 to 0.2 ct s-1 normalized to ACIS-I on-axis.
Of the pointings considered here, the Field 5 position of X7 is located close enough to the optical axis to result in significant pile-up, particularly during the high phase. To correct the light curve for the effects of pile-up, we used the best-fit model for unpiled data from the other pointings (see Sect. 2.2), and applied a pileup(phabs(diskbb)) model within XSPEC. We estimated the pile-up parameters by fitting simultaneously the high state data for ObsID 6382 (insignificant pile-up) and ObsIDs 7170 and 7171 (significant pile-up). The phabs and diskbb models were set to their best fit values from the unpiled spectra; the diskbb normalizations were tied for all three datasets. All of the pile-up model parameters except the grade morphing parameter were frozen. For a description of the pile-up model see Davis (2001). The pile-up parameters were set to their default values, but the fr_time parameter was frozen at 3.2 for ObsIDs 7070, 7071, and at 0 for 6382; this has the effect of turning off the pile-up model component for ObsID 6382. The resulting reduced of the fit was 0.97 and the corresponding value for was 0.692 (90% confidence limits). Using the fitted value for , a correction curve was generated by evaluating the ratio of the XSPEC “Model predicted rate” without pile-up (fr_time=0) to the corresponding rate with pile-up (fr_time=3.2) as a function of the model predicted rate (with pile-up). This ratio was used to correct the observed count rates of ObsIDs 6384, 7070, and 7071 for the effects of pile-up.
For the spectral analysis we used standard Level 2 event files cleaned for columns with higher background rates than adjacent columns. In the observations of Fields 4 and 5, counts from X7 are rejected when the source is moving across rejected columns (due to the satellite dithering). This effect creates spurious periods in period analysis and can reduce the counts in 1000 s integration intervals by varying amounts (up to more than 30%). Therefore, we created new Level 2 event files for broad band time variability analysis that did not reject these columns. We correct for the detection efficiency at different off-axis angles using factors derived from response files for the different CCDs and off-axis positions assuming the disk-blackbody spectrum derived in Sect. 2.2. We normalized the count rates to a CCD 3 on-axis rate.
The data analysis was performed using tools in the ESO-MIDAS v05SEPpl1.0, EXSAS v03OCT_EXP, CIAO v3.2 and LHEASOFT v5.3 software packages as well as the imaging application DS9 v3.0b6.
2.1 Time variability
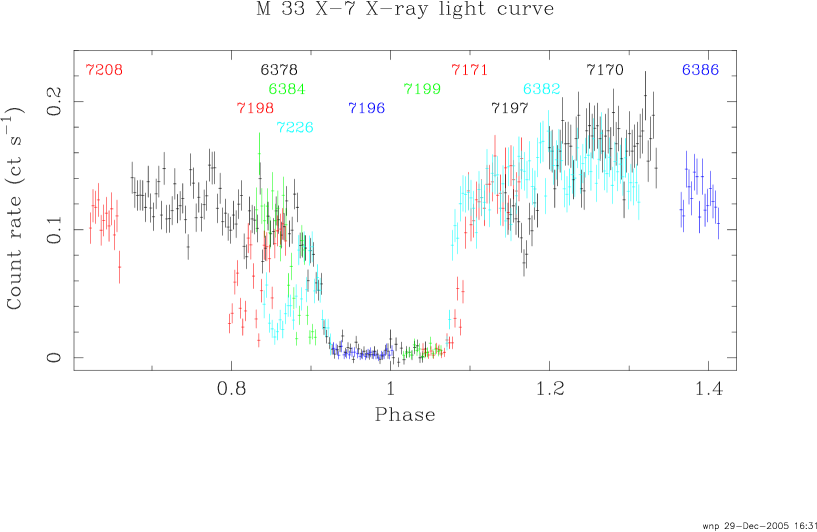
During ObsID 6378 and 7171 we observed transitions by X7 into and out of eclipse, respectively. We sampled both background and solar system barycenter corrected light curves of X7 with a time resolution of 1000 s. To increase the signal to noise specifically in the far off-axis ObsID 6378, we restricted the analysis to the 0.5–5 keV band which covers most of the source flux. Further sub-dividing this energy band into a hard and soft band did not show any significant hardness ratio changes of the in- and egress behavior as could be expected based on EXOSAT observations of LMC X4 and Her X1 (see Figs. 78 and 79 in Dennerl, 1991). To determine eclipse start and end times, we approximated the light curves assuming constant count rates within and out-of eclipse and a linear transition in between using a minimization technique. We searched for errors of the eclipse start and end time, respectively, assuming those to be the only interesting parameter for the fit.
In ObsID 6378 the transition into eclipse lasted 12.75 ks and ended at HJD 245 3635.41100.0037. The transition out of eclipse in ObsID 7171 started at HJD 245 3642.82720.0052 and lasted for 10.52 ks. From these ingress and egress times separated by two orbital periods, we directly derive the mid eclipse ephemeris of the eclipse in between to HJD . Assuming this epoch as phase zero and a binary period of 3.453014 d (see Sect. 4.1), we calculated light curves of all X7 observations (Fig. 1). We also determine an eclipse duration of less than 0.1470.006 in phase corresponding to an eclipse half angle of .
ObsIDs 7196 and 7199 fully fall into eclipse. ObsID 6384 at phase 0.83 to 0.90 indicates a much longer transition into eclipse than ObsID 6378. ObsID 7198 shows dipping behavior well before eclipse with a return to the out-of eclipse intensity level at the end. ObsID 6382 shows a second egress from eclipse which is significantly faster than the one 16 orbits earlier (ObsID 7171). However, the observation starts during egress and the phase range within eclipse is not covered. ObsID 7226 covers eclipse ingress at the end of the same orbit and again shows strong dipping well before the ingress. Eclipse egress and ingress times are consistent with the times derived above. Generally speaking the variability of X7 before eclipse (phase 0.7 to 0.9) seems to be much more pronounced in individual observations than after eclipse (phase 1.1 to 1.4). Average count rates in eclipse and out of eclipse are 0.003 ct s-1 and 0.15 ct s-1, respectively. This out-of-eclipse count rate varies in different binary orbits by factors of 1.3 and there are residual short term fluctuations that can be described by dips with a similar amplitude and a duration of several 1000 s also outside the pre-eclipse phase.
To search for pulsations we extracted light curves in the 0.5–5 keV band from the longest observations after eclipse, ObsIDs 6382 and 7170. We created power density spectra in the frequency range of 10-4–0.15 Hz and found no significant periodic signal with a 3 upper limit of 5.3% for sinusoidal variations. A power density spectrum derived from ObsID 6382 by adding the power spectra from 23 intervals of 3319 s length (1024 time bins with the instrument resolution of 3.241 s) is shown in Fig. 2. The power spectrum is flat at a value of 2.
2.2 Energy spectra
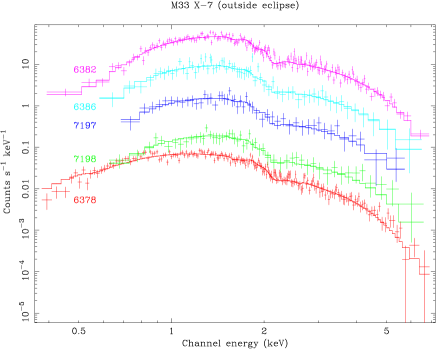
We analyzed energy spectra of X7 for all observations. For ObsIDs 6378 and 7171, times out of eclipse, during ingress and egress, and in eclipse were handled separately. Absorbed power-law, bremsstrahlung and disk-blackbody models (which were found to best represent the XMM-Newton and Chandra spectra analyzed by PMM2004) were first fit to the individual spectra. The power-law fit to the spectrum obtained from ObsID 6382 (which has the highest statistical quality) yields an unacceptable fit with a reduced of 1.92 while bremsstrahlung and disk-blackbody models result in of 1.45 and 1.32, respectively. The derived parameters are consistent within the errors for all spectra including the spectra accumulated during eclipse ingress and egress and during ObsID 7198 when the source shows high variability. Therefore, we performed a simultaneous fit with the disk-blackbody model to the spectra of eight out-of-eclipse observations excluding times when the X-ray source was in eclipse and forcing the absorbing column density to be the same for all observations (this reduces the number of free fit parameters compared to the individual fits). The resulting inner disk temperature was systematically higher (at 1.3 keV) for ObsIDs 6384, 7170 and 7171: these are the observations which include X7 nearly on-axis. The most likely reason for the “harder” spectra is pile-up and we therefore excluded these three spectra from further analysis. The fit to the remaining five spectra from ObsIDs 6378, 6382, 6386, 7197 and 7198 shows no significant differences in the inner disk temperature and therefore this parameter was also forced to be the same in the simultaneous fit. We refit the power-law and bremsstrahlung models for comparison. The best fit is obtained with the disk-blackbody model yielding a of 1.10. The for the best fitting bremsstrahlung and power-law models are 1.16 and 1.44, respectively. The derived spectral parameters are similar to the ones reported by PMM2004: disk-blackbody with inner disk temperature kT = 0.990.03 keV and NH = (0.950.10) cm-2; bremsstrahlung with temperature kT = 2.740.13 keV and NH = (2.050.12) cm-2; power-law with photon index = 2.380.05 and NH = (3.320.17) cm-2. The best fit disk-blackbody model is shown in Fig. 3.
The normalization of the disk-blackbody model is given by K = (cos ) with the inner disk radius rin in km, the source distance d in units of 10 kpc and the disk inclination . The spectra show variations by a factor of 2 in normalization with K=0.054 for ObsID 6378 and relative factors 0.58, 0.94, 1.13 and 1.37 for ObsIDs 7198, 7197, 6386 and 6382, respectively.
The NH values for the models discussed above clearly indicate absorption within M 33 (catalog ) or intrinsic to the source in addition to the Galactic value (5.86 and 6.37 cm-2 in the direction of X7 according to Dickey & Lockman, 1990; Stark et al., 1992, respectively). Absorbed and unabsorbed source fluxes in the 0.3–10 keV band are in the range (5.4–12.6) erg cm-2 s-1 and (6.2–14.7) erg cm-2 s-1, respectively, based on the best fitting disk-blackbody model. These fluxes correspond to source luminosities of (4.1–9.6) erg s-1 and (4.7–11.2) erg s-1, respectively.
The NH value of the best fitting disk-blackbody model indicates that X7 lies on the near side of M 33 (catalog ) as the absorbing column within M 33 (catalog ) can be determined to 2.2 cm-2 from a arcsec half power beam width Hi map (Newton, 1980). From the NH value we can compute the expected optical extinction mag and using the standard relations (Predehl & Schmitt, 1995). These numbers are in the range given by PMM2004 who assumed that we see X7 through less than half the absorbing column within M 33 (catalog ).
2.3 Improved position
X7 was located in four of the five ChASeM33 fields observed so far. The source was closest to on-axis (1.58′ off-axis) in the Field 5 observations (see Table 1). This results in the most compact PSF and thus the most reliable position determination. To refine the absolute astrometry of the Field 5 data, we searched the USNO-B1.0 and 2MASS catalogs for close positional matches with X-ray sources. Similarly, to improve the statistics for X-ray centroiding, we worked with a merged dataset for ObsIDs 6384, 7170, and 7171. We identified 9 candidate optical/2MASS objects. Six were rejected because of far off-axis positions or small number of counts. The remaining candidates were off-axis, for a 2MASS object (250 counts, 0.5–5 keV) which was 7.8′ off-axis. We enhanced the number of candidates for registration by adding two isolated centrally brightened supernova remnants (SNRs) with good radio positions (sources 57 and 64 from the list of Gordon et al., 1999) assuming that the finite size of SNRs – and potential differences in the X-ray versus radio distribution – do not bias the position determination. We determined the X-ray centroids based on an iterative sigma-clipping algorithm applied to the 0.5–5 keV X-ray data. Based on an initial position estimate and clipping radius, the standard deviation of the radial distribution is evaluated, and points greater than a given number of standard deviations are rejected. The iteration of centroiding and rejecting events continues until the centroid converges to within a specified tolerance or for a fixed number of iterations (10). The difference in sky coordinates between the catalog position and the X-ray centroid position was evaluated for each source. The mean offset was . The centroid of the X7 source was evaluated in the same way, and the resulting offset was applied to correct the sky position. Finally, the corresponding celestial coordinates were evaluated using the CIAO tool dmcoords; the aspect solution files (asol1 files) were used in order to correct the positions using the aspect offsets. The resulting X7 position is RA with a combined error of 0.5″. The position is within 2 of that given by PMM2004 based on a registration using just one SNR.
3 Optical observations and results
M 33 X7 (catalog ) is located along the line of sight to the dense OB association HS 13 (Humphreys & Sandage, 1980): it was identified by PMM2004 with a specific star within this association, as a result of detection of regular (ellipsoidal) variations in B and V at the X-ray period. The OB association has been imaged with HST using WFPC2 in three filters: F336W, F439W, and F555W. The observing details are listed in Table 2. In an attempt to learn more about the optical counterpart to X7, we retrieved relevant datasets from the MAST archive. Data retrieved from the archive are automatically reprocessed with the latest calibration files. After inspecting the individual exposures, we combined the two exposures taken with the F336W filter and the two taken in F439W (using the STSDAS task gcombine) to eliminate the effects of cosmic rays on the images.
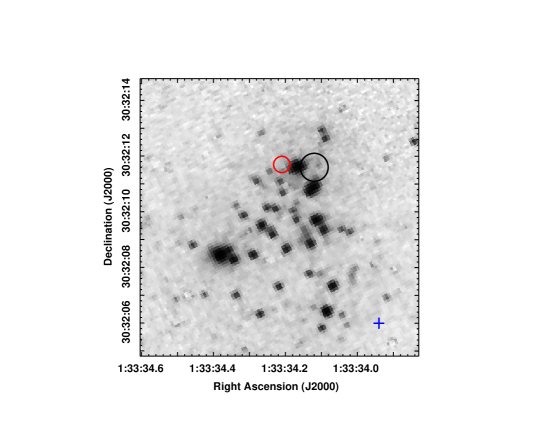
The position of the X-ray source as determined with Chandra is shown in Fig. 5. Since the error in the astrometric solution of images in the HST pipeline is typically 1.5″ –2″, we attempted to reduce the positional uncertainty by registering the WFPC2 images to the USNO-B1.0 or 2MASS frames. Given the small field of view and greatly superior spatial resolution of the WFPC2 images, many sources identified in the USNO-B1.0 or 2MASS catalogues are resolved into multiple objects, making a unique match between stars in the image and sources in the catalogue difficult. Therefore, we performed our astrometric corrections in two steps, taking advantage of the much larger field of view of the KPNO Mosaic B image of M 33 (catalog ) (Massey et al., 2002). First, we identified a sample of 25 isolated, bright USNO-B1.0 stars within 45 of X7 to compute the shift required to bring the Mosaic B image into the USNO-B1.0 frame. The RMS positional error of these stars in the corrected Mosaic image was unacceptably large (085). We then tried the same procedure using 21 bright 2MASS stars located in isolated areas in the KPNO Mosaic B image. The RMS positional error of these stars in the corrected Mosaic image was 016. We then used 10 bright, isolated stars in common between the Mosaic B and F439W images (restraining the selection to the region covered by the WFPC2 CCD in which the X7 counterpart was located) to compute the shift required. The RMS positional error in the shifted HST image was 013. Combining the 01 absolute uncertainty of the 2MASS position with the uncertainties listed above, the absolute astrometric uncertainty of the final registered F439W image is 023.
We applied the calculated shifts above to the HST image. Fig. 5 shows a 10″ 10″ field from the F439W image centered on M 33 X7 (catalog ). The black solid circle shows our best estimated position for the X-ray source from the Chandra image. The error circle of X7 is 05 in radius (see above). The HST positional accuracy is indicated by a cross. We also show the error quoted by PMM2004 in red. The error circles overlap with a bright star, coincident with that proposed by PMM2004 (based also on time variation arguments) as the donor star for the compact object.
We also carried out aperture photometry of the stars in the HST field (using the IRAF procedures daofind and phot). We find that the optical counterpart to X7 with the WFPC2 resolution is not a blend of stars. PSF fits to the source in the F336W, F439W, and F555W images give FWHM compatible with the other point-like sources in the images. The star about 09 to the South on the other hand is just resolved in at least two equally bright sources which are separated by 02. We can rule out the presence of another star of similar brightness at the position of the optical counterpart of X7 to this distance, which corresponds to a projected separation at the distance of M 33 (catalog ) of 0.8 pc.
The optical counterpart has apparent magnitudes of 17.6, 18.2, and 18.9 for the F336W, F439W, and F555W filters, respectively, in the STMAG system. The colors derived from these filters for the counterpart to X7 are typical of the other bright stars () in HS 13 as observed with WFPC2. The F336W, F439W, and F555W filters are centered approximately on the corresponding U, B and V filters. Adopting a color transformation of 0.5 mag for U, 0.66 mag for B, and 0.03 mag for V (Mobasher, 2002), we find of 18.1 mag, of 18.8 mag, and of 18.9 mag (i.e. U–B of -0.7 mag, B–V of -0.1 mag) for the optical counterpart to X7.
4 Discussion
The well sampled orbital light curve of X7 indicates stronger variability before eclipse compared to after eclipse (Fig. 1). Variability at this phase is often observed in HMXBs and is explained by the viewing geometry through the innermost regions of the wind of the companion and dense material following the compact object in its orbit (e.g. Haberl & Day, 1992). Dense structures are created by the gravitational and radiative interactions of the compact object with the stellar wind (Blondin et al., 1990, 1991). This behavior is also reflected in the on-average longer eclipse ingress time and longer eclipse duration derived by DCL99.
Similarly to PMM2004 we find residual emission from the source during eclipse. Residual emission during eclipse was measured from most eclipsing XRBs and can be explained by re-processing of primary photons from the compact X-ray source in an extended accretion disk corona (which is not fully occulted) or by scattering in the companion atmosphere/stellar wind. Residual emission of up to 10% of the uneclipsed flux was reported (Haberl, 1991; Lewis et al., 1992; Ebisawa et al., 1996) depending on system geometry and wind density. The X7 residual emission of 4% is well within these limits.
4.1 Improved ephemeris
DCL99 modeled the folded light curve from X7 as a constant flux plus linear ingress and egress plus an eclipse interval with zero flux. It is obvious from their data (see their Fig. 1) that the eclipse egress is better determined than the eclipse center and duration. These strongly depend on the shape of the pre-eclipse dips contained in the light curve as can be seen from the resolved pre-eclipse behavior in the Chandra data (Fig. 1). DCL99 did not determine the eclipse parameters from individual eclipses but only from the average light curve due to limited statistics. The time of eclipse egress is the best determined parameter. Unfortunately, in the paper they do not give this parameter separately but only the center of eclipse and length of eclipse. In the following we use eclipse egress times to determine an improved orbital period and a possible period derivative .
Due to limited phase coverage, the XMM-Newton observations do not resolve eclipse ingress or egress. The time of eclipse egress can only be constrained to 0.02 in phase. Based on these data PMM2004 restricted the time of eclipse egress to HJD (note typographical error in egress time in PMM2004, but the calculation used the number given here) and determined a time of mid-eclipse assuming the eclipse shape parameters of DCL99. With this mid-eclipse epoch and the one given by DCL99, PMM2004 determined an improved orbital period.
The maximum eclipse duration of 0.1470.006 (Sect. 2.1) determined from individual observations is – as expected – significantly shorter than the one given by DCL99 (0.200.03) from average orbit fitting. From the DCL99 ephemeris it is not possible to derive a well defined eclipse egress time. The same is true for the Einstein results (Peres et al., 1989, hereafter PRC89). We therefore decided to re-analyze relevant ROSAT and Einstein data.
ROSAT PSPC observations of M 33 (catalog ) were short compared to the HRI observations and did not cover the X7 eclipse egress. We therefore restricted our re-analysis to ROSAT HRI data. After screening for high background, we combined data with continuous observation intervals which lead to variable integration times of typically 1800 s (minimum 41 s, maximum 3791 s) depending on the duration of the scheduled observation and background. DCL99 in contrast grouped the data in 3000 s averages. Only once is the eclipse egress closely monitored. In the ROSAT interval corresponding to ObsID 600488h, X-7 was still in eclipse while in the following interval (corresponding to ObsID 600489h), less than 0.04d later, X-7 already featured a count rate that indicated the source was out of eclipse. This allowed us to restrict the time of eclipse egress to HJD . In another case during ObsID 600020h-1, observations in eclipse and out of eclipse are separated by 0.26 d, which does not allow us to further constrain eclipse egress times.
PRC89 reported Einstein IPC and HRI observations of X7. For the HRI observations PRC89 combined several continuous observation intervals to get significant data. For the IPC observations PRC89 simply integrated over individual continuous observations. Due to the better statistics in the IPC observations we considered only IPC eclipse egress coverages (i.e. ObsID I2090, see also PRC89, Fig. 1). In images of the observation X7 is only visible in the energy band 0.6–2.8 keV (PI 4–9). We therefore restricted the analysis to this energy band. We selected extraction position and area by comparison with the close-by bright central source X8. We specifically investigated the “first rising episode at day 1.5” as identified by PRC89. In contrast to the report by PRC89, X7 count rates during this period do not show increasing flux but the source intensity is compatible with zero during all three intervals. In the next set of observation intervals at around day 2 the source is clearly out of eclipse. This indicates an eclipse egress between HJD 244 4087.840 and HJD 244 4088.255.
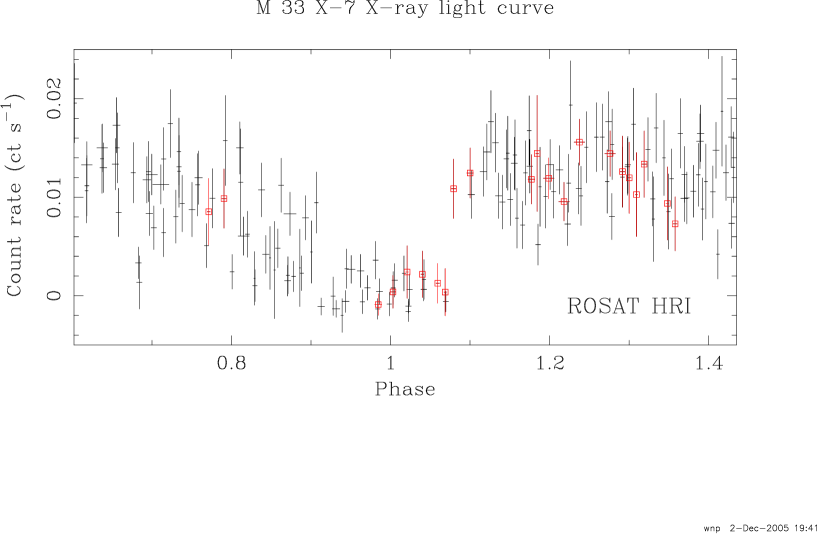
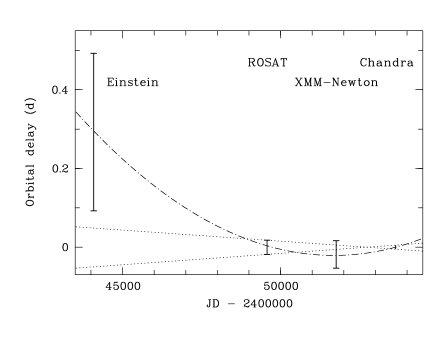
Combining the ROSAT eclipse egress boundaries with the Chandra ephemeris suggests an orbital period of 3.4530140.000020 d. The lower panel of Fig. 1 shows the ROSAT HRI light curve folded with the above period and assuming the Chandra mid-eclipse epoch, for the same phase range as the Chandra data above. As can be seen in Fig. 4, these ephemerides also are consistent with the boundaries determined for the XMM-Newton eclipse egress. However, they seem to miss the boundaries determined above for the Einstein IPC observation. If we assume a constant rate of change of the orbital period over this time, we can model all eclipse egresses. The parabola shown in Fig. 4 assumes a period of 3.45294 d at the Chandra epoch and orbital period decay rate of yr-1. It nicely models the average eclipse egress times of XMM-Newton, ROSAT and Einstein. However, also a small yr-1 and a period of 3.45302 d or a much higher yr-1 and a period of 3.45285 d would still be consistent with all the eclipse egress boundaries.
The derived orbital decay for X7 is well within the range of values determined for other HMXBs like Cen X3 ( yr-1, Nagase et al., 1992), SMC X1 ( yr-1, Levine et al., 1993) or LMC X4 ( yr-1, see e.g. Safi Harb et al., 1996; Levine et al., 2000). Such rapidly decreasing periods in HMXBs are most likely caused by tidal interaction between the compact object and its massive companion. As the orbit decays the Roche lobe will descend into the companion’s atmosphere and mass transfer will increase to super-Eddington rates over a relatively short time scale. In the end, the compact object is expected to spiral into the envelope of the companion and in this way terminate the high-mass XRB phase of the evolution (see e.g. Levine et al., 1993).
4.2 The optical companion
The HST WFPC2 images clearly resolve the dense OB association HS 13 (Humphreys & Sandage, 1980). The optical counterpart is located to the North and is one of a pair of stars with similar luminosities: these stars are separated by 0.”9. While the suggested counterpart is presumed to be a single source, the source to the South is a blend of at least 2 stars (elongation from SSE to NNW). The HST observations were carried out within one hour on October 25, 1995 corresponding to binary phase 0.76 using the ephemeris given in Sect. 4.1. Phase 0.76 corresponds to the second maximum of the ellipsoidal light curve. Assuming the parameters of the optical light curve by PMM2004 (sinusoidal fit with 0.033 mag amplitude) the correction to X-ray eclipse is +0.066 mag resulting in corrected magnitudes of 18.9 mag, and of 19.0 mag for the optical counterpart to X7. Magnitudes and colours are very close (within 0.1 mag) to values deduced by PMM2004. X7 is also included in the UBVRI photometry of stars in M 31 (catalog ) and M 33 (catalog ) from the survey of Local Group galaxies, recently published by Massey et al. (2006). They give a position (registered with the USNO B1.0 frame) of RA, about 03 ESE from the position in our registered HST image position (see Fig. 5). Their X7 magnitude and colours (mag, mag, mag) coincide with those determined by us within 0.2 mag. Part of the discrepancy may be due to the sampling at different binary phases.
The type and luminosity class of the star can be deduced from the absolute optical magnitude and colour during eclipse when we see the optical surface that is mostly undisturbed by gravitational effects, an expected accretion disk and heating by the X-ray source. To derive the absolute magnitude the measured brightness has to be corrected for the distance (-25.50 mag for the assumed distance of 795 kpc) and for interstellar extinction, the colour has to be corrected for reddening. These corrections have been estimated from the absorption of the X-ray spectrum in Sect. 2.2. Based on the HST values the companion star should have an absolute of mag and of mag. This corresponds to a giant star of spectral type O6III which has a temperature of 39 500 K, a radius of 17 and a mass well above 20 (see Appendix E in Carroll & Ostlie, 1996).
4.3 M 33 X7, an eclipsing black hole HMXB
With the new eclipse duration and the better determination of the companion type on the basis of the extinction combined with the colour excess corrections derived from the absorbing column of the X-ray spectrum of X7, we can significantly improve the mass estimate of the compact object compared to PMM2004. To do so we correct the B and V light curves given in PMM2004 for extinction and colour excess. We then model these light curves using the “PHysics Of Eclipsing BinariEs” program PHOEBE (Prša & Zwitter, 2005) built on top of the widely used WD program (Wilson & Devinney, 1971; Wilson, 1979, 1990). By adjusting the semi-major axis of the binary system we kept the radius of the secondary star at 17. We also fixed the temperature of the secondary to 39 500 K. We then fitted the luminosity of the secondary and the mass ratio of the companions using the light curves in the B and V band simultaneously, assuming different inclination angles. We derive acceptable fits for inclination angles from 75° to 90°. Angles of 74° and smaller can be excluded as the companion star would overfill its Roche lobe. The derived parameters are given in Table 3. The available optical data are not sufficient to discriminate between the allowed inclination angles. However, we expect that an inclination above 80° is more likely than an inclination in the range 75° – 80° where the companion nearly fills its Roche lobe and unstable mass transfer would be expected based on the X-ray observations. In the case of unstable mass transfer, the X-ray emission from X7 would most likely be much more variable on longer time scales than observed in all observations since those with the Einstein observatory. This implies a mass of the compact object in the system of greater than 9 and clearly indicates a black hole as the compact object in the system.
As already discussed in PMM2004, further arguments for the black hole nature of the compact object in X7 come from the lack of X-ray pulsations, the short term variability and the X-ray spectra. We discuss each of these properties in turn:
(I) Pulsations are clear indicators of a neutron star as the compact object in a HMXB. In the power density spectrum analysis we did not detect significant periodic signals allowing a black hole as the compact object. However, this does not rule out the possibility that the compact object is a neutron star. Our unsuccessful Chandra periodicity search was limited towards short periods by the ACIS-I sampling time of 3.2 s. Also, with the significantly shorter sampling time of XMM-Newton EPIC pn of 0.073 s, PMM2004 did not find significant pulsations.
(II) Low accretion rate sources should show a power density spectrum (PDS) with a broken power law (see Barnard et al., 2005, and references therein). Above a luminosity of typically 0.1 of the Eddington luminosity, the PDS should be flat. The short term fluctuations seen in the power spectral analysis of X7 are very small as one would expect for such a high accretion rate source. The unabsorbed luminosity of X7 in the 0.3–10 keV band of 1.1 erg s-1 in maximum is consistent with a stellar mass black hole, but it does not constrain the mass.
(III) HMXBs with a neutron star as the compact object normally show power law spectra (photon index 0.8–1.5) with a high-energy cutoff around 10–20 keV (see e.g. White et al., 1983; Makishima et al., 2000). Disk-blackbody spectra, on the other hand, suggest emission that is dominated by the inner accretion disk of a low mass XRB system, or – in case of a HMXB – the presence of an accretion disk surrounding a black hole emitting in the high state (e.g. Makishima et al., 1986). As mentioned before, the variability of X7 outside eclipse most likely is caused by partial covering of the X-ray emission region due to material in the accretion stream or in the outer accretion disk. If we assume that during the brightest phase, the X7 disk-blackbody normalization corresponds to the innermost stable circular orbit with radius around a black hole, i.e. cm (with the Schwarzschild radius), we obtain .
All of these results of the new Chandra observations suggest that M 33 X7 (catalog ) is the first known eclipsing HMXB with a black hole as the compact object.
Pooley & Rappaport (2005) advanced the idea of searching for eclipses in ultra-luminous X-ray sources (ULXs) to determine black hole masses and – most importantly – to separate intermediate mass from stellar mass black holes as the compact object in this exceptional class of X-ray sources. They proposed to compare the number of eclipses in the different kind of systems and predicted that more eclipses by far should be detected in stellar mass systems than in intermediate mass black hole systems.The orbital periods and other system parameters would provide considerable insight as to the nature of the binary. While M33 X-7 is about a factor of five less luminous than the commonly accepted lower limit of ULX luminosities, it is still the first eclipsing black hole XRB system and – if in other observations detected in a factor of five brighter phase – may be the first stellar mass ULX candidate suitable for the proposed type of investigations.
As we discussed above, the resolved eclipse ingress and egress in the Chandra energy band is not caused by the extent and the structure of the X-ray emitting region but by absorption in the density structure of the atmosphere of companion and the accretion stream. Watarai et al. (2005) investigated the asymmetry of black-hole accretion flows and suggested the presence of effects with time scales of seconds due to relativistic effects close to the black hole. These should lead to asymmetries in the eclipsing light curves on time scales of seconds. The Chandra observations of the eclipse in- and egress of X7 show that such effects are masked by much longer time scale effects discussed above. They may only be observable by sensitive observations at higher X-ray energies such as those where absorption effects in the companion atmosphere and the accretion flow vanish.
5 Conclusions
The ChASeM33 observations clearly resolved eclipse ingress and egress of the persistent eclipsing HMXB M 33 X7 (catalog ). Combining the eclipse egress times with Einstein, ROSAT, and XMM-Newton observations allowed us to improve on the orbital period which indicates orbital decay. The X-ray spectrum can best be described by a disk-blackbody spectrum with parameters that do not change significantly in different observations while the source luminosity changes by up to a factor of two. The short term variability of X7 can be described by a flat power density spectrum. No significant regular pulsations were found in the frequency range of 10-4–0.15 Hz. HST WFPC2 images resolve the optical counterpart, which with the help of extinction and colour corrections derived from the X-ray absorption can be identified as an O6III star. The X-ray period and eclipse duration – together with fits to the light curve by PMM2004 of the optical companion – imply a black hole with a mass above as the most likely compact object in the system. M 33 X7 (catalog ) is the first eclipsing black hole HMXB.
References
- Barnard et al. (2005) Barnard, R., Kolb, U., & Osborne, J. P. 2005, A&A, submitted (arXiv:astro-ph/0508284)
- Blondin et al. (1990) Blondin, J. M., Kallman, T. R., Fryxell, B. A., & Taam, R. E. 1990, ApJ, 356, 591
- Blondin et al. (1991) Blondin, J. M., Stevens, I. R., & Kallman, T. R. 1991, ApJ, 371, 684
- Carroll & Ostlie (1996) Carroll, B. W., & Ostlie, D. A. 1996, Reading, Mass. : Addison-Wesley Pub., c1996.,
- Davis (2001) Davis, J. E. 2001, ApJ, 562, 575
- Dennerl (1991) Dennerl, K. 1991, Ph.D. Thesis, Ludwig-Maximilians-Universität München
- Dickey & Lockman (1990) Dickey, J. M., & Lockman, F. J. 1990, ARA&A, 28, 215
- Dubus et al. (1999) Dubus, G., Charles, P. A., Long, K. S., Hakala, P. J., & Kuulkers, E. 1999, MNRAS, 302, 731 (DCL99)
- Ebisawa et al. (1996) Ebisawa, K., Day, C. S. R., Kallman, T. R., Nagase, F., Kotani, T., Kawashima, K., Kitamoto, S., & Woo, J. W. 1996, PASJ, 48, 425
- Gordon et al. (1999) Gordon, S. M., Duric, N., Kirshner, R. P., Goss, W. M., & Viallefond, F. 1999, ApJS, 120, 247
- Haberl (1991) Haberl, F. 1991, A&A, 252, 272
- Haberl & Day (1992) Haberl, F., & Day, C. S. R. 1992, A&A, 263, 241
- Humphreys & Sandage (1980) Humphreys, R. M., & Sandage, A. 1980, ApJS, 44, 319
- Larson & Schulman (1997) Larson, D. T., & Schulman, E. 1997, AJ, 113, 618
- Levine et al. (1993) Levine, A., Rappaport, S., Deeter, J. E., Boynton, P. E., & Nagase, F. 1993, ApJ, 410, 328
- Levine et al. (2000) Levine, A. M., Rappaport, S. A., & Zojcheski, G. 2000, ApJ, 541, 194
- Lewis et al. (1992) Lewis, W., Rappaport, S., Levine, A., & Nagase, F. 1992, ApJ, 389, 665
- Liu et al. (2000) Liu, Q. Z., van Paradijs, J., & van den Heuvel, E. P. J. 2000, A&AS, 147, 25
- Long et al. (1981) Long, K. S., Dodorico, S., Charles, P. A., & Dopita, M. A. 1981, ApJ, 246, L61
- Makishima et al. (1986) Makishima, K., Maejima, Y., Mitsuda, K., Bradt, H. V., Remillard, R. A., Tuohy, I. R., Hoshi, R., & Nakagawa, M. 1986, ApJ, 308, 635
- Makishima et al. (2000) Makishima, K., et al. 2000, ApJ, 535, 632
- Markert & Rallis (1983) Markert, T. H., & Rallis, A. D. 1983, ApJ, 275, 571
- Massey et al. (2002) Massey, P., et al. 2002, AAS 199, 130.05
- Massey et al. (2006) Massey, P., Olsen, K. A. G., Hodge, P. W., Strong, S. B., Jacoby, G. H., Schlingman, W., & Smith, R. C. 2006, ArXiv Astrophysics e-prints, arXiv:astro-ph/0602128
- Mobasher (2002) Mobasher, B. 2002, User’s Guide, Hubble Space Telescope, January 2002. Edited by Bahram Mobasher. Baltimore: Space Telescope Science Institute
- Nagase et al. (1992) Nagase, F., Corbet, R. H. D., Day, C. S. R., Inoue, H., Takeshima, T., Yoshida, K., & Mihara, T. 1992, ApJ, 396, 147
- Newton (1980) Newton, K. 1980, MNRAS, 190, 689
- Peres et al. (1989) Peres, G., Reale, F., Collura, A., & Fabbiano, G. 1989, ApJ, 336, 140 (PRC89)
- Pietsch et al. (2003) Pietsch, W., Haberl, F., & Vogler, A. 2003, A&A, 402, 457
- Pietsch et al. (2004) Pietsch, W., Mochejska, B. J., Misanovic, Z., Haberl, F., Ehle, M., & Trinchieri, G. 2004, A&A, 413, 879 (PMM2004)
- Pooley & Rappaport (2005) Pooley, D., & Rappaport, S. 2005, ApJ, 634, L85
- Predehl & Schmitt (1995) Predehl, P., & Schmitt, J. H. M. M. 1995, A&A, 293, 889
- Prša & Zwitter (2005) Prša, A., & Zwitter, T. 2005, ApJ, 628, 426
- Safi Harb et al. (1996) Safi Harb, S., Ogelman, H., & Dennerl, K. 1996, ApJ, 456, L37
- Sasaki et al. (2005) Sasaki, M., Pietsch, W., Haberl, F., Gaetz, T. J., Ghavamian, P., Long, K. S., Pannuti, T. G., & Plucinsky, P. P. 2005, The Astronomer’s Telegram, 633, 1
- Schulman et al. (1994) Schulman, E., Bregman, J. N., Collura, A., Reale, F., & Peres, G. 1994, ApJ, 426, L55
- Schulman et al. (1993) Schulman, E., Bregman, J. N., Collura, A., Reale, F., & Peres, G. 1993, ApJ, 418, L67
- Stark et al. (1992) Stark, A. A., Gammie, C. F., Wilson, R. W., Bally, J., Linke, R. A., Heiles, C., & Hurwitz, M. 1992, ApJS, 79, 77
- van den Bergh (1991) van den Bergh, S. 1991, PASP, 103, 609
- Watarai et al. (2005) Watarai, K.-Y., Takahashi, R., & Fukue, J. 2005, PASJ, 57, 827
- White et al. (1983) White, N. E., Swank, J. H., & Holt, S. S. 1983, ApJ, 270, 711
- Wilson & Devinney (1971) Wilson, R. E., & Devinney, E. J. 1971, ApJ, 166, 605
- Wilson (1979) Wilson, R. E. 1979, ApJ, 234, 1054
- Wilson (1990) Wilson, R. E. 1990, ApJ, 356, 613
| ChASeM33 | ObsID | Obs.datesaadate of start of observation | Elapsed time | ACIS | Offax | X7 binary | |
|---|---|---|---|---|---|---|---|
| Field | (ks) | CCD-ID | (’) | phaseaadate of start of observation | cyclebbwith respect to eclipse center HJD 245 3639.119 and orbital period 3.453014 d (see text) | ||
| 2 | 6378 | 2005-09-21 | 112 | 7 | 17.9 | 0.675–1.044 | -2,-1 |
| 5 | 7170 | 2005-09-26 | 41 | 1 | 1.6 | 0.200–0.334 | 0 |
| 5 | 7171 | 2005-09-29 | 38 | 1 | 1.6 | 0.041–0.165 | 1 |
| 5 | 6384 | 2005-10-01 | 22 | 1 | 1.6 | 0.832–0.905 | 1 |
| 6 | 6386 | 2005-10-31 | 15 | 0 | 7.2 | 0.365–0.412 | 10 |
| 6 | 7196 | 2005-11-02 | 23 | 0 | 7.2 | 0.928–1.002 | 10,11 |
| 6 | 7197 | 2005-11-03 | 13 | 0 | 7.2 | 0.144–0.185 | 11 |
| 6 | 7198 | 2005-11-05 | 22 | 0 | 7.2 | 0.798–0.868 | 11 |
| 6 | 7199 | 2005-11-06 | 15 | 0 | 7.2 | 0.017–0.063 | 12 |
| 6 | 7208 | 2005-11-21 | 12 | 1 | 7.3 | 0.622–0.660 | 16 |
| 4 | 6382 | 2005-11-23 | 73 | 2 | 9.7 | 0.071–0.312 | 17 |
| 4 | 7226 | 2005-11-26 | 25 | 2 | 9.7 | 0.841–0.925 | 17 |
| Dataset | Date | Time | Exposure | Filter |
|---|---|---|---|---|
| (s) | ||||
| u2tr0301t | 1995-10-25 | 13:40:16 | 160 | F555W |
| u2tr0302t | 1995-10-25 | 13:45:17 | 400 | F336W |
| u2tr0303t | 1995-10-25 | 13:54:17 | 400 | F336W |
| u2tr0304t | 1995-10-25 | 14:04:17 | 500 | F439W |
| u2tr0305t | 1995-10-25 | 14:15:17 | 300 | F439W |
| Inclination | SMAaasemi-major axis of binary system | qbbmass ratio (Secondary over Primary) | Mopt | Mx |
|---|---|---|---|---|
| (degree) | () | () | () | |
| 90 | 38.1 | 3.68 | 49.1 | 13.3 |
| 85 | 37.4 | 3.88 | 47.0 | 12.1 |
| 80 | 35.8 | 4.53 | 42.4 | 9.4 |
| 75 | 33.5 | 5.78 | 36.2 | 6.2 |