Long-Term X-Ray and TeV variability of Mrk 501
Abstract
We present X-ray observations of the nearby TeV blazar Mrk 501 obtained with RXTE during 1997, 1998, 1999, 2000, and 2004. The goal of this study is twofold: 1) characterize the long-term X-ray flux and spectral variability of the source with a model-independent analysis, and 2) investigate the X-ray and TeV correlation on long timescales ( days). Significant spectral variations were observed during all the observations along with long-term timescale correlations between the X-ray colors and the count rate. Specifically, on long timescales, a typical blazar behavior is observed with the spectrum hardening when the source brightens, and the fractional variability correlating with the energy band. A similar spectral trend is observed also in the majority of the individual flares. The spectral and temporal variability properties appear to be markedly different compared to those of non-jet-dominated radio-loud and radio-quiet AGN monitored with RXTE. To investigate the X-ray – TeV correlation on long timescales we compared RXTE monitoring data with HEGRA and Whipple historical light curves. We confirm the presence of a direct correlation between X-ray and -ray emissions, which appears to be stronger when the source is brighter. The analysis of individual flares shows that the X-ray – TeV correlated activity is heterogeneous, in the sense that it might be both linear and nonlinear, and some X-ray flares seem to be lacking the TeV counterpart. However, more sensitive TeV observations are necessary to confirm these findings, and to put tighter constraints on jet models.
1 Introduction
BL Lacertae objects (BL Lacs) are members of the blazar class, which are radio-loud AGN dominated by non-thermal continuum emission from radio up to -rays (MeV to TeV energies) from relativistic jets oriented at small angles to the observer (e.g., Urry & Padovani 1995). The Spectral Energy Distributions (SEDs) of BL Lacs are characterized by two components: one from radio to X-rays due to synchrotron, generally peaking at UV/soft X-rays; and one peaking at TeV gamma-rays, usually interpreted as inverse Compton scattering of ambient soft photons (e.g., Ulrich, Maraschi, & Urry 1997).
Among BL Lacs, the nearby (z=0.034) source Mrk 501 is one of the brightest at X-rays and a strong TeV emitter. This source came into much attention after it exhibited a prolonged period of intense TeV activity in 1997, accompanied by correlated X-ray emission on timescales of days (Catanese et al., 1997; Hayashida et al., 1998; Quinn et al., 1999; Aharonian et al., 1997; Djannati-Atai et al., 1999). Interestingly, this exceptional TeV activity was accompanied by unusually hard X-ray emission up to 100 keV (Pian et al., 1998; Catanese et al., 1997; Lamer & Wagner, 1998; Krawczynski et al., 2000), unprecedented in this or any other BL Lac. The hard X-ray spectrum (photon index ) implied a shift toward higher energies of the synchrotron peak by more than three decades, persistent over a timescale of 10 days (Pian et al. 1998). In June 1998 a second TeV outburst was observed, again accompanied by a shift of the synchrotron peak at higher energies on timescales of 1 day or more (Sambruna et al., 2000). The peak shift is positively correlated with the long-term luminosity changes (Tavecchio et al., 2001).
In this paper, we start a systematic study of the long-term X-ray flux and spectral variability of Mrk 501 using proprietary and archival Rossi X-ray Timing Explorer (RXTE) observations.
The first part of this work is a model-independent study of the X-ray temporal and spectral properties of this jet-dominated source on long timescales. The main purpose of this analysis is to shed light on the role played by the jet in the X-ray emissions of different classes of AGN. Specifically, a model-independent characterization of the temporal and spectral behavior of blazars (which are the only AGN with broad-band emission completely dominated by the jet), combined with analogous information obtained from studies of radio-quiet AGN, will allows one to investigate quantitatively the jet contribution in radio-loud non-jet-dominated sources (e.g., Gliozzi, Sambruna & Eracleous 2003). Once the jet contribution is properly assessed, the physical parameters characterizing the accretion process onto the supermassive black hole can be better constrained, and hence it is possible to discriminate between competing theoretical models. This model-independent characterization of the jet contribution at X-rays is important not only for radio-loud AGN, but also for their scaled-down counterparts, the Galactic black hole (GBHs), which are known to have compact radio jets during their “low-hard” spectral state. Indeed, despite the much higher signal-to-noise of their spectra and light curves, the jet contribution to the total X-ray emission in the low-hard state of GBHs is still matter of strong debate (see, e.g., Markoff et al. 2003; Zdziarski et al. 2004).
Another goal of this work is to investigate the correlation between the X-ray and TeV bands on timescales 1 day. TeV blazars, such as Mrk 501, are known to show a positive correlation between X-ray and TeV emission, although exceptions exist (e.g., Krawczynski et al. 2004). Detailed studies of the X-ray – TeV correlation are crucial to constrain and discriminate the two competing classes of models: the leptonic models, where the TeV emission is due to the synchrotron self-Compton (SSC) process (e.g. Tavecchio et al. 2001), and the hadronic models, in which the TeV emission is the product of cascades initiated by relativistic hadrons. More specifically, in hadronic models the continuum emission is explained by hadronic interactions of a highly relativistic baryonic outflow which sweeps up ambient matter (Pohl & Schlickeiser, 2000), by interactions of high-energy protons with gas clouds moving across the jet (Dar & Laor, 1997), or by interactions of ultra high energy protons with ambient photons (Mannheim, 1993), with the jet magnetic field (Aharonian et al., 2000), or with both (Muecke et al., 2003).
The outline of the paper is as follows. In we describe the observations and data reduction. In we study the X-ray variability of Mrk 501 during long-term monitorings and individual flares, using the fractional variability to quantify the temporal behavior and the hardness ratios to investigate the spectral variability. In we investigate the X-ray – TeV correlation using data from HEGRA and Whipple in combination with RXTE observations. In we discuss the implications of the results of the temporal and spectral analysis. Finally, we summarize the main conclusions in . For completeness, in Appendix 1 we briefly report the main results from a time-averaged spectral analysis, and in Appendix 2 we summarize the results from the temporal and spectral analyses of July 1997.
2 Observations
2.1 Sampling
1997: RXTE observed Mrk 501 in the 2–60 keV energy
band (as in all others observations with the RXTE PCA) beginning on
March 18 with the following pattern: the source was observed on March
18 and then once or twice a day from April 3–16, May 2–15, and July
12–16. During this period there was a large outburst of
rays extending to energies greater than 20 TeV (Aharonian et
al. 1997,1999).
1998: RXTE observed Mrk 501 as part of different
campaigns by different PIs starting February 25 with the following
sampling: throughout the monitoring campaign the source was observed
regularly every three or four days with the exception of three periods
(May 15–29, June 15–29, and July 23–29) when the sampling density
was increased (one to five observations per day).
The TeV data of Mrk 501 were obtained by the Cherenkov telescope
system of the High-Energy Gamma-Ray Observatory (HEGRA).
Unfortunately, the source was in a low state at TeV gamma-rays, except
for two weeks in June 1998, when it underwent a large burst at both
X-rays and TeV energies (Sambruna et al., 2000; Aharonian et al., 2001).
1999: RXTE observed Mrk 501 with the following
pattern: there were three periods of dense sampling (one to three
observations per day) on the dates May 6–26, June 4–10, and July
4–5. The source was weak at TeV energies with an average integral
flux 13 times lower than that of 1997 (Aharonian et al., 2001).
2000:
Starting July 20, 2000 RXTE observed Mrk 501 with the
following pattern: for three times the source was monitored
daily for 14 days, with a gap of two weeks in between the observation
periods.
A portion of the total allocated RXTE observing time was
used earlier in the year to monitor Mrk 421 in flaring state
(Krawczynski et al., 2001).
During the 2000 X-ray monitoring Mrk 501 was very weak at TeV, with no
episodes of major outbursts.
2004:
In addition to the long-term monitoring campaigns, whose data have been
at least partially published, we report on a recent X-ray – TeV flare
observed in June 2004.
Starting from June 11 2004, Mrk 501 was observed with RXTE for thirteen
days and with Whipple for eight days. Unfortunately the source was caught during a
period of dim TeV activity, yielding mostly upper limits in that
energy range and hence hampering the investigation of the
X-ray – -ray correlation.
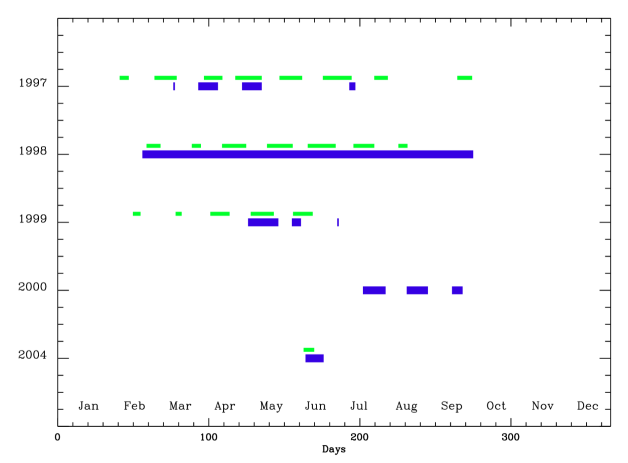
Figures 1 and 2 describe the monitoring campaigns of Mrk 501. In Figure 1 we summarize the temporal coverage in the X-ray (darker thicker line) and in the TeV (lighter thinner line) energy bands, carried out by RXTE and HEGRA/Whipple, respectively. Continuous intervals do not mean that the observations are actually continuous, but simply that they have been carried out with samplings typical for each instrument, which means every 3–4 days for RXTE observations and 1–2 days for the TeV observations performed with HEGRA/Whipple. As a consequence, in this figure any temporal gap shorter than 5 days has been neglected (i.e., considered as continuous) in the RXTE monitoring. Similarly, any gap shorter than 3 days has been neglected in the TeV monitoring.
Figure 2 shows the historical X-ray and TeV light curves starting February 2nd 1997 (MJD=50489.5) and ending June 24th 2004 (MJD=53180.3). The light curves reveal the significant change of count rate, which occurred in both energy bands over the seven-year monitored interval. As an operative criterion for this work, we consider “contemporaneous” X-ray – TeV observations those taken less than 8 hours apart. The source may vary on much shorter timescales, which could complicate some of the interpretations.
2.2 Data reduction
X-rays: The PCA and HEXTE data were reduced using
REX, with standard screening criteria for a FAINT
source. Some of the proportional counter units (PCUs) were
occasionally turned off; we used all the available PCUs and then
normalized the count rate to 1 PCU. The current temporal analysis is
restricted to Proportional Counter Array (PCA; Jahoda et al. 1996),
STANDARD-2 mode, 2–20 keV, Layer 1 data, because that is where the
PCA is best calibrated and most sensitive. The data were initially
extracted with 16 s time resolution and subsequently re-binned at
different bin width depending on the purpose for which they were
employed. In most of the cases we used a binning time of the order of the
orbital timescale of RXTE (5760 s).
The time-averaged spectral analysis was performed using PCA data in the
4–20 keV band and HEXTE data in the 20–60 keV range, where the instruments
are better calibrated and the signal-to-noise ratio is higher.
Spectral analysis of the data was performed using XSPEC
v. 11.3.1.
TeV Observations:
We used a large data base of published TeV gamma-ray data
(e.g., Quinn et al. 1999; Aharonian et al. 2001).
In addition, new data were acquired with the Whipple
10 m Cherenkov telescope (Mount Hopkins, AZ). The Whipple collaboration
kindly allowed us to use the data for this publication.
Detailed descriptions of Whipple
observing modes and analysis procedures can be found elsewhere
(e.g., Punch et al. 1992; Reynolds et al. 1993; Weekes 1996).
Based on the Whipple measurements of the energy spectrum from the Crab
nebula (Hillas et al., 1998), a flux of 1 Crab corresponds to a differential 1
TeV flux of (3.200.17stat)
photons cm-2 s-1 TeV-1 and to a flux of (5.120.27stat)
ergs cm-2 s-1. The upper limits were computed
with the Bayesian formalism described by Helene et al. (1983).
3 X-ray Temporal Analysis
Here we investigate the temporal and spectral variability properties of Mrk 501 during long-term monitorings (from weeks to several months) and individual flares using different model-independent techniques, based on X-ray colors and fractional variability.
Figure 3 shows the background-subtracted light curves of Mrk 501 in the 2–20 keV energy band, along with the coordinated TeV observations. The X-ray count rate is normalized to 1 PCU and the time binning is one RXTE orbit ( 5760 s). The first relevant feature is the significant difference in the mean count rate (note the different scale on the y axes of Fig. 3) from one year to another. This can be better appreciated comparing the total count rates and using a uniform y range, as done in the top panel of Figure 2. The 2–20 keV mean count rate decreases from 41.5 c/s/PCU in 1997, to 11.6 c/s/PCU in 1998, reaching a minimum of 6.6 in 1999, and then rises again at 11.7 c/s/PCU in 2000, and 14.7 c/s/PCU in 2004. All light curves are characterized by frequent flares with variable amplitude. Typically, the count rate in the 2–20 keV energy band changes by factors 2–3 on timescales of 5–10 days.
3.1 X-Ray Colors
Light curves in 2–5 keV (soft), 5–10 keV (medium), and 10–20 keV (hard) energy bands were extracted to investigate whether the observed flux variability is accompanied by spectral variability. We found significant and usually coordinated variability between energy bands. Starting from the light curves in the three selected energy band, we defined two X-ray colors as ratios of count rates in different bands: , and . X-ray colors provide a simple, model-independent way to investigate spectral variability.
We carried out tests against the hypothesis of constancy for the X-ray color light curves to assess quantitatively the presence of spectral variability during the different monitoring campaigns of Mrk 501. For all the cases we found a chance probability , indicating the presence of a strong spectral variability.
Figure 4 shows the Hard/Soft X-ray color plotted versus the count rate. Panels a, b, and c show the three long monitoring campaigns carried out during 1997, 1998, and 2000; we do not consider the observations in 1999 and 2004 as long-term monitorings, since they cover only one flare. Figures 4 d-i show the hardness ratio - count rate (hereafter, ) plots for several prominent flares, with the rising phase described by filled circles and the decay phase by open diamonds. The number represents the starting point. We restrict our analysis to flares with the best coverage, meaning those with at least 10–15 data points in the X-ray light curve (assuming time-bins of one satellite’s orbit) and, possibly, with associated TeV emission.
A visual inspection of Figures 4 a, b, and c suggests the presence of a positive trend, within a considerable scattering, with the source hardening when the count rate increases. To verify whether this apparent trend is statistically significant and quantify the degree of correlation, we performed the following tests. First, we computed the Pearson’s linear-correlation coefficient r and the relative chance probability . Since in some cases (for example if the underlying correlation is not linear) the Pearson’s correlation coefficient might be misleading, we also computed the degree of correlation using two non-parametric statistics, such as the Spearman’s rank and the Kendall’s rank . In addition, we estimated the best-fit linear slope using a least square fitting method. The results of the correlation analysis are reported in Table 1 and confirm, at high significance level, that is positively correlated with the count rate during the three long-term monitoring campaigns. Similar conclusions are derived also when the X-ray color is used instead of .
The same analysis carried out on individual flares leads to similar conclusions: the flares harden during the rising phase and soften during the decay phase. A noticeable exception is the event on July 1997, where the opposite trend is observed (Fig. 4e). This spectral behavior, very unusual for a blazar and hard to reconcile with the simplest blazar models, was first noticed by Lamer & Wagner (1998), who analyzed the RXTE observations of Mrk 501 in July 1997. Note that this event is not a single flare, but is composed of a decay phase of a first flare and the rising phase of second flare. We discuss this result in more detail in .
Frequently, in other well studied HBL (for recent studies based on high-quality XMM-Newton data of Mrk 421 see Brinkmann et al. 2003; Ravasio et al. 2004) the inspection of individual flares in the hardness ratio - count rate plot exhibit hysteresis loops, both in a clockwise and anti-clockwise sense. Figures 4g and 4h (for which arrows have been drawn to guide the eye) suggest the presence of clockwise hysteresis loops during June 1998 and May 1999, where the points corresponding to the rising phase of the flares (filled circles) are located at higher values of compared to points of the decay phase (open diamonds) of similar count rate level. In July 1997 (Fig. 4e), the presence of an anti-clockwise loop is an artifact, in the sense that it is due to the combination of two different flares. In all other cases (Figures 4d,f,i) no signs of hysteresis loops are present.
In summary, all results consistently indicate the presence of a positive correlation between and (within a considerable scattering) during the long-term monitoring campaigns and for nearly all the flares investigated (the only clear exception is July 1997 and will be discussed in 5). This is a typical behavior for high-energy peaked BL Lacs (HBL): the spectrum hardens when the source gets brighter.
3.2 Fractional Variability
A simple way to quantify the variability properties of Mrk 501, without considering the time ordering of the values in the light curves, is based on the fractional variability parameter (e.g. Rodriguez-Pascual et al. 1997; Edelson et al. 2002; Vaughan et al. 2003). This is a common measure of the intrinsic variability amplitude relative to the mean count rate, corrected for the effect of random errors, i.e.,
| (1) |
where is the variance, the unweighted mean count rate, and the mean square value of the uncertainties associated with each individual count rate. The square of the fractional variability parameter, , is called normalized excess variance , whereas the excess variance is defined as .
We carried out two different kind of analyses using the fractional variability parameter: 1) vs. and 2) vs. . In the first kind of analysis, we computed on selected energy bands for the whole 1997, 1998, and 2000 light curves, and for the individual flares selected above. We used light curves in three energy bands, 2–5 keV (soft band), 5–10 keV (medium band) and 10–20 keV (hard band), and calculated for all of them. All bands show significant variability. The very high count rate of Mrk 501 in 1997 allows one to perform the same analysis using a larger number (10 instead of 3) of narrower energy bands. For all long-term observations, we found suggestive evidence that the amplitude of variability increases with increasing energy band (see Fig. 5 a,b,c). Similar positive trends are found in most of the flares, again with the exception of July 1997 (Fig. 5e) which shows an opposite trend, whereas flares in May 1999 (Fig. 5h) and June 2004 (Fig. 5i) are basically consistent with the hypothesis of constant variability in all bands.
The results of a quantitative correlation analysis (performed with methods described in the previous section) are summarized in Table 2, and confirm the presence of a positive trend with increasing fractional variability with increasing energy during the long-term monitoring campaigns and for three flares. Since, with the exception of 1997 campaign, the plots account for three points only (each of which accounts for information from energy-selected light curves), the significance of the statistical tests might be questionable. However, it is worth noting that the highly significant positive correlation found in 1997 (with 10 data points) is not due to a particularly steep trend in the plane (in fact the 1997 slope is flatter than those in 1998 and 2000), but simply to the fact that the better photon statistics allowed us to compute over a larger number of energy bands. Therefore, it is reasonable to expect that also in 1998 and 2000 a strong positive correlation would have been confirmed, if could have been computed on several energy bands. In conclusion, the fact that a positive trend is found in all long-term monitorings and in most of the flares, along with the fact that a positive trend still exists when is increased by a factor 3 and is decreased by 3, strongly argues in favor of a genuine positive correlation.
In the second kind of analysis, we calculated over selected time-intervals, in order to look for the presence of a correlation (or anti-correlation) with the mean count rate. Since the value of depends both on the duration of the interval and on the number of data points, we chose intervals of similar length and with a time binning appropriate to produce a similar number of points in each interval. This analysis was carried out both on long and short timescales: in the former case, we selected several intervals over the entire period spanned by the monitoring campaigns (i.e., from March 1997 to July 2000), whereas to probe shorter timescales we focused on May 1998, when the monitoring frequency was the highest. Specifically, to investigate the long-term – ct correlation, we selected intervals of duration of 13–15 days with at least one observation per day, and re-binned the light curves at 1 orbit. With these criteria, we were able to select seven intervals of similar length and sampling.
Figures 6a and 6c, which show the excess variance and the fractional variability parameter plotted against the mean count rate, suggest the presence of a positive trend for both quantities. This result is supported by a Spearman rank correlation analysis, which yields chance probabilities of 0.2% and 3.6% for and , respectively. However, the small number of data points available does not allow us to draw firm conclusions.
A similar analysis on shorter timescales has been carried out during the denser monitoring campaign on May 1998 (Figures 6b and 6d). Using time bins of 1000 s, we divided a 14-day interval into 12 sub-intervals of duration of 1 day containing 20 points each, and computed and for these sub-intervals. Also in this case both and seem to be positively correlated with the mean count rate; however, only for the existence of the correlation is supported by a a Spearman rank correlation analysis at a significant level (), whereas the chance probability for a positive correlation between and is . We caution that these results should be merely considered as suggestive, due to their low statistical significance and due to the unaccounted possible effects related to the red-noise nature of the variability (see Vaughan et al 2003 for a detailed discussion). A deeper investigation of this issue can in principle be performed using extensive Monte Carlo simulations with specific assumptions about the power spectrum model describing the X-ray variability. However, this is beyond the scope of this paper, and, in any case, the outcome of these model-dependent tests would be questionable, since the characteristic of power spectral models for blazars are poorly constrained.
4 Correlated X-ray and TeV variability
It is well known that Mrk 501 exhibits short-term, correlated flux variations at X-ray and TeV wavelengths (Sambruna et al. 2000, Krawczynski et al. 2002; Katarzyński et al. 2005). Here, we investigate whether the long-term X-ray and TeV variations are correlated as well. We will also study the correlated X-ray and TeV activities during the most prominent flares.
Figures 3a–e show the 1997, 1998, 1999, and 2004 historical X-ray light curves from RXTE, together with the historical TeV light curves obtained by HEGRA (filled circles) and Whipple (open diamonds). Most of the HEGRA data were originally discussed by Aharonian et al. (2001), whereas most of the Whipple data were discussed by Quinn et al. (1999). Despite the numerous gaps, correlated variability of the flux at X-ray and TeV energies is present. To illustrate the presence of a positive trend during the long-term monitoring campaigns in 1997 and 1998, we plotted the TeV count rate against the 2–20 keV count rate (see Figure 7 a and b). We quantitatively tested the existence of correlations, using the methods described in . All methods consistently indicate the presence of positive correlations in both monitorings. For example, in 1997 we found () and the slope from a least square fit method is , whereas in 1998 we obtained () and . Due to the low-level of the TeV activity in 1998 coupled with the limited sensitivity of the Cherenkov telescopes, many TeV fluxes are close to the detection threshold and hence have large statistical errors, casting doubts on the statistical significance of the positive trend found. For this reason, we have also used a more conservative approach considering as upper limits all the data with flux 3. We used the statistical package ASURV (Lavalley, Isobe & Feigelson 1992) that is well suited for censored data, obtaining and , which are fully consistent with the previous results and confirm the existence of a positive X-ray – TeV correlation in 1998.
Figure 7c , which shows the TeV count rates, averaged over each contemporaneous monitoring campaign, plotted versus the corresponding X-ray average count rates suggests that a positive keV–TeV correlation exists on even longer timescales. The campaign in 2000 and 2004 were excluded, because in the first case no coordinated TeV observations were performed, whereas in 2004 basically all TeV measurements were upper limits.
Very few flares have sufficient coverage to allow a meaningful study of the X-ray/TeV correlation on shorter timescales. Nonetheless, it is interesting to note the heterogeneous behavior shown by different flares (Figure 8). For example, in May 1997 (Fig. 8a), a positive linear trend is observed: describing such trend with a simple power law , we find . On the other hand, in June 1998 (Fig. 8b), a non-linear correlation () seems to occur. To test whether the latter data can be instead described by a linear correlation, we fitted the data of June 1998 with fixed to 1 and 2. The resulting fits indicate that the non-linear case is preferable also on statistical grounds (the linear case causes an increase of for the same number of degrees of freedom). Unfortunately the paucity of the data and the large statistical errors hampers a more detailed analysis. Owing to large statistical errors, the data taken during May 1999 (Fig. 8c) do not show any evidence for a correlation.
A very interesting aspect of the relationship between the “simultaneously”111Fig. 3 uses X and TeV data points which have been taken within 8 hr from each other. measured X-ray and TeV fluxes is the substantial scatter observed in the X-ray/TeV plane. The 1997 observations show that for a given X-ray flux level, the TeV fluxes can vary by factors up to 3, and for a given TeV flux level, the X-ray fluxes can vary by factor up to 2 (Fig. 7a). In the 1998 data set there seems to be a linear correlation between the X-ray and TeV fluxes, but for a single flare, the TeV flux deviates by a factor of 9 from the flux predicted by the linear fit to the correlation (Fig. 7b). Note that the data point lies 11.1 standard deviations above the linear fit taking into account both, the statistical uncertainties on the best-fit parameters and the statistical errors on the X and TeV flux measurements. While it is tempting to refer to flares with relatively high TeV fluxes accompanied by low X-ray fluxes as “orphan TeV flares” and to flares with relatively high X-ray fluxes accompanied by low TeV fluxes as “childless X-ray flares”, this interpretation depends on how one defines a flare and the absence of a flare in a certain frequency band.
A robust conclusion from the data sets discussed in this paper is that the X/TeV correlation shows highly significant scatter, which suggests the presence of uncorrelated activity in these two energy bands. To illustrate this point, we consider the enlargment of two flares occurring less than three months apart during the 1998 coordinated campaign (see Fig. 9). In both cases the X-ray count rate increases by a factor 4 in less than one week. However, the associated TeV activity, which on both occasions was well sampled with nearly one observation per day, shows a strikingly different behavior. During the X-ray flare on April 1998 the TeV level remains roughly constant around the detection threshold. On the other hand, the X-ray flare in June 1998 is accompanied by a very prominent flare in the TeV energy band.
5 Discussion
In this work we have undertaken a systematic study of the X-ray temporal and spectral variability of the HBL Mrk 501 as seen with RXTE PCA, as well as of the long-term correlation between the X-ray and TeV energy bands.
In the past years, several monitoring studies of the brightest blazars were carried out with different satellites; e.g., PKS 2155-304 was monitored with ROSAT HRI (Brinkmann et al. 2000) and later with BeppoSAX (Zhang et al., 1999). Similarly Mrk 421 was monitored with BeppoSAX (Fossati et al., 2000), and both sources along with Mrk 501 were also monitored with ASCA (Tanihata et al., 2001). However, the relatively short length (few weeks at most) of the light curves hampered the investigation of the long-term (months to years) temporal properties. Only the use of RXTE, with its flexible observing schedule combined with a high sensitivity, has allowed one to probe the long-term variability in blazars. For example, using RXTE PCA data, Kataoka et al. (2001) studied the X-ray variability properties of Mrk 421, Mrk 501, and PKS 2155-304 on timescales ranging between and s, with structure functions and power density spectra. Krawczynski et al. (2000, 2002) studied X/TeV observations of Mrk 501 during the 1997 flaring epoch, focussing on the interpretation of the data in the framework of time-dependent Synchrotron Self-Compton models. More recently, Cui (2004) reported the results from the flaring activity of Mrk 421 using archival RXTE data, and a similar investigation on Mrk 501 was carried out by Xue & Cui (2005). Although the latter authors use data overlapping with ours, the aim of the X-ray temporal analysis is quite different: Xue & Cui are mostly interested in the hierarchical nature of the flares and on the detection of the minimum characteristic timescale; on the other hand, our temporal analysis is aimed at characterizing in a model-independent way the temporal and spectral variability of a jet-dominated source, with the final purpose of shedding light on the jet contribution in non-jet-dominated AGN.
The main results from our model-independent analysis based on X-ray colors and fractional variability can be summarized as follows: on long timescales (i.e., from few to several months) the source spectrum hardens as the source brightens, and the amplitude of variability progressively increases going from the softest energy band (1–5 keV) to the hardest one (10–20 keV). These findings are typical for HBLs (e.g., Ulrich et al. 1997; Aharonian et al. 2005). Interestingly enough, the opposite spectral and amplitude variability trends (e.g. Papadakis et al. 2002; Markowitz & Edelson 2001) are observed in radio-quiet AGN. In this case, the spectrum becomes steeper as the flux increases, which can be either explained in terms of a variation of the spectral slope, predicted by thermal Comptonization models (e.g., Haardt & Maraschi 1991), or in terms of a two-component model related to the accretion process (Shih, Iwasawa & Fabian 2002).
A direct consequence of the striking diversity between jet-dominated and radio-quiet X-ray spectral properties, is that a model-independent analysis of the long-term X-ray variability can, in principle, put constraints on the role played by the jet. This is particularly important for radio-loud non-blazar objects, where a jet is certainly present but is not pointing toward the observer. In this context, it is worth noticing that a similar analysis based on the X-ray colors and fractional variability was carried out by Gliozzi, Sambruna, & Eracleous (2003) on two Broad Line Radio Galaxies (BLRG), 3C 390.3 and 3C 120, which, according to the Unification model, should be the same intrinsic objects as blazars, but seen at a larger viewing angle. Interestingly enough the BLRGs show a trend of decreasing with increasing energy, and a trend of decreasing hardness ratio with increasing count rate. This suggests the existence of a different process causing X-ray variability in the two radio-loud classes of AGN, and that the X-ray radiation in BLRGs is unlikely dominated by the jet emission. However, before assuming as a universal, genuine signature of the jet the X-ray spectral variability observed in Mrk 501, the same model-independent analysis should be carried out on other jet-dominated objects. For example, objects belonging to the Low-energy peaked BL Lacs (LBL) and intermediate BL Lacs have been known to show short-term spectral and temporal properties different from HBL (e.g., Urry et al. 1996; Tanihata et al. 2000). We plan to undertake this analysis in a future work, using RXTE archival data.
It is worth pointing out that the previous findings refer to long timescales (from few to several months). When shorter timescales are considered, for example in the case of single flares, the typical HBL spectral and variability trend (i.e., harder spectrum–when–brighter and variability amplitude larger at harder energies) is still observed in most of the cases, but not in all of them. The most noticeable exception is the event observed in July 1997 (Fig. 4e, 5e), which shows the opposite temporal and spectral trends. Below we discuss this peculiar event in more detail.
As already mentioned, X-ray emission from HBL like Mkn 501 is almost unanimously attributed to synchrotron emission. In this framework, the study of the variability displayed by the X-ray continuum offers the opportunity to probe the dynamics of the underlying population of relativistic electrons. In this context the general variability trend () is readily explained by the fact that the hard X-rays are produced by more energetic particles, that are characterized by shorter cooling timescales causing the higher variability amplitude observed at hard X-rays. Analogously, the general spectral trend (source harder when brighter), including the presence of hysteresis loops in the plane, carries important information on the acceleration and cooling processes acting on the emitting electrons. Indeed these characteristics are often explained in terms of different ratios between the acceleration and the cooling timescales of the relativistic electrons (Kirk et al. 1998; Ravasio et al. 2004). In this regards, particularly intriguing is the event observed in July 1997. This event, which comprises the decay phase of a first flare followed by the rising phase of a second flare, has been already investigated in details by Lamer & Wagner (1998). The main result of the above study, in addition to the alreay mentioned anti-correlation , is that the soft and hard X-ray light curves vary in a completely independent way. The main conclusion derived by Lamer & Wagner was that at least two emission components are necessary to explain this unusual behavior. However, no explanation on the physical nature of these components was proposed, apart from the implicit assumption that part of the X-rays are produced by synchrotron emission from the low-energy tail of the electron distribution.
We have re-analyzed the RXTE PCA data of July 1997; the details of this analysis are reported in Appendix 2. The first important point to consider is that this event (observed with 10 pointings over 5 consecutive days) is made up of several sub-flares on timescales of few hundreds of seconds (see Fig. 10). We investigated the trend of the fractional variability versus the energy for the longest individual pointings (duration s) and found that is never significantly larger than . In fact, a positive trend is found in the plane, when the source shows significant variability (on July 13 and 16; see Fig. 11), whereas no trend is observed when the short-term light curve is roughly constant (July 14 and 15). As a consequence, the “anomalous” inverse correlation obtained combining all the data of July 1997 (Fig. 5e) is likely to be a spurious result.
For the same long pointings, we plotted the X-ray hardness ratio versus the count rate (Fig. 11, panels of the second column) and found no evidence for any inverse correlation on short timescales; a “normal” positive trend is observed in all the pointings, except for July 14, when a constant trend is present. However, combining the individual pointings, an inverse correlation is observed, i.e., a brightening of the source accompanied by spectral softening. To investigate further this issue, we performed a time-resolved spectral analysis on the individual, long exposures, using the most recent PCA background and calibrations files. The results of this analysis, summarized in Table 3, reveal that all the spectra are well described by a broken power-law model with the same spectral parameters (, keV, ), except for the observation on July 16, which is characterized by the highest count rate. On that occasion, a significant steepening of the hard photon index is observed (). In the framework where the X-rays are produced via synchrotron emission, represent the location of the synchrotron peak in the plot. In this context, the time-resolved spectral analysis seems to reveal an unusual behavior, suggesting the presence of an anti-correlation between the synchrotron peak and the source luminosity. However, a better coverage (i.e., with uninterrupted observations and higher quality spectra) of Mrk 501 during its highest activity level is necessary to confirm this result.
In our model-independent analysis of the X-ray variability of Mrk 501 we have also investigated the possible presence of a correlation between the fractional variability and the mean count rate, and between the excess variance and the mean count rate. Our analysis is motivated by recent work from Uttley and collaborators (Uttley et al. 2005 and references therein) that revealed, both for radio-quiet AGN and GBHs, the existence of a positive linear correlation between the amplitude of the X-ray variability (as measured by the non-normalized excess variance) and the X-ray flux. Note that, when the excess variance is normalized to the mean count rate (as in the case of ), the positive correlation vanishes. Uttley et al. (2005) show that the presence of this rms-flux correlation sets tight constraints on variability models, ruling out all intrinsically linear models. Recently, this analysis has been applied by Zhang et al. (2005) to the jet-dominated source PKS 2155-304, using XMM-Newton data. Similarly to radio-quiet AGN, PKS 2155-304 shows, on short timescales, a positive correlation between and the mean count rate, however, it also shows a negative correlation between and the mean count rate. Our analysis, carried out using homogeneously sampled intervals of 2 weeks and spanning a time period of 3–4 years, suggests the presence of a positive correlation with the mean count rate of both and . We caution, however, that, due to the paucity of data points and the unaccounted possible effects of the red-noise nature of the variability, this result should be considered merely as suggestive. Long uninterrupted yearly-long monitoring campaigns of blazars (similar to those carried out for radio-quiet AGN) are necessary to derive firmer conclusions on this issue.
The second important goal of our analysis is to investigate the long-term correlation between the X-ray and TeV bands. It is well known that in these sources X-rays and TeV emissions are positively correlated on a wide range of different timescales, from hours (e.g., Maraschi et al. 1999; Fossati et al. 2004) to weeks-months (e.g., Krawczynski et al. 2000; Blazejowski et al. 2005). As expected, we confirm that Mrk 501 shows a positive correlation between the X-ray and TeV emission. An interesting feature, revealed by the analysis of correlated X-ray and TeV activities, is that the X/TeV correlation exhibits a considerable scatter: a range of X-ray fluxes is observed for a given TeV flux and a range of TeV fluxes is observed for a certain X-ray flux. The scatter may have several explanations. For example, if flares are shorter or longer in the TeV band than in the X-ray band (owing for example to different radiative cooling times of the particles responsible for the TeV and X-ray emission), the flux ratio changes during a flare. If physical parameters characterizing the emitting plasma (e.g. the magnetic field, or the size or Doppler factor of the emitting plasma) change over time, the X/TeV flux ratio would change during a flare or from flare to flare. Furthermore, orphan TeV flares or X-ray flares without TeV counterpart may complicate the picture.
The presence of a positive X-ray – TeV correlation is, at first order, a prediction of SSC models, where the X-ray emission is produced by the synchrotron radiation from highly relativistic electrons in the jet, which are also responsible for the TeV emission through the inverse-Compton scattering process off the synchrotron photons (that, for high energies involved here, occurs in the Klein-Nishina regime). Alternatively, this correlation can be explained by hadronic models, where the X-ray emission is still attributed to synchrotron radiation from relativistic electron in the jet, but the TeV emission is supposed to be produced by particles resulting from cascades triggered by relativistic protons (e.g., Mücke et al. 2003) or by the protons themselves through synchrotron emission. However, it is worth noting that, for the typical duration of the flares analized in this work ( days), the emission cannot be attributed to a single, moving blob, as usually assumed in the simplest versions of these models, usually applied to shorter events (Katarzynski et al., in prep). Indeed, for typical Lorentz factor , the blob would travel for a distance pc, implying a huge expansion and thus a strong variation of the physical parameters and of the timescale of the variations, in contrast with the substantial stability of the observed emission. Thus the observed flares are probably composed by several subflares produced in different regions of the flow. For this reason the presence of the large scattering observed in the X-ray – TeV correlation on long timescale is not surprising.
However, other observational results are starting to put stronger constraints on the models. For example, it is difficult to explain the existence of X-ray flares not accompanied by TeV flares, as the ones possibly observed in Mrk 501, and of “orphan” TeV flares, as observed in 1ES1959+650 (Krawczynski et al. 2004; but see the hadronic scenario proposed by Boettcher 2005). Further constraints on theoretical models can be placed by the analysis of individual flares, if a non-linear correlation (i.e., with ) is detected. In particular, as discussed in detail by Katarzyński et al. (2005), current SSC models face a difficult challenge in explaining the presence of a non-linear correlation during the decay phase of the flare. Unfortunately, the sparse coverage of the decay phase in the flares of Mrk 501 monitored with RXTE PCA does not allow one to investigate further this important issue.
Higher quality simultaneous X-ray – TeV observations both on short (i.e., individual flares) and long timescales are critically necessary to establish firmly the nature of this correlation and the presence (or lack) of genuine orphan flares, which in turn will possibly allow to distinguish between the competing theoretical models.
6 Summary and Conclusions
We presented the results of a temporal and spectral analysis of RXTE observations at X-rays of the nearby TeV blazar Mrk 501, performed between 1997 and 2004. The goal of our ongoing study is to characterize the long-term X-ray flux and spectral variability of this source, and compare it to the TeV long-term light curve. The main findings and conclusions can be summarized as follows:
-
•
The first important result of the variability analysis of Mrk 501 is that the source has a very strong spectral variability and that on long-term timescales the X-ray colors are positively correlated with the count rate: the higher the count rate, the harder the spectrum. A similar spectral behavior is found in most of the individual flares, with a noticeable exception in July 1997.
-
•
Other important findings from the temporal analysis are obtained by applying the fractional variability analysis to energy-selected light curves. We found that the fractional variability amplitude seems to be positively correlated with the energy band.
-
•
If the above spectral variability trends (, ), which seem to be typical for the long-term behavior of HBL objects, are confirmed also for the other blazar classes, they will provide a model-independent way to single out the jet contribution in radio-loud AGN and possibly in GBHs in the low-hard state.
-
•
Comparing the historical RXTE, HEGRA, and Whipple light curves, we find hints for correlated X-ray and TeV flux variations on long timescales (weeks to months). This confirms and extends the observed correlated variability at these two wavelengths previously observed on shorter timescales. The origin of the TeV flux is still an open question.
-
•
Individual flares show a heterogeneous behavior when the TeV flux is plotted versus the X-ray flux: Some flares show a linear TeV – X-ray correlation, and some show a non-linear correlation. Furthermore, the X/TeV flux correlation shows considerable scatter with similar X-ray (TeV) fluxes being accompanied by more than a factor of 2 different TeV (X-ray) fluxes.
References
- Aharonian et al. (1997) Aharonian, F. et al. 1997, A&A 327, L5
- Aharonian et al. (1999) Aharonian, F. et al. 1999, A&A, 349, 11
-
Aharonian et al. (2000)
Aharonian, F. A., 2000, New A, 5, 377
- Aharonian et al. (2001) Aharonian, F. et al. 2001, ApJ, 546, 898
- Aharonian et al. (2005) Aharonian, F., Akhperjanian, A.G., Aye, K.-M., et al. 2005, ApJ, 437, 95
- Blazejowski et al. (2005) Blazejowski, M., Blaylock, G., Bond, I.H., et al. 2005, ApJ, 630, 130
- Boettcher (2005) Boettcher, M. 2005, ApJ, 621, 176
- Brinkmann et al. (2000) Brinkmann, W., Gliozzi, M., Urry, C.M., Maraschi, L., & Sambruna, R., 2000, A&A, 362, 105
- Brinkmann et al. (2003) Brinkmann, W., Papadakis, I.E., den Herder, J.W., Haberl, F. 2003, A&A, 402, 929
- Catanese et al. (1997) Catanese, M. et al. 1997, ApJ, 487, L143
- Cui (2004) Cui, W. 2004, ApJ, 605, 662
-
Dar & Laor (1997)
Dar, A., Laor, A., 1997, ApJ, 478, L5
- Djannati-Atai et al. (1999) Djannati-Atai, A. et al. 1999, A&A 350, 17
- Edelson et al. (2002) Edelson, R., Turner, T.J., Pounds, K., et al., 2002, ApJ, 568, 610
- Fossati et al. (2000) Fossati, G., Celotti, A., Chiaberge, M., et al., 2000, ApJ, 541, 153
- Fossati et al. (2004) Fossati, G., Buckley, J., Edelson, R., Horns, D., Jordan, M. 2004, NewAR, 48, 419
- Gliozzi, Sambruna & Eracleous (2003) Gliozzi, M., Sambruna, R., & Eracleous, M., 2003, ApJ, 584, 176
- Haardt & Maraschi (1991) Haardt, F. & Maraschi, L. 1991, ApJ, 380, L51
- Hayashida et al. (1998) Hayashida, N. et al. 1998, ApJ 504, L71
- Helene (1983) Helene, O. Nucl. Instrum. Methods 212, 319 (1983)
- Hillas et al. (1998) Hillas, A.M., Akerlof, C.W., Biller, S.D., et al. 1998 ApJ, 503,744
- Jahoda et al. (1996) Jahoda, K., Swank, J., Giles, A.B., et al. 1996, Proc.SPIE, 2808, 59
- Kataoka et al. (2001) Kataoka, J., Takahashi, T., Wagner, S.J., et al. 2001, ApJ, 560, 659
- Katarzynski et al. (2005) Katarzyński, K., Ghisellini, G., Tavecchio, F., et al. 2005, A&A, 433, 479
- Kirk, Rieger, & Mastichiadis (1998) Kirk, J.G., Rieger., F.M., & Mastichiadis, A., 1998, A&A, 333, 452
- Krawczynski et al. (2000) Krawczynski, H. et al. 2000, A&A, 353, 97
- Krawczynski et al. (2001) Krawczynski, H., Sambruna, R.M. et al. 2001, ApJ, 559, 187
- Krawczynski et al. (2002) Krawczynski, H., Coppi, P.S., Aharonian, F., 2002, MNRAS, 336, 721
- Krawczynski et al. (2004) Krawczynski, H., Hughes, S.B., Horan, D. 2004, ApJ, 601, 151
- Lamer & Wagner (1998) Lamer G., & Wagner S.J., 1998, A&A 331, L13
- Lavalley (1992) Lavalley, M., Isobe, T., Feigelson, E.D. 1992, BAAS, 24, 839
-
Mannheim (1993)
a) Mannheim, K., 1993, A&A, 269, 67; b) 1998, Science, 279, 684
- Maraschi et al. (1999) Maraschi, L., Fossati, G., Tavecchio, F., et al. 1999, ApJ, 526, 81
- Markoff et al. (2003) Markoff, S., Nowak, M., Corbel, S., Fender, R., & Falcke, H. 2003, NewAR, 47, 491
- Markowitz & Edelson (2001) Markowitz, A., & Edelson, R. 2001, ApJ, 547, 684
-
Muecke et al. (2003)
Mücke, A., Protheroe, R. J., Engel, R., Rachen, J. P., Stanev, T., 2003, APh, 18, 593
- Papadakis et al. (2002) Papadakis, I.E., Petrucci, P.O., Maraschi, L., et al. 2002, ApJ, 573, 92
- Pian et al. (1998) Pian, E. et al. 1998, ApJ, 492, L17
-
Pohl & Schlickeiser (2000)
Pohl, M., Schlickeiser, R., 2000, A&A, 354, 395
- Punch et al. (1992) Punch, M., Akerlof, C.W., Cawley, M.F., et al. 1992, Nat, 358, 477
- Quinn et al. (1999) Quinn, J. et al. 1999, ApJ, 518, 693
- Ravasio et al. (2004) Ravasio, M., Tagliaferri, G., Ghisellini, G., & Tavecchio, F. 2004, A&A, 424, 841
- Reynolds et al. (1993) Reynolds, P.T., et al. 1993, ApJ, 404, 206
- Rodriguez-Pascual et al. (1997) Rodriguez-Pascual, P.M., Alloin, D., Clavel, J., et al. 1997, ApJS, 110, 9
- Sambruna et al. (2000) Sambruna, R.M. et al. 2000, ApJ, 538, 127
- Shih et al. (2002) Shih, D.C., Iwasawa, K., Fabian, A.C. 2002, MNRAS, 333, 687
- Tanihata et al. (2000) Tanihata, C. et al. 2000, ApJ, 543, 124
- Tanihata et al. (2001) Tanihata, C. et al. 2001, ApJ, 563, 569
- Tavecchio et al. (2001) Tavecchio, F. et al. 2001, ApJ, 554, 725
- Ulrich, Maraschi & Urry (1997) Ulrich, M.-H., Maraschi, L., & Urry, C.M. 1997, ARAA, 35, 445
- Urry & Padovani (1995) Urry, C.M. & Padovani, P. 1995, PASP, 107, 803
- Urry et al. (1996) Urry, C.M. et al. 1996, ApJ, 463, 424
- (53) Uttley, P., McHardy, I.M., & Vaughan, S. 2005, MNRAS, 359, 345
- Vaughan et al. (2003) Vaughan, S., Edelson, R., Warwick, R.S., & Uttley, P. 2003, MNRAS, 345, 1271
- Weekes (1996) Weekes, T.C. 1996 , SSR, 75,1
- Xue & Cui (2005) Xue, Y. & Cui, W. 2005, ApJ, 622, 160
- Zdziarski et al. (2004) Zdziarski, A.A., Gierliǹski, M., MikoÅ?ajewska, J., et al. 2004, MNRAS, 351, 791
- Zhang et al. (1999) Zhang, Y.H. et al. 1999, ApJ, 527, 719
- Zhang et al. (2005) Zhang, Y.H., Treves, A., Celotti, A., Qin, Y.P., & Bai, J.M. 2005, ApJ, 629, 686
| Long-term | ||||||||||
| 1997 | 0.56 | () | 0.71 | ( | 0.015() | |||||
| 1998 | 0.31 | () | 0.24 | ( | 0.020() | |||||
| 2000 | 0.45 | () | 0.34 | ( | 0.134() | |||||
| Flare | ||||||||||
| Apr 97 | 0.96 | () | 0.87 | ( | ||||||
| Jul 97 | -0.45 | () | -0.71 | ( | ||||||
| May 98 | 0.57 | () | 0.43 | ( | ||||||
| Jun 98 | 0.64 | () | 0.49 | ( | ||||||
| May 99 | 0.41 | () | 0.30 | ( | ||||||
| Jun 04 | 0.36 | () | 0.25 | ( |
a Best fit value and 1 error of the slope (with ) obtained from a least square fit.
| Long-term | |||||||
| 1997b | 0.99 | () | 0.96 | ( | |||
| 1997 | 1.00 | () | 1.00 | ( | |||
| 1998 | 1.00 | () | 1.00 | ( | |||
| 2000 | 1.00 | () | 1.00 | ( | |||
| Flare | |||||||
| Apr 97 | 1.00 | () | 1.00 | ( | |||
| Jul 97 | -1.00 | () | -1.00 | ( | |||
| May 98 | 1.00 | () | 1.00 | ( | |||
| Jun 98 | 1.00 | () | 1.00 | ( | |||
| May 99 | 0.50 | () | 0.33 | ( | |||
| Jun 04 | -0.50 | () | -0.33 | ( |
a Best fit value and 1 error of the slope
(with ) obtained from a least square fit.
b Results obtained using ten narrower energy bands instead of three.


Appendix A Time-averaged spectral analysis
Since the data consist of short snapshots spanning a long temporal baseline, showing the presence of pronounced temporal and spectral variability, a time-averaged spectral analysis might not be the most appropriate tool for probe the physical properties of Mrk 501. Nonetheless, useful constraints on physical models can be inferred from the spectral analysis. The main results from the spectral analysis of the 1998–2000 RXTE campaigns are summarized below (the results of the 1997 campaigns have been already discussed at length in previous works).
The 1998 Campaign
The time-averaged X-ray spectrum for the 1998 data is best fitted by a broken power-law
model with Galactic absorption and photon indices
and , with a break energy of .
The corresponding 2–10 keV flux is F erg cm-2 s-1.
The HEXTE spectrum in the range of 20–60 keV can be described by a power-law model with
.
Spectral fits performed on the individual observations with a single power law show
that the photon index ranges between and , with steeper values
generally corresponding to lower fluxes. However, when the photon indices are plotted
against the flux, a large scattering is found.
The 1999 Campaign
The average PCA X-ray spectrum for the 1999 data can be well described by a power-law fit with parameter values of .
The average HEXTE spectrum for the 1999 data is poorly constrained, but consistent
within the errors with the PCA spectrum: .
The 2000 Campaign
The PCA spectra of each individual observation was fitted with either a power law or broken power law absorbed by Galactic NH=1.7e+20.
A broken power-law model
provides a significantly better fit in 40% of the spectra, according to an F-test.
This model always yields a concave continuum, with ,
and break energy around 9–10 keV.
For a single power-law model fits, spectral changes up to are present
for modest (20%) flux changes, with an erratic behavior.
The time-averaged PCA spectrum was fit with a power-law model from 2–20 keV,
yielding a photon index of =. This value is consistent
within the errors with the one obtained from the time-averaged HEXTE spectrum (20–60 keV),
=.
Appendix B The “anomalous” event in July 1997
Since the event in July 1997 is the only occasion where Mrk 501 clearly shows an anti-correlation in the and plots, we have decided to carry out additional temporal and spectral analyses using smaller time-bins.
Fig. 10 shows the 2–20 keV PCA light curve of Mrk 501
during July 1997 with tbin=240s. The source was monitored for 5 consecutive days
with two pointings per day. With the exception of the first observation on July 12
where only short pointings ( s) were performed, all the other observations
are characterized by a short exposure followed by a relatively long ( s) exposure.
We will focus our analysis on these longer
pointings, since they allow a more detailed study of the temporal and spectral properties.
The first important feature to notice in Fig. 10 is the presence of several sub-flares
on timescales of few hundreds of seconds. This is better illustrated by the first column
of Fig. 11, which reveals strong variability on short timescales during July 13 and 16
and weaker amplitude variations on July 14 and 15.
The second and third columns represent the and plots, respectively.
The main findings of this model-independent analysis can be summarized as follows:
1) When significant variability is observed (July 13 and 16), the spectral and
temporal variability follow the general trend, which is observed on longer timescales and
on most of the flares, with the source spectrum that hardens as the source brightens, and
the amplitude of variability progressively increasing from the softest energy band to the
hardest one.
2) When no significant X-ray variability is observed (July 14 and 15), the spectral variability
is less pronounced with a weak positive correlation in the plot and no correlation
at all in the plane. Note that, when the light curves are nearly constant,
the variability is dominated by statistical uncertainties hampering the determination
of . This explains the presence of two data-points only in the
plots during July 14 and 15.
Importantly, the “anomalous” variability trend (as shown in Fig. 5e) is never observed in any of the individual exposures. The fact that in each individual observation (even during the short pointings studied using time-bin=100s, and not shown in Fig. 11) is never larger than suggests that the inverse correlation found considering the entire interval 12–16 July 1997 is probably an artifact, due to the combination of several heterogeneous sub-flares poorly sampled.
Also the hardness ratio versus the count rate shows a positive (or, at the very least, constant) trend during each individual observation (see the second column panels of Fig. 11). However, on longer timescales (i.e., combining the individual observations) an opposite negative trend is found. To investigate this issue in greater detail, we have carried out a time-resolved spectral analysis on the longest individual pointings. All the spectra are well fitted by a broken power law absorbed by Galactic absorption. Interestingly, while the spectra on July 13, 14, and 15 share the same spectral parameters within the errors, on July 16, when the source was at its brightest level, a significant () steepening of the hard photon index is observed. These results are summarized in Table 3, where the errors quoted are the 90% confidence levels.


| Date | Exp.[s] | rate [c/s] | [keV] | norm | ||
|---|---|---|---|---|---|---|
| 07/13/97 | 2688 | |||||
| 07/14/97 | 2848 | |||||
| 07/15/97 | 3120 | |||||
| 07/16/97 | 3264 |