Structures in the Great Attractor Region
Abstract
To further our understanding of the Great Attractor (GA), we have undertaken a redshift survey using the 2dF on the AAT. Clusters and filaments in the GA region were targeted with 25 separate pointings resulting in approximately 2600 new redshifts. Targets included poorly studied X-ray clusters from the CIZA catalogue as well as the Cen-Crux and PKS 1343-601 clusters, both of which lie close to the classic GA centre. For nine clusters in the region, we report velocity distributions as well as virial and projected mass estimates. The virial mass of CIZA J1324.7–5736, now identified as a separate structure from the Cen-Crux cluster, is found to be 3 1014 M☉, in good agreement with the X-ray inferred mass. In the PKS 1343-601 field, five redshifts are measured of which four are new. An analysis of redshifts from this survey, in combination with those from the literature, reveals the dominant structure in the GA region to be a large filament, which appears to extend from Abell S0639 (l = 281∘, b = +11∘) to (l 5∘, b –50∘), encompassing the Cen-Crux, CIZA J1324.7–5736, Norma and Pavo II clusters. Behind the Norma Cluster at cz 15000 km s-1, the masses of four rich clusters are calculated. These clusters (Triangulum-Australis, Ara, CIZA J1514.6–4558 and CIZA J1410.4–4246) may contribute to a continued large-scale flow beyond the GA. The results of these observations will be incorporated into a subsequent analysis of the GA flow.
keywords:
galaxies: clusters: general – galaxies: distances and redshifts – large-scale structure of Universe1 Introduction
Peculiar velocities are vital probes of the large scale mass distribution in the local Universe that do not rely on the assumption that light traces mass. Early work by Lynden-Bell et al. (1988) made the unexpected discovery of a 600 km s-1 outflow towards Centaurus. This led to the idea of a large, extended mass overdensity, nicknamed the Great Attractor (GA), dominating the dynamics of the local Universe. Whilst many studies have confirmed the presence of the GA (e.g. Aaronson et al., 1989), the precise mass, position and extent of the overdensity remain uncertain. Lynden-Bell et al. (1988) originally located the GA at (l, b, cz) (307∘, +9∘, 4350 350 km s-1) with a mass of 5.4 1016 M☉. However a subsequent study by Kolatt, Dekel & Lahav (1995) placed the GA peak at (320∘, 0∘, 4000 km s-1), whilst Tonry et al. (2000) favoured an even closer locale at (289∘, +22∘, 3200 260 km s-1) and a mass approximately six times smaller (8 1015 M☉). As the GA lies in the Zone of Avoidance (ZoA), foreground extinction and high stellar contamination have hampered studies of the underlying galaxy distribution. Recently, however, several key results have emerged.
The Norma cluster (Abell 3627), located at (325∘, –7∘, 4848 km s-1), is now recognised to be comparable in mass, richness and size to the Coma cluster (Kraan-Korteweg et al., 1996). Lying 9∘ from the Kolatt et al. (1995) location of the GA, the cluster has been identified as a likely candidate for the ‘core’ of the overdensity (Woudt, 1998). Furthermore, it has been suggested that the GA is a ‘Great Wall’ like structure that extends from low galactic latitudes, encompassing the Pavo II (332∘, –24∘, 4200 km s-1, Lucey & Carter, 1988) and Norma clusters before bending over and continuing towards l 290∘ (Kraan-Korteweg & Woudt, 1994; Woudt et al., 1997, 2004). This connection has been labelled the Norma supercluster (Fairall et al., 1998) and constitutes the major structure in the GA region (defined here as 280∘ l 360∘, –45∘ b +30∘, 3000 cz 7000 km s-1).
The richness of such connective structures in the region have been highlighted by recent blind HI surveys in the southern sky (Kraan-Korteweg et al. 2005b; Koribalski 2005; Henning et al. 2005). Because the ZoA is effectively transparent to 21 cm radiation, these surveys are able to trace the full extent of the local large-scale filaments as they pass through the plane. Notably, between galactic latitudes of –5∘ and +5∘, Henning et al. (2005) find evidence for an extension of the Norma supercluster at cz 5000 km s-1, running from b = 300∘ to 340∘.
The X-ray selected ‘Clusters In the Zone of Avoidance’ (CIZA) project has revealed several new X-ray clusters at low galactic latitudes (Ebeling, Mullis & Tully 2002; Kocevski et al. 2005). In the GA region, this survey has identified CIZA J1324.7–5736 as another potentially sizeable contributor to the GA’s mass. Lying at (307∘, +5∘, 5700 km s-1) this cluster has been associated with the overdensity previously identified as the Cen-Crux cluster (Woudt, 1998). X-ray measurements suggest that the structure is comparable in mass to the Norma cluster (Mullis et al., 2005).
Another important cluster in the GA region may exist around PKS 1343-601, an extremely strong radio source lying in the ZoA (Kraan-Korteweg & Woudt, 1999). The host galaxy is a large E0 (Laustsen, Schuster & West, 1977; West & Tarenghi, 1989) located at (310∘, +2∘, 3900 km s-1). Despite the lack of an associated X-ray source (Ebeling et al., 2002), recent near-infrared surveys are consistent with the presence of an intermediate mass cluster centred on the radio source (Kraan-Korteweg et al. 2005a; Schröder et al. 2005; Nagayama et al. 2004).
Attempts to analyse the extent and mass of the GA from peculiar velocity measurements have remained inconclusive. To date, no clear sign of any backside infall has been detected (Mathewson, Ford & Buchhorn, 1992; Hudson, 1994). This has been attributed to a continuing high amplitude flow, possibly due to the gravitational pull of the Shapley supercluster (SSC, Scaramella et al., 1989; Raychaudhury, 1989; Branchini et al., 1999; Hudson et al., 2004). Centred on Abell 3558 (312∘, 31∘, 14500 km s-1), the SSC is an extremely rich concentration of galaxies. Dynamical analysis by Reisenegger et al. (2000) of the collapsing core of the SSC, indicates that the mass contained within the central 8 h-1 Mpc is between 2 1015 and 1.3 1016 M☉. However different estimates of the SSC’s mass, derived from various surveys of the region, vary significantly due to differing assessments of the extent and geometry of the structure (see Bardelli et al., 2000). Furthermore, recent analysis suggests that intercluster galaxies may compose up to two thirds of the SSC’s mass, thus severely biasing previous estimates based solely on summed cluster masses (Proust et al., 2005). Accounting for all the galaxies in their 285 deg2 survey of the SSC, Proust et al. (2005) estimate an enclosed mass of 5 1016 M☉.
This uncertainty in the relative masses of the GA and the SSC has led to much dispute over the predicted source of the bulk flow observed in the local Universe and hence the source of the Local Group’s (LG) own motion. Ettori et al. (1997) and Rowan-Robinson et al. (2000) estimated that the SSC was only responsible for approximately 5 per cent of the LG’s motion. However, Bardelli et al. (2000) placed the contribution closer to 15 per cent whilst others have advocated values of up to 50 per cent (e.g Smith et al. 2000; Lucey, Radburn-Smith & Hudson 2005; Kocevski et al. 2005).
In order to further understand the nature of the GA, and hence the role it plays in the LG’s motion, we have undertaken a redshift survey with the Two-degree Field multi-fibre spectrograph (2dF). Targets include five of the CIZA clusters (including the Cen-Crux cluster), the PKS 1343–601 region and over-densities located along the proposed filamentary structures. We describe these observations and present the redshift measurements in Section 2 where we also discuss errors and completeness. Analysis of the identified structures are presented in Section 3 and in Section 4 we summarise our findings.
| Field No. | Target | l | b | Exposure length (s) | UT Date | No. Redshifts |
|---|---|---|---|---|---|---|
| 1 | Cen-Crux/CIZA J1324.7–5736 – 1 | 307.4 | 4.9 | 3 900 | 2004 Feb 29 | 46 |
| 2 | Cen-Crux/CIZA J1324.7–5736 – 2 | 305.4 | 5.1 | 3 900 | 2004 Feb 29 | 51 |
| 3 | Cen-Crux/CIZA J1324.7–5736 – 3 | 305.1 | 7.1 | 3 900 | 2004 Feb 29 | 40 |
| 4 | Cen-Crux/CIZA J1324.7–5736 – 4 | 304.6 | 9.4 | 3 900 | 2005 Jun 9 | 87 |
| 5 | PKS 1343-601 | 309.7 | 2.3 | 7 900 | 2004 Feb 29 | 5 |
| 6 | Abell S0639 | 281.3 | 10.7 | 3 1200 | 2004 Feb 29 | 174 |
| 7 | Triangulum-Australis/CIZA J1638.2–6420 | 324.7 | –11.7 | 3 900 | 2005 Jun 8 | 252 |
| 8 | Ara/CIZA J1653.0–5943 | 329.2 | –9.8 | 3 900 | 2005 Jun 8 | 179 |
| 9 | Cluster 1 | 314.3 | 13.9 | 3 900 | 2005 Jun 8 | 225 |
| 10 | CIZA J1514.6–4558 | 327.3 | 10.2 | 3 1200 | 2005 Jun 7 | 226 |
| 11 | CIZA J1410.4–4246 | 317.9 | 17.8 | 3 900 | 2005 Jun 8 | 182 |
| 12 | Filament 1 | 296.3 | 9.1 | 4 900 & 1 712 | 2005 Jun 8 | 135 |
| 13 | Hydra-Antlia Extension 1 | 281.8 | –6.2 | 3 900 | 2005 Jun 9 | 91 |
| 14 | Hydra-Antlia Extension 2 | 280.6 | –7.8 | 3 900 | 2005 Jun 9 | 126 |
| 15 | Filament 2 | 300.4 | 9.0 | 3 900 | 2005 Jun 9 | 83 |
| 16 | Filament 3 | 299.8 | 6.9 | 3 900 | 2005 Jun 9 | 50 |
| 17 | Filament 4 | 312.5 | 5.0 | 4 900 | 2005 Jun 8 | 60 |
| 18 | Filament 5 | 316.6 | 8.1 | 3 900 | 2005 Jun 9 | 70 |
| 19 | Filament 6 | 312.9 | 9.0 | 3 900 | 2005 Jun 9 | 101 |
| 20 | Filament 7 | 312.6 | 12.4 | 3 900 | 2005 Jun 8 | 111 |
| 21 | Filament 8 | 351.0 | –22.6 | 3 900 | 2005 Jun 8 | 146 |
| 22 | Filament 9 | 355.3 | –33.0 | 2 900 | 2005 Jun 8 | 175 |
| 23 | Filament 10/RXC J1840.6-7709 | 317.7 | –25.5 | 3 900 | 2005 Jun 9 | 156 |
| 24 | Filament 11/CIZA J1407.8–5100 | 315.0 | 10.2 | 3 900 | 2005 Jun 9 | 91 |
| 25 | Cluster 2 | 322.3 | 13.6 | 3 900 | 2005 Jun 9 | 155 |
| 26 | Ara/CIZA J1653.0–5943 – repeat | 329.2 | –9.8 | 4 900 | 2005 Jun 9 | 169 |
2 Observations and data reduction
Observations were carried out in two runs on the 3.9m Anglo-Australian Telescope (AAT). The 2dF was configured using the same set up as that used for the 2dF Galaxy Redshift Survey (2dFGRS Colless et al., 2001). This included using the 300B gratings with the 1024 1024 24 m pixels on the Tektronix CCDs, resulting in a dispersion of 178.8 Å mm-1 or 4.3 Å pixel-1. At the centre of the chip, the FWHM of the focus is about 2 pixels, hence the typical spectral resolution is 9 Å. Additionally, a central wavelength of 5800 Å was chosen to cover a range of about 3650–8050 Å. Seeing over the course of the two runs was 1–1.5 arcsec.
In total, we observed 25 separate fields as listed in Table 1. A repeat observation of one field was also taken in order to assess systematics. Field centres were chosen to maximise the number of targeted galaxies, whilst fully encompassing known clusters and noticeable overdensities. Target galaxies were taken from the Two Micron All Sky Survey Extended Source Catalogue (2MASS XSC, Jarrett et al., 2000) and the NASA Extragalactic Database (NED). Additional targets in the Cen-Crux and PKS 1343–601 fields were identified using J, H and Ks observations taken with the 1.4 m InfraRed Survey Facility (IRSF, Nagayama et al., 2004; Nagayama et al., 2005) and I-band images from the Wide Field imager (WFI) at the ESO 2.2m telescope at La Silla (Kraan-Korteweg et al. 2005a). Suitable guide stars were selected from the Tycho 2 catalogue (Høg et al., 2000). 2MASS positions were used for both targets and guide stars, with counterparts identified from the 2MASS Point Source Catalogue (Cutri et al., 2003) for sources with no equivalent 2MASS XSC position.
After acquiring each target field, a flat field and an arc exposure, using copper-argon and copper-helium lamps, were taken for fibre identification and wavelength calibration. Three 900 s exposures of the fields yielded signal to noise ratios of 15–30. However, seven 900 s exposures of targets in the PKS 1343–601 field achieved an average S/N ratio of only 5 due to high galactic extinction (AB 10).
The data was reduced using the 2dfdr automatic data reduction program as described in Colless et al. (2001). The default settings were used with the exception of the use of sky flux methods for fibre throughput calibration, as no off-sky measurements were taken. Once reduced, redshifts were measured using the runz program developed for the 2dFGRS (also described in Colless et al., 2001). This program uses the Tonry & Davis (1979) technique to cross correlate nine templates with the observed spectra in order to obtain the best absorption redshift. Where available, the program also determines emission redshifts by matching O ii, H, O iii, H, N ii and S ii features.
2.1 Redshifts
A total of 3053 redshifts were measured, 2603 of which are not listed in NED (as of 2006 February 15). Table 2 lists a representative sample of the complete table which can be found online111The full table will be published online in the electronic edition of this journal and on the CDS.
| Name | JExt | czab | czem |
|---|---|---|---|
| Field: 1 (RA:201.17∘ Dec:-57.68∘ l:307.78∘ b:4.90∘) | |||
| 2MASX J13184671-5804502 | 13.00 | 14774 | |
| 2MASX J13190643-5744311 | 12.38 | 5552 | 5507 |
| 2MASX J13200919-5725561 | 12.15 | 4578 | |
| 2MASX J13203723-5752421 | 11.57 | 5469 | |
| 2MASX J13211580-5827564 | 12.71 | 6155 | |
| 2MASX J13212199-5718084 | 14.11 | 6949 | 6835 |
| 2MASX J13220594-5728001 | 12.15 | 5706 | |
| 2MASX J13230235-5732041 | 12.15 | 5204 | |
| 2MASX J13230489-5740301 | 12.38 | 5841 | 5798 |
| 2MASX J13231390-5709190 | 12.28 | 5763 | |
| 2MASX J13232993-5744020 | 13.22 | 6068 | |
| NNSW71:J13233545-5747205 | 32701 | ||
| 2MASX J13233881-5807500 | 12.19 | 5444 | |
| 2MASX J13234325-5731460 | 13.20 | 6433 | |
| 2MASX J13234503-5742550 | 12.65 | 4426 | |
| 2MASX J13235263-5723200 | 12.29 | 5967 | 5870 |
| … | … | … | |
Emission line redshifts are reported for approximately 32 per cent of the sample, whilst absorption line based cross correlation redshifts are available for 96 per cent. For the 27 per cent identified through both absorption and emission features, the absorption redshift is found to be larger on average by 58 km s-1. This difference, which is usually attributed to gas outflows, is consistent with offsets found in other galaxy surveys (e.g. Cappi et al., 1998).
In order to assess the combined reliability of the observations and data reduction, a repeat observation of one field (Ara/CIZA J1653.0–5943) was made. The difference between these measurements (shown in the top panel of Fig. 1) implies an rms uncertainty on a single measurement of 81 km s-1.

The lower panel of Fig. 1 shows the residual differences between our data and those from ZCAT (Huchra et al., 1992, , 2005 November 27 edition). Coincident galaxies between the catalogues were found through name matching and searching for separations of less than 4 arcsec. For the resulting 433 galaxies, a negligible offset of only +2 km s-1 is found. A value of 1 is achieved by adopting an uncertainty of 89 km s-1 on our values and using the quoted ZCAT errors, which in the absence of multiple measurements are taken directly from the original source. At cz 6500 km s-1, the comparison exhibits an excess of negative values (i.e. ZCAT values significantly lower than the redshifts reported here). This can be attributed to the inclusion in ZCAT of redshifts for galaxies in Abell S0639 as measured by Stein (1996). These measurements are offset from the rest of the ZCAT catalogue by –140 km s-1, causing the enhancement around this value in the residual histogram that represents comparisons within 10000 km s-1.
Comparison of the 221 galaxies in common with the 6dF Galaxy Survey (6dfGS 2DR, Jones et al., 2005) indicates an error of 94 km s-1 with a mean offset of +3 km s-1. Whilst analysis of the 96 galaxies also observed by Woudt et al. (2004) yields an 89 km s-1 uncertainty and +19 km s-1 offset. Hence, as with the 2DFGRS (Colless et al., 2001), we adopt an underlying random error of 85 km s-1 on all our measurements.

The completeness of the observed 2MASS galaxies as a function of the extrapolated J-band magnitude is shown in Fig. 2. The vast majority of targeted galaxies lie in the range 12 JExt 16 mag. Typically 10 per cent of these yield no reliable redshift due to dominant stellar contamination. Hence this survey has good completeness to J = 13 mag, after which a steady decline is observed down to an effective completeness of 60 per cent for the faintest galaxies at J 16 mag. To illustrate the depth of the survey we calculate the characteristic magnitude at the distance of the GA and the SSC. By fitting a Schechter function to the combined 2dFGRS/2MASS infrared catalogue, Cole et al. (2001) find a magnitude corresponding to the characteristic luminosity L⋆ of . Using this value we find an apparent magnitude of J 11 mag at the GA (cz 4500 km s-1) and 13.5 mag at the SSC (cz 14500 km s-1). Around the Norma cluster and the SSC, extinction is typically AJ 0.17 and 0.05 mag respectively.

3 Large-Scale Structures in the GA/SSC direction
The redshift distribution for each of the surveyed fields is shown in Fig. 3. Immediately obvious are the large over-densities in fields 1,2 & 6–11 corresponding to the targeted clusters. The structures in which these clusters are embedded are also apparent in many of the fields as features at redshifts of around 2000–6000 km s-1 and 15000 km s-1, corresponding to the GA and SSC respectively.
3.1 Review of large scale structures
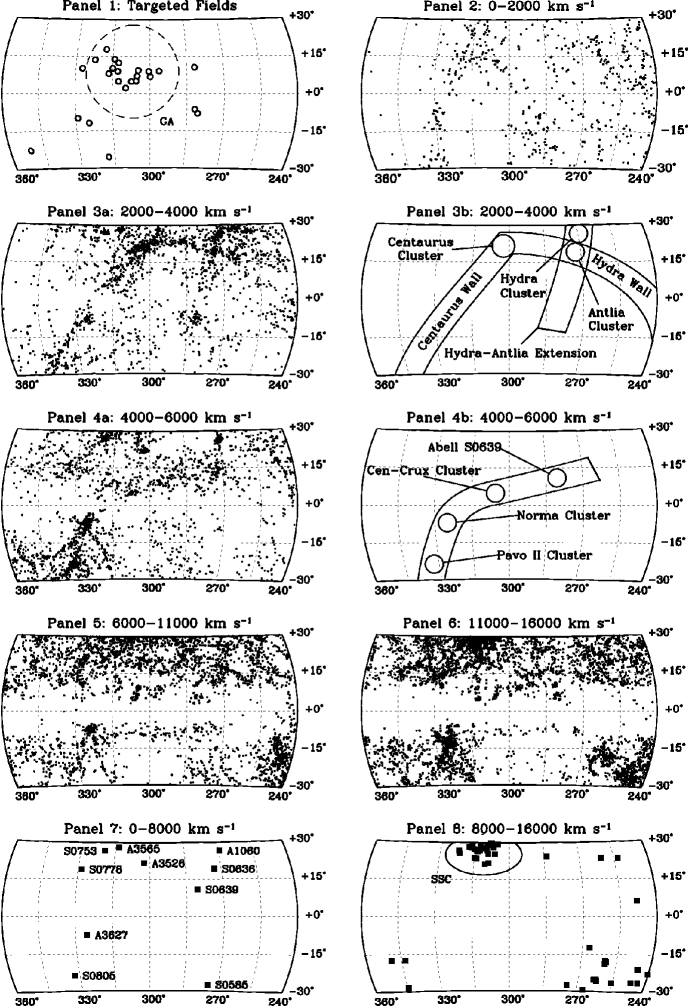
The number of redshifts known in the GA and SSC region have greatly increased with the recent completion of surveys such as FLASH (Kaldare et al., 2003), 6dFGS, the SSC study of Proust et al. (2005) and the ‘extragalactic large-scale structures behind the southern Milky Way’ project (Kraan-Korteweg & Woudt 1994; Fairall, Woudt & Kraan-Korteweg 1998; Woudt, Kraan-Korteweg & Fairall 1999; Woudt et al. 2004). Together with our measurements, we use these recent surveys to assess the large-scale structures traced by the galaxies in this important region. Fig. 4 plots the combined projected distribution of the redshifts. The first panel identifies the 2dF fields observed by this survey. The majority of fields lie in regions outside the 6dFGS survey limit (i.e. b∘) and predominantly near 2MASS over-densities close to the classic GA centre. Abell clusters are identified in the last two panels. whilst the remaining panels present the data in successive redshift slices, which contain the following relevant structures:
cz 2000 km s-1: In this panel, a line of galaxies crossing the Galactic plane at l = 280∘ and extending to the centre of the Virgo Cluster (off the panel at l = 280∘, b = +74∘) is clearly seen. These belong to the Virgo Supercluster, which encircles the entire sky and defines the Supergalactic Plane. The smaller Fornax Wall is also seen here face-on (Fairall, 1998). It appears as a filament of galaxies running from the Fornax cluster (237∘, –54∘) and crossing the Galactic plane at l = 295∘. The extension of these filaments through the ZoA is traced by the HI galaxies from surveys based on the HI Parkes All-Sky Survey (HIPASS, Barnes et al., 2001), most notably the HIPASS Bright Galaxy Catalogue (Koribalski et al., 2004) and the deep HIPASS catalogue (HICAT, Meyer et al., 2004).
2000 cz 4000 km s-1: Immediately apparent in the third panel, is the Centaurus cluster (Abell 3526) lying at (302∘, +22∘). Extending down from this cluster and through the galactic plane is the Centaurus Wall. This wall crosses a large part of the southern sky and is one of the most prominent features in all-sky maps of galaxies within 6000 km s-1 (Fairall, 1998). As we lie close to the plane of the Centaurus Wall, the structure is seen edge-on (Fairall, 1998).
Almost perpendicular to the Centaurus Wall is the Hydra Wall (Fairall, 1998). This is seen here as a filament of galaxies reaching out from the Centaurus cluster, through the Hydra (270∘, +27∘) and Antlia (273∘, +19∘) clusters before heading on to the Puppis cluster (240∘, 0∘, Lahav et al., 1993) and down towards (210∘, –30∘).
The Hydra-Antlia extension (Kraan-Korteweg & Woudt, 1994) forms a third filamentary structure in this slice. From the Hydra cluster, this feature passes through the Antlia cluster, crosses the Galactic plane at b =278∘ and ends in a group of galaxies at (280∘, –8∘). Kraan-Korteweg & Woudt (1994) suggested that an overdensity of galaxies, named the Vela overdensity and located at (280∘, +6∘), formed part of the Hydra-Antlia extension. However subsequent observations of this group have revealed that it lies significantly behind the extension at cz = 6000 km s-1 (Kraan-Korteweg et al., 1995).
| Cluster Name | MVirial | MProjected | W | N | p | ||||
| km s-1 | km s-1 | h-1 M⊙ | h-1 M⊙ | ||||||
| CIZA J1324.7–5736 | 5570 | 92 | 618 | 72 | (3.5 1.0) 1014 | (3.9 0.7) 1014 | 0.9555 | 40 | 0.1176 |
| Abell S0639A | 6501 | 61 | 405 | 40 | (1.2 0.3) 1014 | (1.7 0.4) 1014 | 0.983 | 40 | 0.7987 |
| Abell S0639B | 14125 | 66 | 412 | 39 | (3.6 0.8) 1014 | (5.3 0.6) 1014 | 0.951 | 41 | 0.0648 |
| Triangulum Australis | 15060 | 97 | 1408 | 67 | (5.7 0.6) 1015 | (6.9 0.5) 1015 | 0.9855 | 220 | 0.0242 |
| (corrected) | 14898 | 90 | 1246 | 59 | (4.4 0.4) 1015 | (5.4 0.4) 1015 | 0.9919 | 210 | 0.2945 |
| Ara | 14634 | 76 | 881 | 48 | (2.0 0.3) 1015 | (2.6 0.2) 1015 | 0.9840 | 147 | 0.0850 |
| CIZA J1514.6–4558 | 16715 | 50 | 601 | 35 | (1.2 0.1) 1015 | (1.5 0.1) 1015 | 0.9953 | 149 | 0.9145 |
| CIZA J1410.4–4246A | 15574 | 63 | 497 | 40 | (5.2 0.9) 1014 | (6.2 0.8) 1014 | 0.9761 | 66 | 0.2328 |
| CIZA J1410.4–4246B | 20463 | 53 | 345 | 37 | (5.3 1.3) 1014 | (7.5 0.8) 1014 | 0.9569 | 45 | 0.0922 |
| Cluster 1 (Field 9) | 21445 | 78 | 925 | 52 | (3.1 0.3) 1015 | (3.8 0.3) 1015 | 0.9851 | 151 | 0.1023 |
| Cluster 2 (Field 25) | - | - | - | - | 0.9685 | 85 | 0.0354 | ||
4000 cz 6000 km s-1: The fourth panel reveals the massive Norma cluster of galaxies lying at (325∘, –7∘). Below this and connected by a trail of galaxies is the Pavo II cluster (Abell S0805, l = 332∘, b = –24∘). Additionally, two smaller filaments of galaxies are seen extending down from the Norma cluster to both lower and higher galactic longitudes.
A less pronounced linear feature is also observed in this panel. Continuing from the connection between the Pavo II and Norma clusters, the structure extends across the Galactic plane and on through CIZA J1324.7–5736 (307∘, +5∘) and the Cen-Crux (305∘, +5∘) cluster before ending at Abell S0639 (281∘, +11∘). Collectively, this structure is known as the ‘Norma supercluster’ (Woudt et al., 1997) and is discussed further in Section 3.3.
6000 cz 11000 km s-1: The Norma cluster ‘finger of God’ is still evident in this panel. The linear feature at b = –10∘ that extends from this overdensity towards lower galactic latitudes, is an artificial enhancement due to the survey limit (b –10∘) of the combined southern Milky Way survey (Kraan-Korteweg et al., 1995; Fairall et al., 1998; Woudt et al., 1999). The Vela overdensity and continuation of the Cen-Crux structure are both seen as distinct groups at (305∘, +6∘) and (280∘, +6∘) respectively. Also present is the Ophiuchus cluster (Hasegawa et al., 2000; Wakamatsu et al., 2005) lying at the edge of the panel (360∘, +9∘, 8500 km s-1).
11000 cz 16000 km s-1: In the last panel, the massive concentration of clusters that constitute the SSC becomes apparent around (314∘, +30∘). Also visible are the large Ara (329∘, –10∘) and Triangulum-Australis (325∘, –12∘) clusters (lying almost directly behind the Norma cluster), CIZA J1514.6–4558 at (327∘, +10∘) and CIZA J1410.4–4246 at (318∘, +18∘).
3.2 Clusters
Of great importance in studying the GA flow is an assessment of the relative masses of the rich clusters in the region. Notably, the CIZA survey has identified several new X-ray clusters in the GA direction. We targeted six of these sources, which together with noticeable overdensities in the 2MASS XSC, made up nine fields containing possible clusters.
To determine if these systems were indicative of relaxed clusters, their velocity dispersions, culled by an iterative 3- clipping procedure about their median, were tested for gaussianity. With no prior on the mean or standard deviation, the Shapiro-Wilk W-statistic (Shapiro & Wilk, 1965) is able to test the null hypothesis that data is indeed sampled from a normal distribution. We accept this hypothesis if the associated p-value, calculated via the analytical approach of Royston (1995), is greater than 0.05.
If the W-statistic for a sample indicates that the redshifts were taken from a normal distribution, the corresponding velocity dispersion was determined using a method that includes measurement errors on individual redshifts (Danese, de Zotti & di Tullio, 1980). Uncertainties on the derived values were calculated by bootstrap resampling.
The masses of the corresponding systems were calculated using the classical virial mass estimator, defined by Heisler et al. (1985) as
where
is the projected galaxy separation. This virial method has been shown to be a reliable first order approximation to the mass of a dynamically relaxed system which is fully contained within the observed field (e.g. see Rines et al., 2003). The projected mass estimator for each cluster was also calculated:
Errors on both mass estimates were again assigned by bootstrap resampling. With their sample of nine clusters in the CAIRNS project, Rines et al. (2003) find that the projected mass is only 1.18 0.05 times greater than the estimated virial mass. Hence, given the expected errors on the dispersions, the two estimators should be consistent.
Table 3 lists the mean redshift, velocity dispersion, mass estimate, W-statistic and associated p-value for the best fit to each of the observed clusters. These fits are plotted with the corresponding velocity histograms in Fig. 5.

3.2.1 Cen-Crux/CIZA J1324.7–5736

Multi-object spectroscopy of the GA region revealed an overdensity of galaxies at (305∘, +5∘, 6214 km s-1), which was named the Cen-Crux cluster (Woudt, 1998; Fairall et al., 1998; Woudt et al., 2004). Later, an associated X-ray cluster signature was detected by the CIZA survey at (307∘, +5∘). Preliminary analysis of the X-ray source (CIZA J1324.7–5736) suggested that it was comparable in mass to the Norma cluster (Ebeling et al., 2002).
We have observed one field centred on the X-ray source and three further fields targeting the surrounding overdensities (see Fig. 6). Of the 223 identified redshifts in the targeted fields, 110 are within 7500 km s-1. Two distinct structures are observed within these fields.
Ebeling et al. (2002) noted that the appearance of the X-ray emissions in the region and their association with the brightest cluster galaxy WKK2189 (cz = 5585 km s-1), were suggestive of a dynamically relaxed cluster. 40 of the observed galaxies are found to be associated with the X-ray source. Shown in the Field 1 histogram on the right hand side of Fig. 6, the velocity dispersion of these galaxies is 539 80 km s-1 centred on 5570 92 km s-1. The Shapiro-Wilk test on this distribution yields a p-value of 0.1176 and the estimated virial mass is (3.5 1.0) 1014 M☉. Hence the interpretation of a large relaxed cluster is supported here by the observed Gaussian velocity distribution.
Comparison with the Norma cluster velocity dispersion of 897 km s-1 (Kraan-Korteweg et al., 1996) suggests that CIZA J1324.7–5736 is approximately 0.3–0.5 times as massive. This is in agreement with the Mullis et al. (2005) comparison of XMM-Newton observations of CIZA J1324.7–5736 with the X-ray temperature of the Norma cluster inferred by Tamura et al. (1998). Using the mass-temperature scaling relations, they conclude that CIZA J1324.7–5736 contains about a third of the mass of the Norma cluster. A future study of the extinction-corrected KS-band luminosity function should provide further constraints on the relative mass (Nagayama et al., 2005).
The second distinct feature observed in the fields is that of the Cen-Crux overdensity itself. This appears as a filament like trail of galaxies separated from the X-ray source both spatially on the sky and in redshift. Although no connective structure is evident between this overdensity and CIZA J1324.7–5736, their close proximity suggest that they are gravitationally bound. As the structure is not dynamically relaxed, virial theorem does not apply. However the extent of the Cen-Crux structure and the number of galaxies contained within it implies a mass similar to that of the CIZA J1324.7–5736 cluster.
3.2.2 PKS 1343–601
PKS 1343–601 is the second brightest extragalactic radio source in the southern sky (Mills, 1952). The associated galaxy, lying at (309.7∘, +1.7∘, 3872 km s-1, West & Tarenghi, 1989), is a large elliptical galaxy (Laustsen et al., 1977; West & Tarenghi, 1989), typical of those found in cluster cores. Hence it has been suggested that PKS 1343–601 may mark the centre of another highly obscured (AB 12) cluster (Woudt, 1998; Kraan-Korteweg & Woudt, 1999).
X-ray studies have yet to reveal any indication that such a hidden cluster exists. No corresponding source is seen in the CIZA survey and the point-like X-ray emissions reported by Tashiro et al. (1998) are consistent with the radio lobes of PKS 1343–601 rather than intracluster gas (Ebeling et al., 2002). However in HIPASS observations, a small overdensity around the radio galaxy has been detected (Kraan-Korteweg et al. 2005b). The nature of this overdensity has recently been examined by three near-infrared surveys (Schröder et al. 2005; Kraan-Korteweg et al. 2005a; Nagayama et al. 2004). Through radial velocity studies, simulated sky-projections and extrapolation of luminosity functions, these surveys are all consistent with the notion of a low mass group or poor cluster centred on PKS 1343–601.
Unfortunately, of the 84 targets we identified in the 2dF field, our 6300 s observation yielded only five reliable redshifts. Of these is a reconfirmation of the redshift of PKS 1343–601. At 4065 85 km s-1, this is in agreement with the West & Tarenghi (1989) value. Of the other four new measurements, all identified through emission lines, two are located within 500 km s-1 of the radio galaxy. NWN2004 45 and NWN2004 51 are both taken from the Nagayama et al. (2004) catalogue and lie at 3861 and 3571 km s-1 respectively. These galaxies, together with those identified both optically and in HI by Schröder et al. (2005), brings the number of galaxies with known redshifts that are associated with the PKS 1343–601 group up to 20.
3.2.3 Abell S0639
The Abell S0639 cluster, which lies at (281∘, +11∘), was first studied in detail by Stein (1994, 1997), who for 32 galaxies measured a mean velocity of 6194 78 km s-1 and a velocity dispersion of 431 52 km s-1. Using a sample of 40 galaxies with a mean cz = 6501 61 km s-1, we find a similar dispersion of 409 55 km s-1. An additional feature is located in the same field, offset from Abell S0639 by 1.5∘. At 14065 69 km s-1, the structure lies at the same distance as the SSC and is not inconsistent with a normal distribution (p-value = 0.0648). The measured virial velocity dispersion is 597 91 km s-1, corresponding to a mass of (4.9 1.2) 1014 M☉.
3.2.4 Triangulum Australis, Ara, CIZA J1638.2–6420, CIZA J1514.6–4558 & CIZA J1410.4–4246
In the extended CIZA catalogue, Kocevski et al. (2005) have identified several X-ray sources located at z 0.05, which they suggest form an extension to the SSC. In Ebeling et al. (2002), the same authors argue that these clusters may be responsible for the observed continued flow towards a point behind the GA. Of these sources we have targeted the four largest: CIZA J1638.2–6420 (the Triangulum-Australis cluster) at (324.5∘, –11.6∘, 15060 km s-1), CIZA J1653.0–5943 (the Ara cluster, Woudt, 1998) at (329.3∘, –9.9∘, 14634 km s-1), CIZA J1410.4–4246 (318.0∘, 17.8∘, 15574 km s-1) and CIZA J1514.6–5736 (327.3∘, 10.0∘, 16715 km s-1). All four structures have clearly identified Gaussian velocity distributions from which we are able to infer virial and projected masses as listed in table 3. The Triangulum-Australis cluster yields a noticeably low p-value (0.0242). This is due to the overdensity seen in the right hand tail of the dispersion. Removing the 10 galaxies with cz 18000 km s-1 from the field results in a more respectable p-value of 0.2945 (listed as corrected in table 3). With a corresponding virial mass of (5.7 0.6) 1015 M☉, this large cluster is similar in mass to the Norma cluster.
Despite a p-value of 0.0850, the Ara cluster appears to display a bimodal velocity distribution. Fitting two Gaussian profiles to the data results in velocity dispersions of 498 68 km s-1 and 731 112 km s-1 centred on 14016 84 km s-1 and 15310 124 km s-1 respectively. These fits are shown in the inset to the Ara cluster panel of Fig. 5. There is no discernible separation in the projected sky distribution of the two populations, hence they may be two infalling clumps collapsing along the line of sight. A 7.5 ks ROSAT HRI observation of the cluster supports this argument, as two distinct peaks, separated by only 4 arcmin, were observed in the elongated X-ray emissions (Ebeling et al., 2002). Summed in quadrature, the two velocity dispersions are similar to the dispersion of the overall fit (881 48 km s-1); hence, even though virial theorem is not strictly applicable to such a system, the mass derived from the total fit provides a likely upper limit to the combined mass of the two clumps.
The results of the Shapiro-Wilk test for CIZA J1514.6–4558 and CIZA J1410.4–4246 indicate that they are consistent with being dynamically relaxed clusters as shown in Fig. 5. Behind CIZA J1410.4–4246 there appears a second group with a velocity dispersion consistent with a normal distribution. However with a skewness of 0.094, the mean distance and the velocity dispersion of the feature are likely overestimated.
The Triangulum-Australis and Ara clusters are physically separated by only 13.7 h-1 Mpc and lie in approximately the same plane as the CIZA J1514.6–4558 and CIZA J1410.4–4246 clusters. Abell 3558, the core of the SSC, lies only 38 Mpc from CIZA J1410.4–4246 and so these clusters may well form an extension to the SSC. Nevertheless the presence of such large masses in close proximity to each other has a sizeable influence on the X-ray based dipole (Kocevski et al., 2004). The effects of this will be studied in more detail by a subsequent paper.
3.2.5 Additional Clusters
Examination of 2MASS maps of the GA/SSC region reveals two further overdensities centred on (314.5∘, +13.7∘) and (321.7∘, +13.4∘). These were targeted in fields 9 (314.3∘, +13.9∘) and 25 (322.3∘, +13.6∘) respectively. Recently, Kocevski et al. (2005) have reported the presence of an X-ray source, identified as CIZA J1358.7–4750, at (314.5∘, +13.5∘), coincident with the structure in field 9. At cz = 21445 78 km s-1 this cluster is far enough removed to have little influence (VLG 3 km s-1) on local dynamics despite the large predicted mass ( 3 1015 M☉).
As evident in the lower right panel of Fig. 5, The galaxies between 21000 and 27000 km s-1 in field 25 are concentrated into numerous sub-clumps loosely associated in a broad distribution. The associated p-value of 0.0345 confirms that this is not consistent with a dynamically relaxed cluster and hence we do not assign it a mass.
3.3 The Extended Norma Supercluster
Several large clusters are now known to reside in the GA region, i.e. Norma, Pavo II, Centaurus, Hydra and CIZA J1324.7–5736. However the connections between these clusters are still poorly resolved. As shown in Fig. 4, the Pavo II and Norma clusters are connected by a structure, which Woudt et al. (1997) have suggested extends through the ZoA towards the Cen-Crux overdensity. This connection is highlighted by the noticeable peak around 5500 km s-1 in the combined velocity distribution of non-cluster fields shown in the bottom panel of Fig. 5. To examine this feature further, Fig. 7 and Fig. 8 plot redshift slices of the filament below and above the Galactic plane.
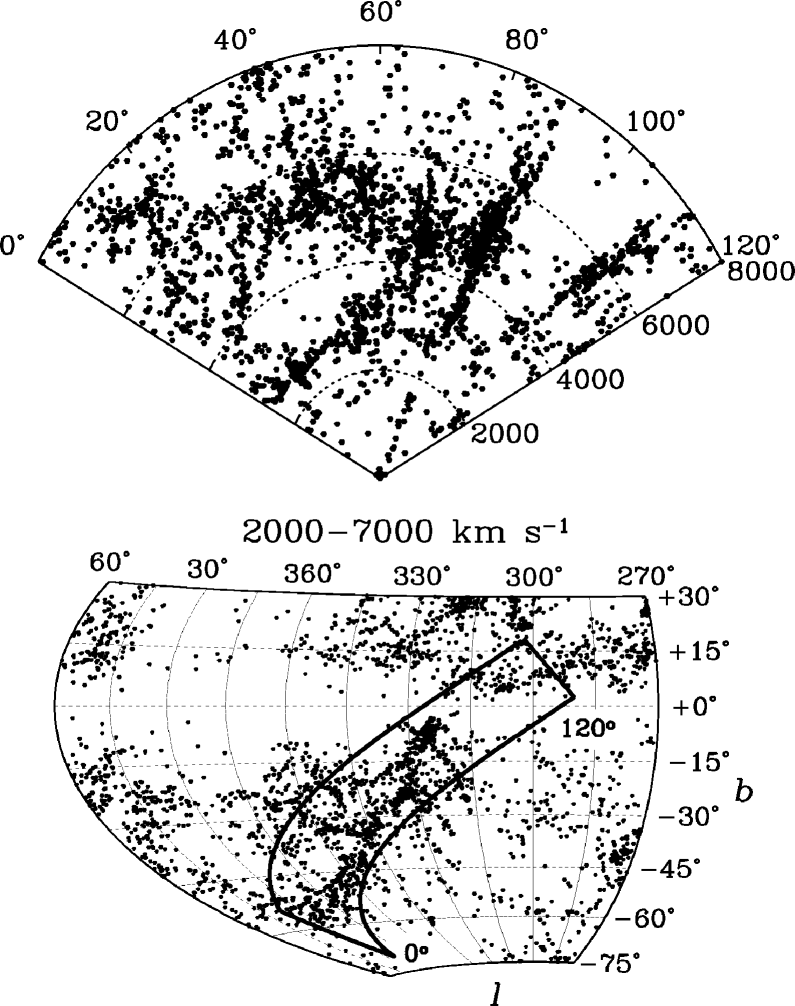
Evident in the foreground of the diagram in the upper panel of Fig. 7 is the Centaurus Wall. Appearing as a filament of galaxies running across the sky at cz 2600 km s-1, this structure is separated by some 2000 km s-1 from the Norma structure. This is in contradiction with earlier studies that have suggested the Norma cluster is a nexus between the Centaurus Wall and the Norma Supercluster (Woudt et al., 1997). The dearth of galaxies in the ZoA is clearly seen as the gap in the wall between the Norma and CIZA J1324.7–5736 clusters, which respectively appear as ‘fingers-of-God’ at 86∘ and 108∘ along the strip. However, below the ZoA, the extent of the structure is clearly evident as the broad wall of galaxies extends out from the Norma cluster, through the Pavo II cluster and on towards higher redshifts. In the Aitoff projection shown in the lower panel of Fig. 7, many additional, smaller filaments are seen branching off from the main structure, primarily at the location of the clusters. However a major branch splits off at around (345∘, –35∘, 5000 km s-1) and continues to (17∘, –22∘, 6000 km s-1). The main filament appears to disperse at (5∘, –50∘, 5000 km s-1), with apparent overdensities at greater galactic longitudes (5∘ l 30∘, –60∘ b –45∘) resulting from the projection along the line of sight of clumps, including galaxies in the Centaurus Wall.
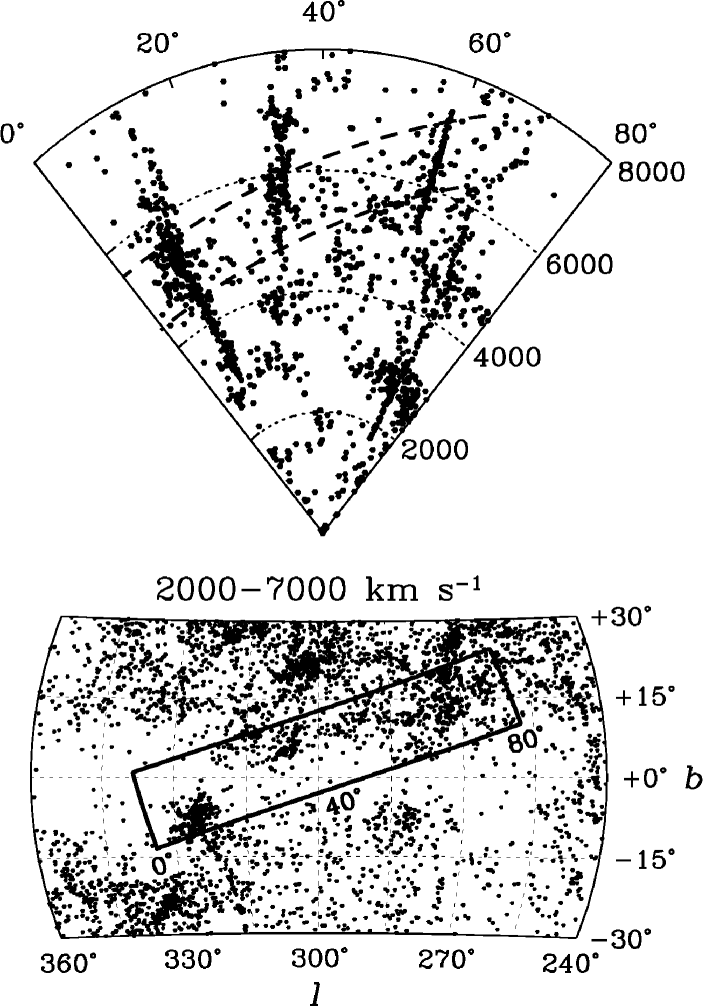
Fig. 8 shows a possible extension of the Norma supercluster filament through the plane to higher galactic latitudes. Here the progression to higher redshifts is hinted at as the filament extends from the Norma Cluster (lying 11∘ along the strip), through CIZA J1324.7–5736 (at 31∘) and the Cen-Crux feature (33∘) and on towards Abell S0639 (58∘). From this last cluster an extension towards another overdensity located off the panel at (268∘, +17∘, 9000 km s-1) may exist, but lack of redshifts makes this difficult to discern. The Vela overdensity (280∘, +6∘, 6000 km s-1) lies next to Abell S0639 and so forms a spur to the main filament. However, another intercluster connection from Abell S0639 appears to run at almost right angles to the Norma supercluster. This filament extends through the overdensity located at (272∘, +13∘, 4500 km s-1), which is likely associated with Abell S0631 and Abell S0628, both of which currently have no reported redshift, before joining the Hydra cluster. As detailed in Section 3.1, the large Hydra cluster is connected by the Hydra Wall to the Centaurus cluster and by the Hydra-Antlia extension to the Antlia cluster and galaxies at lower galactic latitudes.
Thus, from Abell S0639 to (5∘, –50∘), there appears to exist a continuous filament of galaxies stretching across approximately 100∘ (i.e. 120 Mpc) of the southern sky, with a velocity dispersion km s-1. From studies of inter-cluster filaments in simulations, Colberg, Krughoff & Connolly (2005) find a typical overdensity along these structures of 7 and cross-sectional radii of 2 Mpc. Thus, not including the associated clusters, a filament of this size, dynamically centred at (325∘, –10∘, 4800 km s-1), might contain a mass as high as 2.5 1015 M☉. This is comparable to the mass of a large cluster and so represents another potentially significant component of the GA.
4 Summary
Using the 2dF on the AAT, we have measured 3053 redshifts in the GA/SSC region, of which 2603 are new measurements. These redshifts have helped reveal the composition of the GA, principally with the resolution of the CIZA J1324.7–5736/Cen-Crux feature. The X-ray source is revealed to be a dynamically relaxed cluster with a mass approximately 0.3–0.5 times that of the Norma Cluster, in good agreement with previous estimates.
By combining the results of this survey with redshifts from the literature, the major clusters associated with the GA are found to be joined by a possibly wall-like structure. This filament extends from Abell S0639, through the ZOA, where it meets the Norma cluster, and continues down to (5∘, –50∘, 5000 km s-1). Together with the Norma, Pavo II, CIZA J1324.7–5736 and Abell S0639 clusters, we can expect these structures to contribute a mass of 1016 M☉ towards the GA.
We have also measured the masses and composition of several other clusters behind the GA, including the Triangulum-Australis, Ara, CIZA J1514.6–4558 and CIZA J1410.4–4246 clusters. These have been proposed as possible sources to a continued flow beyond the GA. The results from all these observations will be used in a subsequent paper to model the flows in this complex and important region.
5 Acknowledgements
This paper is based on research taken with the 2dF at the AAT telescope. We wish to thank all the AAO staff, in particular Scott Croom and Rob Sharp, for their help and continued support of 2dF. DJR-S thanks PPARC for a research studentship. This research has also made use of the NASA/IPAC Extragalactic Database (NED) which is operated by the Jet Propulsion Laboratory, California Institute of Technology, under contract with the National Aeronautics and Space Administration and data products from 2MASS, which is a joint project of the University of Massachusetts and the Infrared Processing and Analysis Center/California Institute of Technology, funded by the National Aeronautics and Space Administration and the National Science Foundation.
References
- Aaronson et al. (1989) Aaronson M., et al., 1989, ApJ, 338, 654
- Bardelli et al. (2000) Bardelli S., Zucca E., Zamorani G., Moscardini L., Scaramella R., 2000, MNRAS, 312, 540
- Barnes et al. (2001) Barnes D. G., et al., 2001, MNRAS, 322, 486
- Branchini et al. (1999) Branchini E., et al., 1999, MNRAS, 308, 1
- Cappi et al. (1998) Cappi A., et al., 1998, A&A, 336, 445
- Colberg et al. (2005) Colberg J. M., Krughoff K. S., Connolly A. J., 2005, MNRAS, 359, 272
- Cole et al. (2001) Cole S., et al., 2001, MNRAS, 326, 255
- Colless et al. (2001) Colless M., et al., 2001, MNRAS, 328, 1039
- Cutri et al. (2003) Cutri R. M., et al., 2003, VizieR Online Data Catalog, 2246
- Danese et al. (1980) Danese L., de Zotti G., di Tullio G., 1980, A&A, 82, 322
- Ebeling et al. (2002) Ebeling H., Mullis C. R., Tully R. B., 2002, ApJ, 580, 774
- Ettori et al. (1997) Ettori S., Fabian A. C., White D. A., 1997, MNRAS, 289, 787
- Faber & Burstein (1988) Faber S. M., Burstein D., 1988, Motions of galaxies in the neighborhood of the local group. Large-Scale Motions in the Universe: A Vatican study Week, pp 115–167
- Fairall (1998) Fairall A. P., ed. 1998
- Fairall et al. (1998) Fairall A. P., Woudt P. A., Kraan-Korteweg R. C., 1998, A&ASS, 127, 463
- Hasegawa et al. (2000) Hasegawa T., et al., 2000, MNRAS, 316, 326
- Heisler et al. (1985) Heisler J., Tremaine S., Bahcall J. N., 1985, ApJ, 298, 8
- Henning et al. (2005) Henning P. A., Kraan-Korteweg R. C., Stavely-Smith L., 2005, in ASP Conf. Ser. 329: Nearby Large-Scale Structures and the Zone of Avoidance p. 199
- Høg et al. (2000) Høg E., Fabricius C., Makarov V. V., Urban S., Corbin T., Wycoff G., Bastian U., Schwekendiek P., Wicenec A., 2000, A&A, 355, 27
- Huchra et al. (1992) Huchra J. P., Geller M. J., Clemens C. M., Tokarz S. P., Michel A., 1992, Bull. CDS, 41, 31
- Hudson (1994) Hudson M. J., 1994, MNRAS, 266, 468
- Hudson et al. (2004) Hudson M. J., Smith R. J., Lucey J. R., Branchini E., 2004, MNRAS, 352, 61
- Jarrett et al. (2000) Jarrett T. H., Chester T., Cutri R., Schneider S., Skrutskie M., Huchra J. P., 2000, AJ, 119, 2498
- Jones et al. (2005) Jones D. H., Saunders W., Read M., Colless M., 2005, PASA, 22, 277
- Kaldare et al. (2003) Kaldare R., Colless M., Raychaudhury S., Peterson B. A., 2003, MNRAS, 339, 652
- Kocevski et al. (2005) Kocevski D. D., Ebeling H., Mullis C. R., Tully R. B., 2005, ArXiv:astro-ph/0512321
- Kocevski et al. (2004) Kocevski D. D., Mullis C. R., Ebeling H., 2004, ApJ, 608, 721
- Kolatt et al. (1995) Kolatt T., Dekel A., Lahav O., 1995, MNRAS, 275, 797
- Koribalski (2005) Koribalski B. S., 2005, in ASP Conf. Ser. 329: Nearby Large-Scale Structures and the Zone of Avoidance p. 217
- Koribalski et al. (2004) Koribalski B. S., et al., 2004, AJ, 128, 16
- Kraan-Korteweg et al. (1995) Kraan-Korteweg R. C., Fairall A. P., Balkowski C., 1995, A&A, 297, 617
- Kraan-Korteweg et al. (005a) Kraan-Korteweg R. C., Ochoa M., Woudt P. A., Andernach H., 2005a, in Fairall A. P., Woudt P. A., eds, ASP Conf. Ser. Vol. 329, Nearby Large-Scale Structures and the Zone of Avoidance. Astron. Soc. Pac., San Francisco, pp 159–165
- Kraan-Korteweg et al. (005b) Kraan-Korteweg R. C., Staveley-Smith L., Donley J., Koribalski B., Henning P. A., 2005b, in Colless M., Staveley S., Stathakis R., eds, ASP Conf. Ser. Vol. 216, Maps of the Cosmos pp 203–210
- Kraan-Korteweg & Woudt (1994) Kraan-Korteweg R. C., Woudt P. A., 1994, in ASP Conf. Ser. 67: Unveiling Large-Scale Structures Behind the Milky Way p. 89
- Kraan-Korteweg & Woudt (1999) Kraan-Korteweg R. C., Woudt P. A., 1999, PASA, 16, 53
- Kraan-Korteweg et al. (1996) Kraan-Korteweg R. C., Woudt P. A., Cayatte V., Fairall A. P., Balkowski C., Henning P. A., 1996, Nat, 379, 519
- Lahav et al. (1993) Lahav O., Yamada T., Scharf C., Kraan-Korteweg R. C., 1993, MNRAS, 262, 711
- Laustsen et al. (1977) Laustsen S., Schuster H.-E., West R. M., 1977, A&A, 59, 3
- Lucey et al. (2005) Lucey J., Radburn-Smith D., Hudson M., 2005, in ASP Conf. Ser. 329: Nearby Large-Scale Structures and the Zone of Avoidance p. 21
- Lucey & Carter (1988) Lucey J. R., Carter D., 1988, MNRAS, 235, 1177
- Lynden-Bell et al. (1988) Lynden-Bell D., Faber S. M., Burstein D., Davies R. L., Dressler A., Terlevich R. J., Wegner G., 1988, ApJ, 326, 19
- Mathewson et al. (1992) Mathewson D. S., Ford V. L., Buchhorn M., 1992, ApJL, 389, 5
- Meyer et al. (2004) Meyer M. J., et al., 2004, MNRAS, 350, 1195
- Mills (1952) Mills B. Y., 1952, Australian J. Sci. Res. serie A 5, 5, 266-287 (1952), 5, 266
- Mullis et al. (2005) Mullis C. R., Ebeling H., Kocevski D. D., Tully R. B., 2005, in ASP Conf. Ser. 329: Nearby Large-Scale Structures and the Zone of Avoidance p. 183
- Nagayama et al. (2004) Nagayama T., et al., 2004, MNRAS, 354, 980
- Nagayama et al. (2005) Nagayama T., Nagata T., Sato S., Woudt P. A., Irsf/Sirius Team 2005, in ASP Conf. Ser. 329: Nearby Large-Scale Structures and the Zone of Avoidance p. 177
- Proust et al. (2005) Proust D., et al., 2005, arXiv:astro-ph/0509903
- Raychaudhury (1989) Raychaudhury S., 1989, Nat, 342, 251
- Reisenegger et al. (2000) Reisenegger A., Quintana H., Carrasco E. R., Maze J., 2000, AJ, 120, 523
- Rines et al. (2003) Rines K., Geller M. J., Kurtz M. J., Diaferio A., 2003, AJ, 126, 2152
- Rowan-Robinson et al. (2000) Rowan-Robinson M., et al., 2000, MNRAS, 314, 375
- Royston (1995) Royston P., 1995, Applied Statistics, 44, 547
- Scaramella et al. (1989) Scaramella R., Baiesi-Pillastrini G., Chincarini G., Vettolani G., Zamorani G., 1989, Nature, 338, 562
- Schröder et al. (2005) Schröder A. C., Kraan-Korteweg R. C., Mamon G. A., Woudt P. A., 2005, in Fairall A. P., Woudt P. A., eds, ASP Conf. Ser. Vol. 329, Nearby Large-Scale Structures and the Zone of Avoidance. Astron. Soc. Pac., San Francisco, pp 167–176
- Shapiro & Wilk (1965) Shapiro S. S., Wilk M. B., 1965, Biometrika, 52, 591
- Smith et al. (2000) Smith R. J., Hudson M. J., Lucey J. R., Schlegel D. J., Davies R. L., 2000, in Astronomical Society of the Pacific Conference Series p. 39
- Stein (1994) Stein P., 1994, Ph.D. thesis, University of Basel
- Stein (1996) Stein P., 1996, A&ASS, 116, 203
- Stein (1997) Stein P., 1997, A&A, 317, 670
- Tamura et al. (1998) Tamura T., Fukazawa Y., Kaneda H., Makishima K., Tashiro M., Tanaka Y., Bohringer H., 1998, PASJ, 50, 195
- Tashiro et al. (1998) Tashiro M., et al., 1998, ApJ, 499, 713
- Tonry & Davis (1979) Tonry J., Davis M., 1979, AJ, 84, 1511
- Tonry et al. (2000) Tonry J. L., Blakeslee J. P., Ajhar E. A., Dressler A., 2000, ApJ, 530, 625
- Wakamatsu et al. (2005) Wakamatsu K., Malkan M. A., Nishida M. T., Parker Q. A., Saunders W., Watson F. G., 2005, in Fairall A. P., Woudt P. A., eds, ASP Conf. Ser. Vol. 329, Nearby Large-Scale Structures and the Zone of Avoidance. Astron. Soc. Pac., San Francisco, pp 189–198
- West & Tarenghi (1989) West R. M., Tarenghi M., 1989, A&A, 223, 61
- Woudt (1998) Woudt P. A., 1998, Ph.D. thesis, University of Cape Town
- Woudt et al. (1997) Woudt P. A., Fairall A. P., Kraan-Korteweg R. C., 1997, in ASP Conf. Ser. Vol. 117, Dark and Visible Matter in Galaxies and Cosmological Implications pp 373–379
- Woudt et al. (2004) Woudt P. A., Kraan-Korteweg R. C., Cayatte V., Balkowski C., Felenbok P., 2004, A&A, 415, 9
- Woudt et al. (1999) Woudt P. A., Kraan-Korteweg R. C., Fairall A. P., 1999, A&A, 352, 39