15 years of VLBI observations of two compact radio sources in Messier 82
Abstract
We present the results of a second epoch of 18 cm global Very Long-Baseline Interferometry (VLBI) observations, taken on 23 February 2001, of the central kiloparsec of the nearby starburst galaxy Messier 82. These observations further investigate the structural and flux evolution of the most compact radio sources in the central region of M82. The two most compact radio objects in M82 have been investigated (41.95+575 and 43.31+592). Using this recent epoch of data in comparison with our previous global VLBI observations and two earlier epochs of European VLBI Network observations we measure expansion velocities in the range of 1500–2000 km s-1 for 41.95+575, and 9000–11000 km s-1 for 43.31+592 using various independent methods. In each case the measured remnant expansion velocities are significantly larger than the canonical expansion velocity (500 km s-1) of supernova remnants within M82 predicted from theoretical models.
In this paper we discuss the implications of these measured expansion velocities with respect to the high density environment that the SNR are expected to reside in within the centre of the M82 starburst.
keywords:
interstellar medium:supernova remnants – galaxies:individual:M82 – galaxies:starburst – galaxies:interstellar medium1 Introduction
Studies of extra-galactic supernova remnants (SNR) are currently limited by sensitivity, and to some extent angular resolution, nevertheless such studies provide unique insights into the early evolution of radio supernovae and supernova remnants. The extensive studies of remnants in our own galaxy (e.g. Green 2004) are particularly valuable for testing details of the physical processes occurring in individual remnants (e. g. Braun, Gull & Perley 1987; Brogan et al. 2006), but they are limited by the fact that the youngest known galactic supernova remnant is over 300 years old and that the distances to galactic remnants, in many cases, remains quite unknown.
Studies of extra-galactic SNR in starburst galaxies have a number of advantages. Firstly, the high star-formation rate results in a relatively large number of young supernova remnants with ages measured in decades, rather than centuries. Secondly, as the starburst region is typically a kiloparsec in extent, and as distances to even the nearest starburst galaxies are a few Mpc, the relative distances to each SNR will only vary by 0.1 %. Finally, radio synthesis techniques ensure that all the SNR, within an individual starburst galaxy, are observed with same angular resolution and sensitivity. Hence as all the SNR are essentially at the same distance this corresponds to a sample of SNR measured with constant linear resolution and surface luminosity limit.
| Epoch | Observation date | Array | Frequency | Reference |
|---|---|---|---|---|
| 1 | 11 Dec 1986 (1986.95) | Ef, Jb, Wb, Mc | 1.4 GHz | Pedlar et al., 1999 |
| 2 | 02 Jun 1997 (1997.42) | Ef, Jb, Mc, Nt, On, Wb, Cm, Tr | 1.6 GHz | Pedlar et al., 1999 |
| 3 | 28 Nov 1998 (1998.91) | VLBA, Y1, Ro, Go, Ef, Jb, Mc, Nt, On, Wb, Tr | 1.6 GHz | McDonald et al., 2001 |
| 4 | 23 Feb 2001 (2001.15) | VLBA, Y1, Ro, Ef, Jb, Mc, Nt, On, Wb, Tr | 1.6 GHz | This paper |
The star-formation rate (SFR) of a galaxy can be estimated using measurements in the ultra-violet, optical, infra-red and radio regimes (e.g. Cram et al. 1998). However, as starburst galaxies usually contain large quantities of dust, the estimates of SFR from ultraviolet and optical data are uncertain due to dust extinction. M82 is no exception with Av typically 20–30 magnitudes (Mattila & Meikle, 2001). Fortunately, radio methods are not affected by dust extinction and hence the SFR can be estimated from the total 1.4 GHz luminosity of the galaxy (Cram et al., 1998). The total flux density of M82 at 1.4 GHz is 8.5 Jy and using a distance of 3.2 Mpc, then the SFR(M5 M⊙) for M82 can be estimated using the relation given by Cram et al., to be 2.5 M⊙ yr-1. Also the total FIR luminosity implies a value of SFR(M5 M⊙) close to 2 M⊙ yr-1 (Cram et al. 1998; Pedlar 2001). In addition the radio thermal free-free contribution is reasonably well defined in M82 and can be used to estimate a SFR (Pedlar et al. 1999) consistent with the above value.
If the SFR is constant over years, then in principle the type-II supernova rate can be derived directly from the SFR and the initial mass function (IMF), on the assumption that all stars with masses 8M⊙ become supernovae. Hence assuming a Miller-Scalo IMF (Miller & Scalo,, 1979) the supernova rate, , is directly related to the SFR. This implies a 0.080.1 yr-1 in M82 and hence it is not surprising to find a relatively large number of radio supernova remnants in this source (Muxlow et al., 1994).
Several methods have been used to estimate the directly from the radio parameters of the M82 supernova remnants (Muxlow et al. 1994; Pedlar et al. 1999). The simplest method is to assume that all the M82 remnants which are brighter and smaller than the Cassiopeia A are younger than 330 years. Alternatively if a constant expansion velocity is assumed (e. g. 5000–10000 km s-1) this gives the ages of the remnants and hence the (Muxlow et al., 1994). Finally van Buren & Greenhouse (1994) estimated the directly from remnant luminosities. Each of these methods imply between 0.05 to 0.1 yr-1, which is consistent with the SFRs discussed above.
These supernova rates imply that the 50 observed remnants have ages typically of a few hundred years. However some doubts have been raised concerning the evolution of the remnants in M82. Kronberg, Biermann & Schwab (1985) claim, using statistical arguments, that in a large fraction of the remnants the radio luminosity is decaying at less than per year. If true this could suggest that the remnants are over a thousand years old. Also theoretical studies by Chevalier & Fransson (2001) have suggested that the high pressure of the interstellar medium in M82 would result in the supernova remnants expanding at only 500 km s-1, hence as the observed sizes are typically a few parsecs, this again would imply ages of thousands of years.
In order to investigate these problems it is essential that the expansion velocities and possible decelerations of the M82 remnants. This is possible using Very Long Baseline Interferometry (VLBI) techniques which enables their sub-parsec structure to be measured. Pedlar et al. (1999) used the European VLBI network (EVN) to produce the first VLBI images of the M82 SNR with 20 mas (0.3 pc) resolution. This work was followed up by McDonald et al. (2001) at even higher angular resolution (5 mas 0.1 pc) using the Global VLBI network.
In this paper we report on further global VLBI measurements taken over two years after the McDonald et al. measurements. They provide a 4th epoch of VLBI measurements and a 2nd epoch of global VLBI images of these SNR.
2 Observations
The latest global VLBI observations were made on the 23 February 2001 using an array with 19 elements at a wavelength of 18 cm for a total of 18 hr. The array used consisted of the ten antennas of the Very Long Baseline Array (VLBA) in the USA, 7 antennas from the EVN, a single Very Large Array (VLA) dish and the NASA Deep Space Network (DSN) antenna at Robledo in Spain. This network was designed to be as close as possible to that used to make similar observations on 28 November 1998 by McDonald et al. (2001) which used a 20 element network. The NASA DSN antenna at Goldstone USA was not available for the observations presented here, resulting in a reduction of the number of baselines to 171 compared to the 190 baselines used in the 1998 epoch. Due to the high declination of the target source, 69.7, and long duration, 18 hr, of these observations the non-availability of the DSN Goldstone antenna did not significantly compromise the excellent u-v coverage of this experiment.
These data were taken in spectral line mode using a total of 128 channels each with a bandwidth of 0.125 MHz. This yields a total bandwidth for the observations of 16 MHz.
Observations of several sources were made in addition to the main target source which was the central kiloparsec of M82. Throughout these observations 4.1 minute scans of M82 where interleaved with 2.1 minute scans of the nearby calibration source J0958+65 which was used for phase referencing. During the observing run the bright calibration sources 3C 84 and J0927+39 were also observed and used in fringe fitting and bandpass calibration. The source 3C 84 was also used in isolation as a flux density scale calibrator.
These observations were correlated using the Mark IV/VLBA system at the National Radio Astronomy Observatory (NRAO) in Socorro, New Mexico. These data were then reduced using the Astronomical Image Processing System (aips) which is provided and maintained by the NRAO, following the same procedures as those detailed in McDonald et al. (2001).
3 Results & analysis
Although the location of all of the bright compact sources were imaged, as in our earlier study McDonald et al. (2001) only two were observable with high signal-to-noise, due to the reduction in brightness sensitivity at high angular resolution. Consequently the results presented here will focus upon the two most luminous and compact sources in M 82, 41.95+575 and 43.31+592, and compare these results with the previous 1.6 and 1.4 GHz global VLBI and EVN observations presented in McDonald et al. (2001) and Pedlar et al. (1999). The observational details of each of these epochs are summarised in Table 1. In the rest of this section we will discuss the structural evolution of the two detected compact radio sources 41.95+575 and 43.31+592.
In Fig. 1 we present two images of 41.95+575, from both the 28 Nov. 1998 global VLBI observations presented by McDonald et al. (2001) and a matched resolution image created from this second epoch of global VLBI observations. Both of these images have been created using a Briggs robustness factor (Briggs, 1995) of 2 and convolved to an angular resolution of 3.3 mas. The measured rms noise of the new 2001 epoch is 36 Jy beam-1. The source 41.95+575 is the most compact of the sources in M82. This source was only marginally resolved in the earlier EVN measurements of Pedlar et al. (1999), however both these new VLBI observations and those of McDonald et al. (2001) clearly resolve this source showing it to exhibit an elongated, bi-polar, structure unlike the shell-like structure commonly associated with SNR. The total flux density of 41.95+575 (including the diffuse emission surround the two compact components) has evolved between these two global VLBI epochs from 34.8 0.1 mJy in Nov. 1998 to 28.90.3 mJy in Feb. 2001.
The second most compact radio source within M82 is the shell-like remnant 43.31+592. Fig. 2 shows images from both of the global VLBI observations of 43.31+592. Unlike 41.95+575, this source has a well defined shell structure and is much more typical of an SNe remnant. Although many of the features of the shell are common to both images, at the resolution of these global VLBI observations (few milliarcsec) the combination of structural evolution of the ring and image fidelity limitations resulting from the incomplete sampling of the u-v plane and non-linear effects of deconvolution, result in ambiguities when tracking individual features between the two epochs. Hence these images are also presented convolved with a 15 mas circular beam (Fig. 3). At this lower angular resolution the effect of individual low signal-to-noise components is minimised; this also allows the two global VLBI observations to be directly compared with the early EVN-only observations made in 1986 and 1997 (Pedlar et al., 1999).
| Epoch | Gaussian | Size | PA | RA | Dec | Speak | Stot | Distance Between Peaks | |
|---|---|---|---|---|---|---|---|---|---|
| comp. | (mas) | (deg) | (J2000) | (J2000) | (mJy/bm) | (mJy) | (mas) | (pc) | |
| 1 | 12.77.6 | 232 | 50.688130.00002 | 43.77640.0001 | 1.800.05 | 17.90.5 | |||
| 3 | 2 | 16.26.6 | 211 | 50.685290.00002 | 43.76820.0002 | 1.380.04 | 15.20.5 | 16.60.2 | 0.220.03 |
| 1 | 15.711.3 | 473 | 50.687890.00002 | 43.76720.0001 | 1.140.02 | 12.90.4 | |||
| 4 | 2 | 20.211.2 | 362 | 50.685020.00004 | 43.75830.0002 | 0.710.02 | 9.10.5 | 17.70.2 | 0.240.03 |
| Annuli (at peak) | Annuli (at 50% of peak) | CPM | ||||
|---|---|---|---|---|---|---|
| Epoch | Derived radius | Derived radius | Derived radius | Derived radius | Derived radius | Derived radius |
| (mas) | (pc) | (mas) | (pc) | (mas) | (pc) | |
| 1 | ||||||
| 2 | ||||||
| 3 | ||||||
| 4 | ||||||
3.1 The expansion of 41.95575
From our earlier measurements it was clear that the expansion velocity of this object was relatively low, and hence measuring the expansion velocity of this object over a two year baseline is particularly challenging. Furthermore the problem is exacerbated by changes in the small scale structure which give rise to problems in finding common reference points between the two epochs.
Several methods were used in an attempt to detect expansion in 41.95+575, including taking slices along the major axis of the source as well as fitting the positions of the two peaks with 2-D Gaussian components. Figure 4 shows a flux density distribution of a 7.5 mas wide, one-dimensional, slice along the major axis of 41.95+575. In this figure the lower, lighter grey line represents the latest global VLBI epoch (2001.15) and the upper solid dark black line the first global VLBI epoch (1998.91). Although the flux density evolution of this source between the two epochs is clearly shown in this figure, the small expansion of the two peaks is not easily discerned. However, a small increase in the separation is measured in the Gaussian fitted centroids of the two dominant components (the positions of these centroids are shown as extended ticks on the x-axis). This increased separation is measured to be 0.70.2 mas year-1, which is equivalent to a projected radial expansion rate of 2050500 km s-1.
In addition to fitting the one-dimensional flux density distribution versus distance along the major axis of 41.95+575, we have performed extensive two-dimensional Gaussian fits to the two brightest components within the image plane. The results of this fitting are shown in Table 2. The expansion derived from these fitted positions is 1.10.3 mas over the 2.24 year baseline implying a radial expansion velocity of 1500400 km s-1.
The expansion along the major axis has been measured in the past by Trotman (1996), McDonald et al. (2001) and more recently in Muxlow et al. (2005b). The results presented here are consistent with these results. It is necessary to note that as this source appears to be bipolar in nature the expansion along the major axis may be greater than the value quoted here due to orientation effects. Consequently, and considering the large errors in measuring the expansion of 41.95+575 over only a 2.24 year baseline, we tentatively conclude that this source is radially expanding at a rate of 1500–2000 km s-1.
3.2 The expansion of 43.31592
A comparison between the 1986 and 1997 EVN images of 43.31+592 (Pedlar et al., 1999) showed an obvious increase in size consistent with an expansion velocity of 10000 km s-1. The continuing expansion of this source is evident in Fig. 3.
More detailed expansion measurements of this source using the full resolution Global VLBI data poses problems due to evolution of the small-scale structure which did not allow accurate Gaussian fitting to the four knots of emission identified in McDonald et al. (2001). Instead, the centre of the source in the maps was found for each epoch and the flux was integrated in a series of -thick annuli at increasing radii from the centre. The geometric centre of 43.31+592 was established in each image as the position which was equidistant from Gaussian fitted components within the ring. A plot of the integrated flux in each annulus against the distance from the centre is plotted in Fig. 5 for all epochs at a matched angular resolution of 15 mas and for the two latest epochs of global VLBI observations at a resolution of 4 mas. The radius of the flux density maximum and 50% of this value for each of the 4 epochs, measured at a matched angular resolution of 15 mas, are listed in Table 3. The robustness of these derived radii was tested with respect to the chosen centre of the remnant by repeating this exercise for several centre positions up to a few beam-widths from the calculated centre. It was found that, although the radius of the peak of the radial flux density profile significantly changed and smeared when the nominated centre was more than a beam-width from the true image centre, the radius as measured at a point between 30–70% of the peak flux did not vary significantly provided the central position deviate by more than a beam-width from the true remnant centre.
As can be seen in both Table 3 and the left-hand panel of Fig. 5, a distinct expansion is observed in the peak radial flux density distribution between the 1986.95 epoch and latter epochs in the lower (15 mas) resolution data. However little discernible expansion of the peak flux density is recorded over the shorter time lines between the three latter epochs, which is not unexpected since an assumed expansion velocity of 10000 km s-1 would imply an increase in the peak radius of 2.5 mas over the 3.7 yrs between 1997.42 and 2001.15. Using the higher 4 mas angular resolution global VLBI data, the measured peak of the radial flux density distribution (Fig 5) in 1998.91 is 19.5 mas compared to 22.5 mas in 2001.15. This implies an angular expansion speed of 1.340.32 mas yr-1, corresponding to a radial expansion speed of 78001900 km s-1.
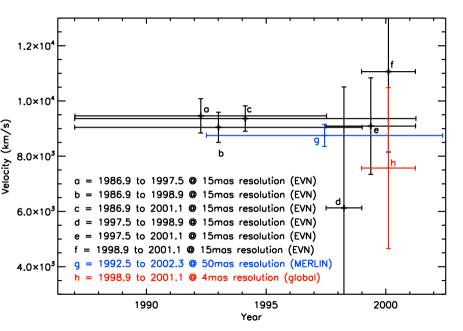
An alternative measure of the radial flux density distribution is the radius at a percentage of the peak flux. In Table 3, in addition to the peak flux density radius, we quote the half peak flux density radius for each epoch of observations as measured from the lower 15 mas resolution images. Whilst neither of these values is a true representation of the radius of the SNR’s radio emission, both are directly proportional to this value and can be used to derive the expansion velocity of the SNR (this is discussed in further detail in the following section). In Fig. 6 radial expansion velocities between each epoch of observations have been plotted, along with an independent measurement of the velocity of 43.31+592 made by comparing deep Multi-Element Radio Linked Interferometer Network (MERLIN) 5 GHz observations made in 1992 and 2002 (Muxlow et al. 2005a). The mean radial expansion velocity of these VLBI measurements is 9025380 km s-1 compared to 8750400 km s-1, recorded over a similar period using MERLIN. These results are consistent with the results in McDonald et al. (2001), Pedlar et al. (1999) and Muxlow et al. (2005a).
3.3 The expansion of 43.31+592 measured using an analytical method
As well as using the conventional methods to measure shell sizes, we have also applied a novel analytical technique developed to parameterise the expansion of SN1993J in M81 Marcaide et al. (2006).
When trying to analyse the expansion of a shell-like object it is important to take into account the continuously increasing ratio between the size of such a shell and the (constant) beam used for the convolution of the CLEAN components to obtain the final image. As the source is expanding, the ratio of the convolved beam size and the source size will become proportionally smaller, this fact can produce biases in the determination of the expansion parameters. Whilst methods for the correction of this beam-related bias in the imaging analysis have been developed by Marcaide et al. (1997), such solutions tend to produce other undesirable new biases in the data. However, a new method for the determination of the expansion of radio-emitting shell-like objects that solves this beam bias has been developed by Marcaide et al. (2006). When applied to shell-like objects, the method has been shown to work in a way totally independent of the a priori beam used. This method, called the ‘Common Point Method’ (CPM), is based on mathematical properties of the convolution of angular symmetric images with Gaussian components. This method is described in detail in Marcaide et al. (2006).
In essence, the CPM exploits the fact that there is a point in the angular average of such circularly symmetric images that is stable with respect to changes in the convolving beam (see Fig. 7). This stability can be used in an iterative process in order to obtain a magnitude that will be perfectly proportional to the radius of the source, with a proportionality constant close to unity and will remain constant provided the expansion is nearly self-similar.

The results from applying the CPM to these 43.31+592 data are listed in Table 3 and are in good agreement with the other expansion measurements presented in this paper. The measured radial expansion velocity of the remnant 43.31+592 using the CPM is km s-1, fitting to each of the four epochs and assuming a free expansion model (i.e. linear expansion). Hence if the expansion is linear, the supernova explosion took place in 1962.
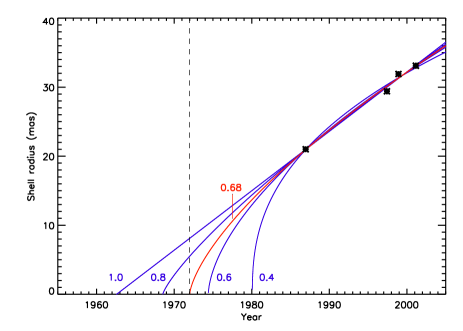
It is possible to fit a wide range of deceleration parameters () to these four derived shell radii, since the birth date of this source is unknown. Following McDonald et al. (2001) and Huang et al. (1994) we parameterise the size evolution of the remnant as, , where and are the size and age of the remnant respectively, is a constant and is the deceleration parameter. In Fig. 8 the derived shell radii are plotted with various fitted parameterised deceleration curves overlaid. It should be noted that in 1972 (marked by the vertical dashed line in Fig. 8), 43.31+592 was detected in radio images made by Kronberg & Wilkinson (1975). This early radio detection of this source implies a lower limit on of 0.68.
4 Discussion
From these global VLBI measurements a radial expansion velocity of 1500400 km s-1 is derived for the most compact radio source in M82, 41.95+576. This source is, however, rather anomalous on account of both its high radio luminosity (compared to the other supernova remnants within M82), rapid flux density decay and highly elongated, bipolar, radio structure. In particular the radio structure of 41.95+576 is highly atypical for a SNR. As yet it is uncertain what this source is, however it is clear that it is inappropriate to treat it as a typical SNR. The nature of 41.95+576 is discussed in Muxlow et al. (2005b).
The well-defined shell structure of 43.31+592 is more typical of SNR and radio supernovae. As can be seen in Fig. 8 the present observations are consistent with near-free expansion of the shell remnant 43.31+592 with a velocity close to 10000 km s-1. This expansion velocity is more than an order of magnitude larger than that predicted by Chevalier & Fransson (2001) which was largely a consequence of the high density and pressure assumed for the M82 ISM. The minimum deceleration parameter that is consistent with this expansion and the first known recording of the radio source in 1972 (Kronberg & Wilkinson, 1975) is 0.68, which is close to the 0.73 limit placed on this parameter from earlier VLBI observations by McDonald et al. (2001).
4.1 Interstellar medium pressures in M82
Chevalier & Fransson (2001) assume that the pressure in the starburst region of M82 is cm-3 K and from this predict low SNR expansion velocities of 500 km s-1. While there is no doubt that part of the starburst must be at this pressure (e. g. compact Hii regions McDonald et al. (2001)), it seems likely that much of the starburst is not in static pressure equilibrium and that a range of pressures are present.
As the photoionised component in M82 has a temperature of 104 K, the pressure assumed by Chevalier & Fransson would require that the density of this gas be 103 cm-3. However, observations of free-free absorption against individual remnants in M82 give emission measures of 5 pc cm-6 (Wills et al., 1997). Consequently if the gas number densities were to be 103 cm-3 the observed emission measure would imply ionised gas path lengths of only 0.5 pc. Given that the extent of the starburst region is at least 500 pc, unless the ionised gas has contrived to occupy only a thousandth of the volume of the starburst in the immediate vicinity of each remnant, it is difficult to see how the ionised component can provide sufficient pressure to slow the SNR expansion to 500 km s-1.
Chevalier & Fransson suggest that the SNR may be confined by the interclump medium of molecular clouds in M82 and note that many of the remnants are in the line of sight to regions of strong CO emission. This is, however, not conclusive evidence that the remnants are embedded within the clouds, and often the Hi absorption spectra measured directly against the remnants (Wills, 1998; Wills et al., 1998) do not support this interpretation (see discussion of 43.31+592 below). Furthermore, studies by Weiß, Walter & Neininger (1999) have shown that the molecular gas in the starforming regions of M82 has a kinetic temperature of 150 K and number densities of cm-3 which corresponds to a pressure two orders of magnitude less than that assumed by Chevalier & Fransson.
Clearly the ISM of M82 is complex, and to assign a single pressure to the starburst region may be unrealistic. Hence it is likely that most of the SNR in M82 are embedded in regions with pressures significantly lower than cm-3 K, especially since pre-supernovae stellar winds from the massive progenitor stars of these remnants are likely to have driven away much of the material within the vicinity of these young supernova remnants prior to the supernova phase beginning. Consequently, it is highly plausible that the observed remnants are expanding into regions of the ISM with lower density than the average density and hence have velocities significantly in excess of 500 km s-1.
4.2 Is 43.31+592 in low density region?
The size, radio luminosity and lack of rapid flux variability of the source 43.31+592 appears to be typical of young SNRs. In addition it shows a well-defined shell structure (Fig. 2, 3). As the shell seems to be in, or close to, free expansion (see Section 3.3) a simple constraint of atoms cm-3 can be set to the external density by assuming that the mass of gas swept up is less than the mass ejected. The expansion velocity of this source clearly exceeds the 500 km s-1 as discussed above.
This possibility is supported by the lack of a low frequency turnover at 73 cm (Wills et al., 1997) in the spectrum of 43.31+592 even though it is in the line of sight to regions with strong free-free emission. This is consistent with the remnant being in front of, and not embedded in, the relatively dense ionised gas in the central region of M82. Additionally, even though relatively strong Hi absorption ( atoms cm-2) is seen against this remnant (Wills, 1998), the absorption has a relatively narrow width and the systemic velocity is consistent with absorption by a disk of Hi external to the central region of M82. Hence this could be further evidence that this source is not embedded in neutral gas in the central region of the starburst. Thus if this SNR is in a particularly low pressure region, it might possibly reconcile the difference between the theoretically predicted and measured expansion velocities.
However it seems unlikely that such a scenario can be contrived to account for high expansion velocities in more than a few of the M82 SNR. Recent MERLIN observations (Muxlow et al. 2005a; Fenech et al. 2005) have independently confirmed the expansion velocity for 43.31+592 in addition to expansion velocities of several more remnants. Of these other remnants their observed radial expansion velocities range from 2000 km s-1 to over 10000 km s-1, implying that neither the relatively slow expansion velocity of 41.95+575 nor the much higher velocity of 43.31+592 are particularly atypical.
Hence, we see no reason to revise the supernova rates or remnant ages that we have inferred previously. However, we can offer no simple explanation for the lack of variability seen in the compact sources (Kronberg et al., 1985). Over the next decade any variability will be constrained by new observations using the next generation of high sensitivity radio interferometers, such as the EVLA and e-MERLIN.
5 Conclusions
Using these global VLBI observations, the two most compact radio components within the centre of the M82 starburst have been imaged with angular resolutions of a few milliarcseconds. This latest epoch of observations, in conjunction with our previous VLBI observations of M82, complete a 15 year timeline of VLBI observations of these compact sources.
The most compact radio source in M82, 41.95+575, has been imaged using both these latest data and those previously published in McDonald et al. (2001). This compact radio source has an elongated, bipolar structure that is atypical of a SNR. Between these two global VLBI observations separated by 2.2 year, this source has grown with a radial expansion velocity along its major axis and in the plane of the sky of 1500400 km s-1. Between these two global VLBI observations the total flux density (including both of the two compact components and the surrounding diffuse emission) of 41.95+575 has reduced at a rate of 7.1% per year, slightly lower than the previously reported 8.5% per year (Trotman, 1996).
The shell-like remnant 43.31+592 has been imaged with synthesised beams of 4 and 15 mas, affording comparisons with both the previous global VLBI observations of McDonald et al. (2001) and the earlier EVN-only observations of Pedlar et al. (1999). Various methods have been used to derive the expansion of this radio shell, all of which provide consistent radial velocities of 10000 km s-1 between each of the four independent observations. This value is consistent with expansion measurements of this source from observations using other radio interferometers (Muxlow et al., 2005a).
Over the 15 year timeline of these observations 43.31+592 appears to be evolving at a rate close to that expected for free-expansion. Using the earliest definite radio detection of this compact source in 1972 (Kronberg & Wilkinson, 1975) these observations imply a lower limit on the deceleration parameter of 0.68. Continued VLBI observations over an increased time baseline will determine the deceleration rate of this source, as well as allowing the interaction of the SNR shell with its surrounding ISM to be further investigated.
Higher sensitivity observations using e-MERLIN and broadband VLBI, combined with an increasing time baseline, will enable the expansion velocities of many more remnants in M82 to be determined and hence constrain both the supernova remnant parameters and the properties of the interstellar medium in M82.
Acknowledgments
We thank the referee for constructive comments. RJB acknowledges financial support by the European Commission’s I3 Programme “RADIONET” under contract No. 505818. JDR, DF & MKA acknowledge financial support via PPARC funded studentships. The VLBA is operated by the National Radio Astronomy Observatory which is a facility of the National Science Foundation operated under cooperative agreement by Associated Universities, Inc. The European VLBI Network is a joint facility of European, Chinese, South African and other radio astronomy institutes funded by their national research councils.
References
- Braun et al. (1987) Braun R., Gull S.F., Perley R.A, 1987, Nature, 327, 395
- Briggs (1995) Briggs D.S., PhD Thesis, New Mexico Institute of Mining and Technology
- Brogan et al. (2006) Brogan, C. L., Gelfand, J. D., Gaensler, B. M., Kassim, N. E., Lazio, T. J. W., 2006, ApJ, 639L, 25
- Chevalier & Fransson (2001) Chevalier R. A. & Fransson C., 2001, ApJ, 558, L27
- Cram et al. (1998) Cram, L., Hopkins, A., Mobasher, B. & Rowan-Robinson, M., 1998, ApJ,507, 155
- Fenech et al. (2005) Fenech, D., Muxlow T.W.B., Pedlar A., Beswick, R. J., Argo, M. K. & Wills, K. A., 2005, Memorie della Societa Astronomica Italiana Vol 76, p583
- Green (2004) Green. D. A., 2004, Bulletin of the Astronomical Society of India, 32, 335
- Huang et al. (1994) Huang, Z.P., Thuan, T.X., Chevalier, R.A., Condon, J.J., Yin, Q.F., 1994, ApJ, 424, 114
- Kronberg & Wilkinson (1975) Kronberg P.P., Wilkinson P.N., 1975, ApJ, 300, 430
- Kronberg et al. (1985) Kronberg P.P., Biermann P., Schwab F.R., 1985, ApJ, 291, 693
- Marcaide et al. (1997) Marcaide J.M., Alberdi A., Ros E., Diamond P., Shapiro I.I., Guirado J.C., Jones D.L., Mantovani F., Perez-Torres M.A., Preston R.A., Schilizzi R.T., Sramek R.A., Trigilio C., van Dyk S.D., Weiler K.W., Whitney A.R., 1997, ApJ, 486, L31
- Marcaide et al. (2006) Marcaide J.M., et al., 2006, ApJ, submitted
- Mattila & Meikle (2001) Mattila, S., Meikle, W. P. 2001, MNRAS, 324, 325
- McDonald et al. (2001) McDonald A. R., Muxlow T.W.B., Pedlar A., Garrett M. A., Wills K. A., Garrington S. T., Diamond P. J. & Wilkinson P.N. 2001, MNRAS, 322, 100
- McDonald et al. (2002) McDonald A. R., Muxlow T.W.B., Wills K. A., Pedlar A. & Beswick R. J., 2002, MNRAS, 334, 912
- Miller & Scalo, (1979) Miller G. E. & Scalo J. M., 1979, ApJS, 41, 513
- Muxlow et al. (1994) Muxlow T.W.B., Pedlar A., Wilkinson P.N., Axon D.J., Sanders E.M., de Bruyn A.G., 1994, MNRAS, 266, 455
- Muxlow et al. (2005a) Muxlow T.W.B., Pedlar A., Riley J. A., McDonald A. R., Beswick R. J. & Wills K. A., 2005a, Proceedings of the IAU Coll 192: Supernovae (10 years of SN1993J). Eds. J.M. Marcaide and Kurt W. Weiler. Springer Proceedings in Physics, vol. 99. Berlin: Springer, p.227
- Muxlow et al. (2005b) Muxlow T.W.B., Pedlar A., Beswick, R. J., Argo, M. K., O’Brien, T., Fenech, D. & Trotman, W., 2005b, Memorie della Societa Astronomica Italiana Vol 76, p586
- Pedlar et al. (1999) Pedlar A., Muxlow T. W. B., Garrett M. A., Diamond P., Wills K. A., Wilkinson P. N., Alef W., 1999, MNRAS, 307, 761
- Pedlar (2001) Pedlar A. 2001 IAU Symp. 205 ‘Galaxies and their Constituents at the highest angular resolutions’,Ed. R. T. Schilizzi, 2001, p. 366
- Trotman (1996) Trotman W.M., 1996, MSc Thesis, University of Manchester
- van Buren & Greenhouse (1994) van Buren, D. & Greenhouse, M. A., 1994 ApJ 431, 640
- Weiß et al. (1999) Weiß, A. and Walter, F. and Neininger, N. and Klein, U., 1999, A&A, 345, L23
- Wills et al. (1997) Wills K. A., Pedlar A., Muxlow T. W. B., Wilkinson P.N., 1997, MNRAS, 291,517
- Wills (1998) Wills K. A., 1998, PhD Thesis, University of Manchester
- Wills et al. (1998) Wills K. A., Pedlar A., Muxlow T. W. B., 1998, MNRAS, 298, 347
- Wills et al. (1999) Wills K. A., Redman M. P., Muxlow T. W. B., Pedlar A., 1999, MNRAS, 309, 395