A historic jet-emission minimum reveals hidden
spectral features in 3C 273
Abstract
Aims. The aim of this work is to identify and study spectral features in the quasar 3C 273 usually blended by its strong jet emission.
Methods. A historic minimum in the sub-millimetre emission of 3C 273 triggered coordinated multi-wavelength observations in June 2004. X-ray observations from the INTEGRAL, XMM-Newton and RXTE satellites are complemented by ground-based optical, infrared, millimetre and radio observations. The overall spectrum is used to model the infrared and X-ray spectral components.
Results. Three thermal dust emission components are identified in the infrared. The dust emission on scales from 1 pc to several kpc is comparable to that of other quasars, as expected by AGN unification schemes. The observed weakness of the X-ray emission supports the hypothesis of a synchrotron self-Compton origin for the jet component. There is a clear soft-excess and we find evidence for a very broad iron line which could be emitted in a disk around a Kerr black hole. Other signatures of a Seyfert-like X-ray component are not detected.
Key Words.:
quasars: general – quasars: individual: 3C 273 – infrared: galaxies – X-rays: galaxies1 Introduction
The bright quasar 3C 273 at a redshift of is one of the best observed active galactic nuclei (AGN) (see Courvoisier 1998, for a review). It is the subject of both longterm monitoring to study its variability (Türler et al. 1999, and references therein) and coordinated multi-wavelength campaigns to derive its single epoch spectral energy distribution (SED) (e.g. Lichti et al. 1995; von Montigny et al. 1997).
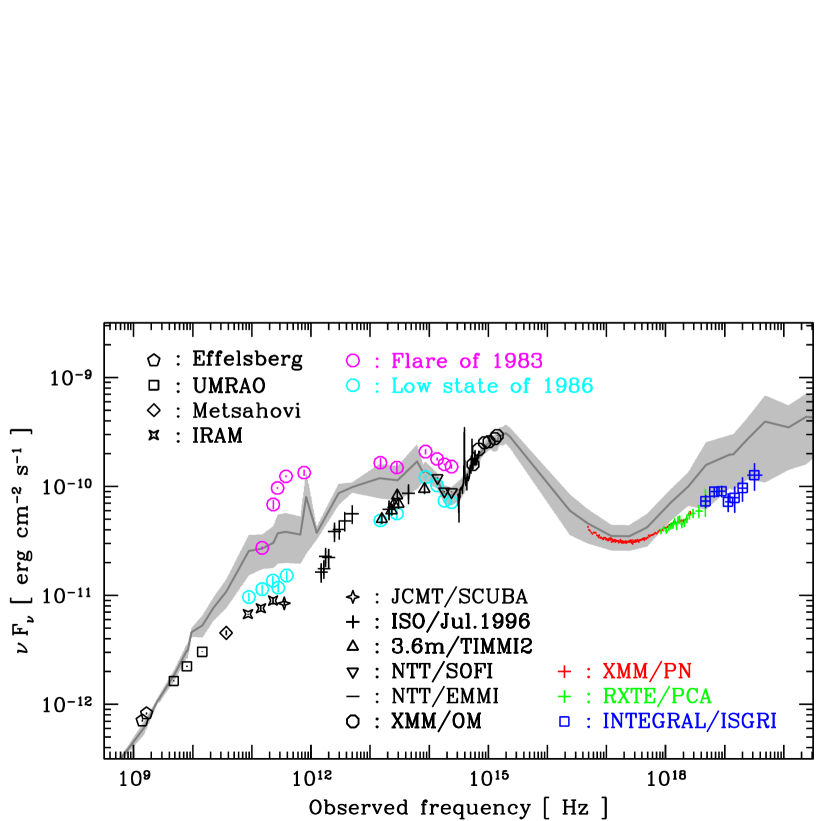
3C 273 has both a big blue bump with broad emission lines typical for Seyfert galaxies and a strongly beamed jet emission typical for blazars. A very low jet emission is required to study thermal infrared emission and its more Seyfert-like properties in the X-rays. This occurred in March 1986 and allowed Robson et al. (1986) to identify a new near-infrared spectral component. An even better opportunity arose in early 2004, when the sub-millimetre (sub-mm) flux of 3C 273 was observed to be almost twice lower than in 1986 (see Fig. 1).
This absolute minimum triggered an INTEGRAL target of opportunity (TOO) observation in June 2004 to study the hard X-ray emission in such a low jet-emission state. Quasi-simultaneous optical and infrared observations were performed at La Silla using director’s discretionary time (DDT 273.B-5031) in order to study the thermal infrared components. The data set is further complemented by contemporaneous X-ray data obtained by XMM-Newton and RXTE, as well as by radio and millimetre measurements from several ground stations. The full dataset is described below and photometric data are listed in Table 1.
| Observatory | Date | Spectral band | |
|---|---|---|---|
| Effelsberg | Jun 24 | 1.40 GHz | 50.651.01 Jy |
| Effelsberg | Jun 07 | 1.66 GHz | 49.640.99 Jy |
| UMRAO | Jun 27 | 4.80 GHz | 34.100.35 Jy |
| UMRAO | Jun 27 | 8.00 GHz | 27.910.36 Jy |
| UMRAO | Jun 24 | 14.5 GHz | 20.930.14 Jy |
| Metsähovi | Jun 26 | 36.8 GHz | 12.310.62 Jy |
| IRAM | Jun 17 | 3.0 mm | 7.800.08 Jy |
| IRAM | Jun 17 | 2.0 mm | 5.330.37 Jy |
| IRAM | Jun 17 | 1.3 mm | 3.900.31 Jy |
| JCMT/SCUBA† | Mar 19 | 850 m | 2.400.12 Jy |
| 3.6 m/TIMMI2 | Jun 30 | Q1@18.8 m | 31431.4 mJy |
| 3.6 m/TIMMI2 | Jun 19 | N@12.9 m | 25925.9 mJy |
| 3.6 m/TIMMI2 | Jun 19 | N@11.9 m | 27227.2 mJy |
| 3.6 m/TIMMI2 | Jun 19 | N@10.4 m | 28528.5 mJy |
| 3.6 m/TIMMI2 | Jun 19 | N@ 9.8 m | 22522.5 mJy |
| 3.6 m/TIMMI2 | Jun 19 | L (3.6 m) | 11411.4 mJy |
| NTT/SOFI | Jun 19 | Ks (2.16 m) | 86.350.51 mJy |
| NTT/SOFI | Jun 19 | H (1.65 m) | 49.560.43 mJy |
| NTT/SOFI | Jun 19 | J (1.25 m) | 36.920.26 mJy |
| NTT/EMMI | Jun 19 | 4200–9700 Å | Spectrum‡ |
| XMM/OM | Jun 30 | V (5430 Å) | 28.850.03 mJy |
| XMM/OM | Jun 30 | B (4340 Å) | 31.690.02 mJy |
| XMM/OM | Jun 30 | U (3440 Å) | 28.890.02 mJy |
| XMM/OM | Jun 30 | UVW1 (2910 Å) | 24.970.02 mJy |
| XMM/OM | Jun 30 | UVM2 (2310 Å) | 21.180.04 mJy |
| XMM/OM | Jun 30 | UVW2 (2120 Å) | 20.750.06 mJy |
†Instrument unavailable during the June campaign. The measurement of March is used instead based on similar IRAM 1 mm fluxes in March and June.
‡Available from 3C 273’s Database: http://isdc.unige.ch/3c273/
2 Data
INTEGRAL observed 3C 273 during revolution 207 on 23-24 June 2004. 51 pointings of 1800 ksec were taken in dithering mode leading to an effective exposure of 67 ksec. The data from the IBIS/ISGRI instrument have been analysed in a standard way with the latest version of the off-line scientific analysis package (OSA 5.1). There are no data from the spectrometer SPI, because the instrument was in annealing mode during the observation. The JEM-X data are consistent with the RXTE/PCA data, but are not shown here because of lower signal-to-noise.
XMM-Newton made a 20 ksec long calibration observation of 3C 273 in rev. 835 on 30 June 2004. The data from the EPIC camera were processed with the latest version of the scientific analysis software (SAS 6.5.0) and the most up-to-date calibration files. Because of problems with pile-up, the central cores (radii of 7 arcsec) were excluded when extracting the spectra. For the sake of conciseness we only show here the PN data. We however checked that the MOS 1 and 2 data are compatible with our results. Optical and ultraviolet fluxes were obtained with the optical monitor (OM) of XMM-Newton following the instructions of the SAS Watchout page111http://xmm.esac.esa.int/sas/documentation/watchout/uvflux.shtml and using the values provided for an AGN spectral type. RXTE also observed 3C 273 for 1.3 ksec on 23 June 2004 as part of a long-term monitoring program started in 2001. The data of the PCA instrument have been analysed in the standard way.

Optical, near- and mid-infrared observations of 3C 273 were taken on 19 June 2004 at La Silla, Chile. An optical spectrum was obtained with the EMMI spectrograph at the New Technology Telescope (NTT) using Grism #2. The spectrum with an exposure of 300 sec was flux-calibrated with a spectro-photometric standard star. This observation was immediately followed by measurements in the J, H and Ks bands with the SOFI instrument on the NTT. The magnitudes were calibrated using three photometric standard stars and converted to flux with the zero-magnitude fluxes used by Türler et al. (1999). Additional mid-infrared observations in various L, N and Q bands were performed with TIMMI2 on the 3.6 m telescope at La Silla. The L and N band data have been calibrated using the standard star HD 133774 with similar airmass of 1.1 observed a few hours after 3C 273, while the Q band flux was derived with two standard stars (HD 110458 and HD 169916) with airmasses bracketing that of 3C 273. We estimate the flux uncertainties to be about 10 % in these L, N and Q bands.
The sub-mm observation at 850 m that triggered this observation campaign was obtained by the SCUBA instrument on the James Clerk Maxwell Telescope (JCMT) as part of a long term monitoring program (Robson et al. 2001) (see Fig. 1). 3C 273 is also regularly observed in the millimetre range with the 30 m antenna of the Institut de Radio Astronomie Millimétrique (IRAM) on Pico Veleta, Spain. The data of 17 June used here are of good quality with a column of 5-8 mm of H2O, but the calibration on the planet Mars is a bit uncertain at 1.3 mm. The observations at 37 GHz were performed with the 13.7 m diameter antenna of the Metsähovi radio observatory (Teraesranta et al. 1998). Additional measurements at 4.8, 8.0 and 14.5 GHz were taken by the 26 m paraboloid of the University of Michigan Radio Astronomy Observatory (UMRAO) as part of a long-term monitoring program (Aller et al. 1985). Finally, the 100 m-antenna at Effelsberg, Germany routinely measured 3C 273 at 1.40 and 1.66 GHz (see Peng et al. 2000, for details) during the VLBI-calibration runs of June 2004.
3 Results
The overall SED of 3C 273 (Figs. 2 and 3) shows that the infrared and X-ray emission were also in a very low state in June 2004, while the optical and ultraviolet blue bump emission was rather above average values. We focus here on the infrared and X-ray spectral ranges, as they are the most affected by the low jet emission of this campaign. The possible link with the blue bump will be discussed by Chernyakova et al. (in prep.).
| 10 | 1.5 | 45.8 | 1.49 103 | 297 | 11.4 | 1620 | 0.43 | 0.80 |
| 10 | 2.0 | 38.9 | 3.60 103 | 272 | 14.4 | 1618 | 0.43 | 0.88 |
| 1 | 1.5 | 45.0 | 8.40 103 | 285 | 58.1 | 1304 | 1.33 | 0.74 |
| 1 | 2.0 | 39.9 | 3.26 104 | 258 | 133 | 1201 | 1.92 | 0.89 |
3.1 Thermal emission
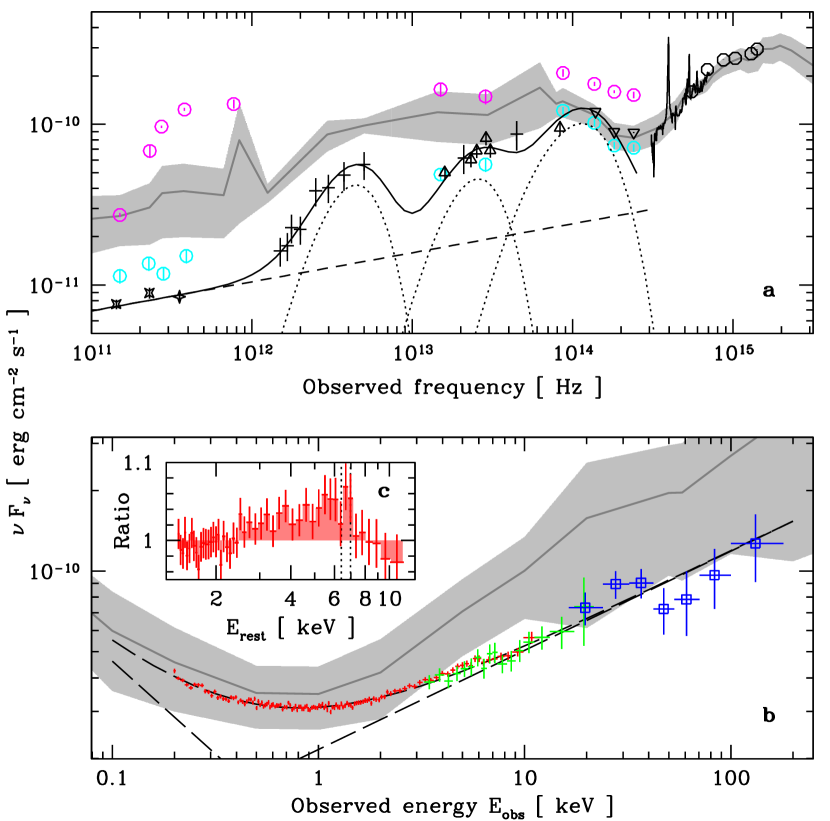
To study the complete thermal emission of 3C 273 up to the far infrared, we included the ISO observations taken on 15 July 1996 (Haas et al. 2003), when the source was also in a very low sub-mm state (see Fig. 1). With the addition of those data there is a broad infrared excess above the synchrotron emission extrapolated from the millimetre range with a simple powerlaw of the form (see Fig. 3a). The bumpy shape of the excess and the sharp cut-off at 2 m does not suggest a second synchrotron component, but favours thermal dust emission. We therefore model the excess with three isothermal grey-body components, for which the observed flux density at the redshifted frequency is (Polletta et al. 2000):
| (1) |
where is the radius of the projected source, is the luminosity distance, is the optical depth of the dust and is the emitted Planck function for a blackbody of temperature . is calculated with the redshift and assuming a Hubble constant of km s-1 Mpc-1 and a deceleration parameter . The optical depth depends on , the frequency for which and on , the dust emissivity index.
Table 2 lists the best fit values for and derived for two different values of and . The reduced being below one for all fits, the exact values of and cannot be determined. The synchrotron emission model has a slope of and a normalization of 6.9 Jy at 100 GHz for all fits. We note that the physical size of the emission components is increasing when assuming optically thin dust emission up to the near-infrared (m). The highest value of 33 kpc would imply the presence of dust heated to 40 K throughout the host galaxy, which is not very realistic. Other values of temperature and radius are in good agreement with those derived for various quasars (Polletta et al. 2000) and therefore give support to the unification scheme of AGN. The dust mass is related to the radius of the source by: , where is the dust opacity at . Using the traditional value of cm2/g at m (Hildebrand 1983), we obtain a total dust mass in the 2.6–3.1 107 M☉ range for all fits, which is an order of magnitude below that derived by Haas et al. (2003) based on the luminosity from 1 m to 1 mm.
3.2 X-ray emission
A good fit () to the combined data from XMM-Newton/PN, RXTE/PCA and INTEGRAL/ISGRI was obtained with a simple double-powerlaw model assuming a galactic hydrogen column density of cm-2 (Dickey & Lockman 1990) and with free intercalibration factors relative to XMM-Newton. INTEGRAL and RXTE fluxes are respectively 0.86 times lower and 1.27 times higher. The best fit powerlaws for the hard X-ray emission and the soft-excess component have photon indices of and with a normalization at 1 keV of and , respectively. The value for is just slightly steeper than the typical value of 1.5 in 3C 273 (Courvoisier 1998) and is also in very good agreement with previous observations by ROSAT (Leach et al. 1995).
The integrated model flux in the 2–10 keV band is of . Such a low flux in 3C 273 was only measured twice in the past, by Ginga in July 1987 (Turner et al. 1990) and by BeppoSAX on 18 July 1996 (Haardt et al. 1998), i.e. at the time of the ISO observation coincident with a very low sub-mm flux (see Fig. 1). The simultaneous occurrence of low fluxes in the sub-mm and the X-rays supports a synchrotron self-Compton origin of the X-ray jet emission in 3C 273, as suggested by McHardy et al. (1999), who observed correlated X-ray and infrared variations. However, the weaker flux decrease relative to the average level in the X-rays than in the sub-mm (see Fig. 2) suggests the presence of an additional Seyfert-like X-ray component as identified by Grandi & Palumbo (2004). We tried to add such a component with the same fixed model parameters, but this did not improve the fit, probably because of the relatively poor signal-to-noise ratio of the INTEGRAL data that do not allow the detection of a reflection hump. The two-powerlaw model used here shall therefore be considered rather phenomenological than physical.
Close inspection of the ratio between the data and the model reveals an excess in the = 2.5–7 keV band, where refers to the quasar rest frame energy (see Fig. 3c). This excess is significant at the 6- level with an integrated flux of corresponding to a equivalent width (EW) of eV. These values are rather high but consistent with recent detections of a broad iron K line in 3C 273 (Yaqoob & Serlemitsos 2000; Kataoka et al. 2002; Page et al. 2004). The profile of the excess is neither satisfactorily fitted by a Gaussian line nor a line emitted in a relativistic disk around a Schwarzschild black hole, as these models cannot account for its extent down to 2.5 keV. If this extent is real, the only remaining explanation is that it is emitted around a near-extreme Kerr black hole, for which the closer last stable orbit results in an extreme gravitational redshift as illustrated in Fig. 5 of Fabian et al. (2000). Finally, the sharp edge of the iron line at 7 keV suggests that the angle between the normal to the accretion disk and the line of sight is of 35–40 according to the simulations of Torres et al. (2003) for neutral iron. Ionized iron would result in a smaller angle.
4 Conclusion
The SED of 3C 273 at a historic minimum of its synchrotron jet emission reveals new spectral features in the infrared and the X-rays. Dust emission is identified on sizes ranging from 1 pc to several kpc with properties comparable to those of other quasars. The low X-ray flux supports the idea that part of the X-ray emission is of synchrotron self-Compton origin. There is likely an additional Seyfert-like component, but we do not detect it. We also find evidence for a very broad iron line — possibly emitted in a relativistic disk around a Kerr black hole — which could well have remained unnoticed with observations not extending below 1 keV.
References
- Aller et al. (1985) Aller, H. D., Aller, M. F., Latimer, G. E., & Hodge, P. E. 1985, ApJS, 59, 513
- Courvoisier (1998) Courvoisier, T. J.-L. 1998, A&A Rev., 9, 1
- Dickey & Lockman (1990) Dickey, J. M. & Lockman, F. J. 1990, ARA&A, 28, 215
- Fabian et al. (2000) Fabian, A. C., Iwasawa, K., Reynolds, C. S., & Young, A. J. 2000, PASP, 112, 1145
- Grandi & Palumbo (2004) Grandi, P. & Palumbo, G. G. C. 2004, Science, 306, 998
- Haardt et al. (1998) Haardt, F., Fossati, G., Grandi, P., et al. 1998, A&A, 340, 35
- Haas et al. (2003) Haas, M., Klaas, U., Müller, S. A. H., et al. 2003, A&A, 402, 87
- Hildebrand (1983) Hildebrand, R. H. 1983, QJRAS, 24, 267
- Kataoka et al. (2002) Kataoka, J., Tanihata, C., Kawai, N., et al. 2002, MNRAS, 336, 932
- Leach et al. (1995) Leach, C. M., McHardy, I. M., & Papadakis, I. E. 1995, MNRAS, 272, 221
- Lichti et al. (1995) Lichti, G. G., Balonek, T., Courvoisier, T. J.-L., et al. 1995, A&A, 298, 711
- McHardy et al. (1999) McHardy, I., Lawson, A., Newsam, A., et al. 1999, MNRAS, 310, 571
- Page et al. (2004) Page, K. L., Turner, M. J. L., Done, C., et al. 2004, MNRAS, 349, 57
- Peng et al. (2000) Peng, B., Kraus, A., Krichbaum, T. P., & Witzel, A. 2000, A&AS, 145, 1
- Polletta et al. (2000) Polletta, M., Courvoisier, T. J.-L., Hooper, E. J., & Wilkes, B. J. 2000, A&A, 362, 75
- Robson et al. (1986) Robson, E. I., Gear, W. K., Brown, L. M. J., Courvoisier, T. J.-L., & Smith, M. G. 1986, Nature, 323, 134
- Robson et al. (1983) Robson, E. I., Gear, W. K., Clegg, P. E., et al. 1983, Nature, 305, 194
- Robson et al. (2001) Robson, E. I., Stevens, J. A., & Jenness, T. 2001, MNRAS, 327, 751
- Türler et al. (1999) Türler, M., Paltani, S., Courvoisier, T. J.-L., et al. 1999, A&AS, 134, 89
- Teraesranta et al. (1998) Teraesranta, H., Tornikoski, M., Mujunen, A., et al. 1998, A&AS, 132, 305
- Torres et al. (2003) Torres, D. F., Romero, G. E., Barcons, X., & Lu, Y. 2003, ApJ, 596, L31
- Turner et al. (1990) Turner, M. J. L., Williams, O. R., Courvoisier, T. J. L., et al. 1990, MNRAS, 244, 310
- von Montigny et al. (1997) von Montigny, C., Aller, H., Aller, M., et al. 1997, ApJ, 483, 161
- Yaqoob & Serlemitsos (2000) Yaqoob, T. & Serlemitsos, P. 2000, ApJ, 544, L95