The distribution of ortho–H2D+(11,0–11,1) in L1544: tracing the deuteration factory in prestellar cores
Abstract
Prestellar cores are unique laboratories for studies of the chemical and physical conditions preceding star formation. We observed the prestellar core L1544 in the fundamental transition of ortho–H2D+ (11,0–11,1) at different positions over 100′′, and found a strong correlation between its abundance and the CO depletion factor. We also present a tentative detection of the fundamental transition of para–D2H+ (11,0–10,1) at the dust emission peak. Maps in N2H+, N2D+, HCO+ and DCO+ are used, and interpreted with the aid of a spherically symmetric chemical model that predicts the column densities and abundances of these species as a function of radius. The correlation between the observed deuterium fractionation of H3+, N2H+ and HCO+ and the observed integrated CO depletion factor across the core can be reproduced by this chemical model. In addition a simpler model is used to study the H2D+ ortho–to–para ratio. We conclude that, in order to reproduce the observed ortho–H2D+ observations, the grain radius should be larger than 0.3 m.
1 Introduction
Deuterium bearing species are good probes of the cold phases of molecular clouds prior to star formation. Many recent observations point to the fact that their abundances relative to their fully hydrogenated forms are larger, by factors up to 105, than the solar neighborhood value of 1.5 10-5 found by Linsky (2003). The deuterium fractionation has been evaluated in prestellar cores and low mass protostars from observations of HCO+ and N2H+ (Butner et al. 1995; Williams et al. 1998; Caselli et al. 2002a; Crapsi et al. 2004, Crapsi et al. 2005), H2CO (Loinard et al. 2001; Bacmann et al. 2003), H2S (Vastel et al. 2003), HNC (Hirota et al. 2003), CH3OH (Parise et al. 2004), and NH3 (Roueff et al. 2000, Tiné et al. 2000). The chemical fractionation process in the gas–phase mainly arises from the difference between the zero-point energies of H2 and HD. Almost incredibly, this can lead to a detectable quantity of triply deuterated molecules like ND3 (Lis et al. 2002; van der Tak et al. 2002) and CD3OH (Parise et al. 2004). The latter is thought to be formed mainly on dust grain surfaces (Charnley et al. 1997) in regions where the gas–phase [D]/[H] ratio is enhanced to values larger than 0.1 (Caselli et al. 2002c), as in the cold cores (see below). In molecular clouds, hydrogen and deuterium are predominantly in the form of H2 and HD respectively. So the HD/H2 ratio should closely equal the D/H ratio. Since the zero-point energies of HD and H2 differ by 410 K, the chemical fractionation will favor the production of HD compared to H2. In the dense, cold regions of the interstellar medium (T 10 K), D will be initially nearly all absorbed into HD. The abundant ion available for interaction is H, which gives H2D+:
| (1) |
The reverse reaction does not occur efficiently in the cold dense clouds where low–mass stars form, and where the kinetic temperature is always below 25 K, the “critical” temperature above which reaction (1) starts to proceed from right to left and limits the deuteration. Therefore, the degree of fractionation of H2D+ becomes non-negligible. This primary fractionation can then give rise to other fractionations and form D2H+ and D as first suggested by Phillips & Vastel (2003):
| (2) |
| (3) |
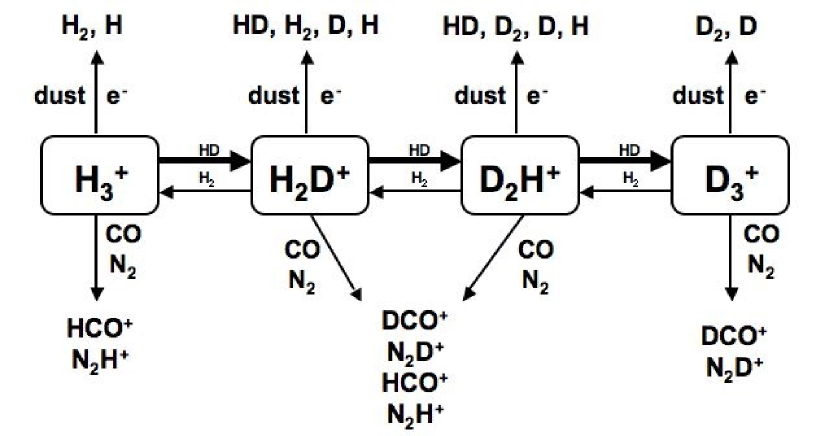
We present in Figure 1 the main reactions involving these molecules. Note that the effect of the recombination of H with electrons in the gas is negligible because of the low electron density in such regions. However, the effect of recombination with electrons on negatively charged grain surfaces becomes important when depletion increases (cf. Walmsley et al. 2004). The dissociation of the deuterated forms of H is then responsible for the enhancement in the [D]/[H] ratio. One specific parameter can enhance this process: the depletion of neutral species (in particular, the abundant CO) from the gas-phase (cf. Dalgarno & Lepp 1984). In fact, the removal of species which would normally destroy H (e.g. CO; Roberts & Millar, 2000) means that H is more likely to react with HD and produce H2D+, D2H+ and D. The first model including D2H+ and D (Roberts, Herbst & Millar, 2003) predicted that these molecules should be as abundant as H2D+ (see also Flower et al., 2004).
Gas phase species are expected to be depleted at the center of cold, dark clouds, since they tend to stick onto the dust grains. A series of recent observations has shown that, in some cases, the abundance of molecules like CO decreases toward the core center of cold ( 10 K), dense ( a few 104 cm-3) clouds. L1498: Willacy et al. (1998), Tafalla et al. (2002, 2004); IC 5146: Kramer et al. (1999), Bergin et al. (2001); L977: Alves et al. (1999); L1544: Caselli et al. (1999), Tafalla et al. (2002); L1689B: Jessop & Ward-Thompson (2001); Bacmann et al. (2002); Redman et al. (2002); B68: Bergin et al. (2002); L1517B: Tafalla et al. (2002, 2004); L1512: Lee et al. (2003); Oph D: Bacmann et al. (2003), Crapsi et al. (2005); L1521F: Crapsi et al. (2004); L183 (L134N): Pagani et al. (2005). These decreases in abundance have been interpreted as resulting from the depletion of molecules onto dust grains (see, e.g., Bergin & Langer, 1997; Charnley, 1997). It is now clear that these drops in abundance are typical of the majority of dense cores (see Tafalla & Santiago 2004 for the case of L1521E, the first starless core to be found with no molecular depletion).
In one of the most heavily CO depleted prestellar cores, L1544, Caselli et al. (2003) detected a strong (brightness temperature 1 K) ortho-H2D+(101-111) line, and concluded that H2D+ is one of the main molecular ions in the central region of this core. Encouraged by laboratory measurements (Hirao & Amano, 2003), Vastel et al. (2004) detected the para–D2H+ molecule in its ground transition at 692 GHz. They found that, in the prestellar core 16293E, D2H+ is as abundant as H2D+. These studies supported chemical modelling and the inclusion of multiply deuterated species (Roberts et al. 2003; Walmsley et al. 2004; Roberts et al. 2004; Flower et al. 2005; Aikawa et al. 2005). It appears that in dark clouds affected by molecular depletion, the deuterated forms of the molecular ion H are unique tracers of the core nucleus, the future stellar cradle. Thus, their study becomes fundamental to the unveiling of the initial conditions of the process of star formation (kinematics, physical and chemical structure of pre–stellar cores).
In this paper, we present new observations of the H2D+ (110-111) line toward L1544, mapped over 100′′ of the dust peak emission, as well as a tentative detection of the D2H+ (110-101) line. Caselli et al. (2003) roughly estimated the size of the H2D+ emitting region in this pre–stellar core and suggested a radius of about 3000 AU. But this was based on a five-point map and cannot put stringent constraints on the chemical structure. Also a parallel study has been done by van der Tak et al. (2005) with the analysis of the line shape profile. Here, the H2D+ map is also compared with other high density tracer maps. Due to the poor atmospheric transmission at the frequency of the para–D2H+ fundamental line, this study is limited to the ortho–H2D+ fundamental line. We will present, in the last section, the perspectives on this work that will be opened up by future observatories.
2 Observations
The observations were carried out at the Caltech Submillimeter Observatory (CSO),
between November 2003 and February 2005, under good weather conditions (225 GHz zenith opacity
always less than 0.06) where the atmospheric transmission is about 30% at 372 GHz and less than
20% at 692 GHz. Scans were taken toward the peak of the 1.3 mm continuum dust emission of L1544
(, )
using the chopping secondary with a throw of 3′.
The 345 GHz (respectively 650 GHz) sidecab receiver with a 50 MHz acousto-optical spectrometer backend
was used for all observations with a velocity resolution of 0.06 km s-1
(respectively 0.03 km s-1) i.e. 1.6 channels. At the observed frequencies
of 372.421385(10) GHz for the H2D+ (110-111) and 691.660483(20)
for the D2H+ (110-101) lines (Amano & Hirao, 2005), the CSO 10.4 meters
antenna has a HPBW of about 20′′ and 11′′ respectively.
We mapped the area in H2D+ around the dust peak position with a grid spacing of
20′′ and used the value at the peak from Caselli et al. (2003) and integrated
longer.
The beam efficiency at 372 GHz (respectively 692 GHz) was measured on Venus, Saturn and Jupiter and
found to be 60% (respectively 40%). Pointing was monitored every 1 hour and half and found to be
better than 3′′. In the case of H2D+, the emission is extended compared
to the beam size of CSO: the efficiency is then about 70%. If the emission in D2H+ is extended
compared to the beamsize of 11′′, then the efficiency at 692 GHz is about 60%.
The data reduction was performed using the CLASS program of the GAG software developed at IRAM and the
Observatoire de Grenoble.
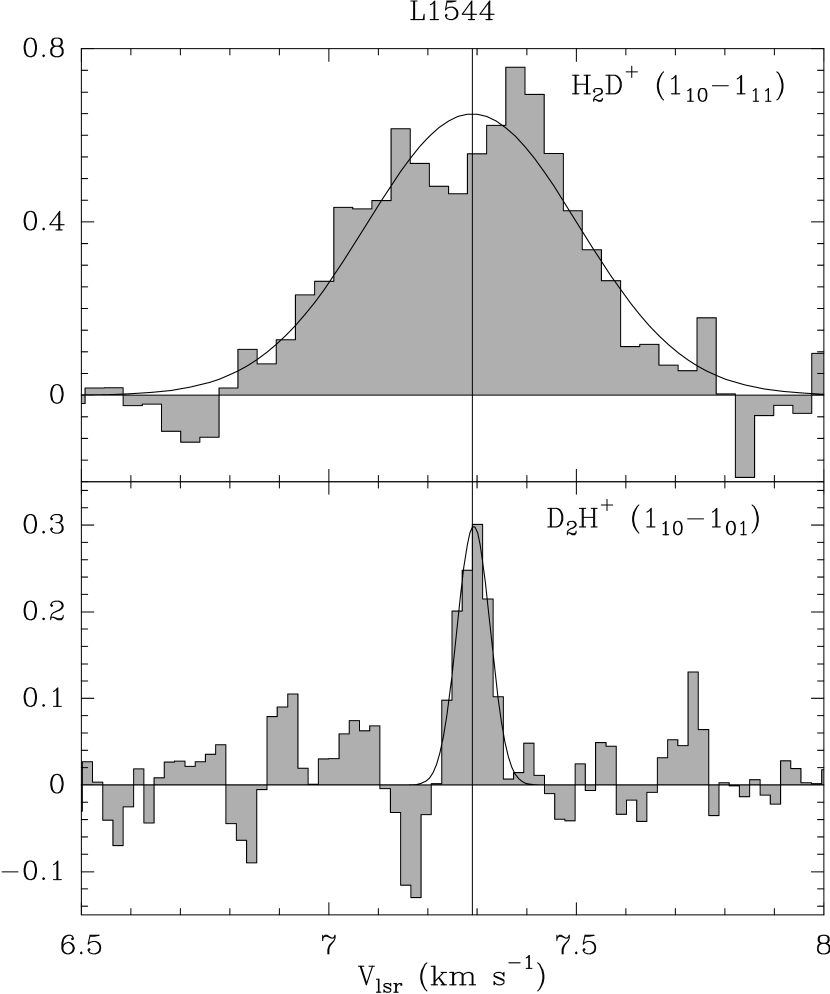
Figure 2 shows the H2D+ and D2H+ spectra observed toward the dust peak position. A Gaussian fit to the H2D+ line gives a LSR velocity of 7.3 km s-1, but two peaks are clearly visible, with velocities 7.1 and 7.4 km s-1 (van der Tak et al. 2005), as also seen in other tracers (Tafalla et al. 1998; Caselli et al. 2002a). This central position has been originally observed by Caselli et al. (2003) and studied in detail by van der Tak et al. (2005); here, we improved the sensitivity and used the new value of the ortho-H2D+(110-111) line frequency, recently measured by Amano & Hirao (2005). The on-source integration time for D2H+ is about 230 min. The D2H+ feature can be fitted with a gaussian with Ta∗=0.30 0.07 K, v=0.08 0.04km s-1 and VLSR=7.29 0.03 km s-1. The solid vertical line corresponds to the velocity from this gaussian fit. It is consistent with the central velocity of the H2D+ line of 7.28 0.06 km s-1. However, it is difficult to believe that the observed linewidth represents the real linewidth of the transition as the expected thermal linewidth is about 0.25 km s-1 for a kinetic temperature of 7 K, as predicted by dust temperature measurement (Evans et al. 2001; Zucconi et al. 2001). This is about 3 times larger than the observed linewidth. Formaldehyde observations of Bacmann et al. (2002) suggest larger gas temperatures (up to 9 K), but H2CO is likely frozen in the core center, so that the measured temperature probably reflects the warmer core envelope (Young et al. 2004). At high densities (higher than 3 104 cm-3), Young et al. (2004) find the gas and dust temperature to be between 7 and 9 K, consistent with what was found by Tafalla et al. (2002) using ammonia. We will use in the following a temperature of 8 K in this cloud. The signal to noise ratio of our D2H+ observations is not sufficient to get constraints on the kinematics of the source and the fitted linewidth probably does not represent the real linewidth. In absence of a possible explanation for the narrow linewidth for the D2H+ profile, we will consider, in the following, that we only have a tentative detection, and will then use an upper limit.
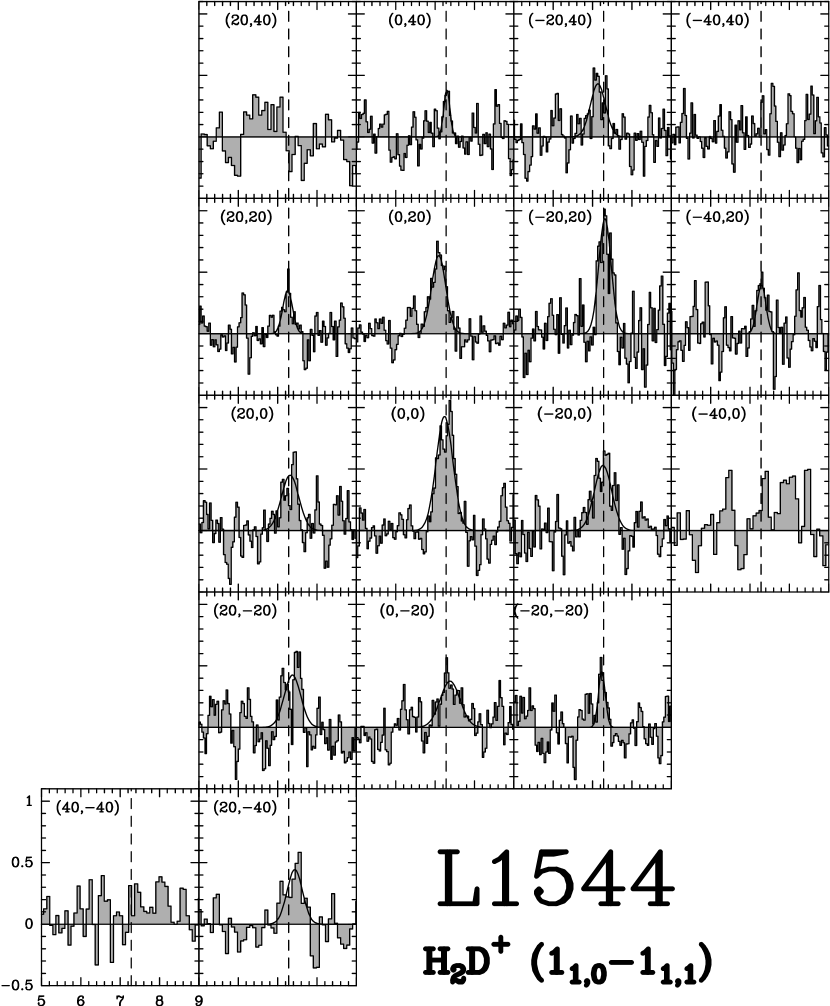
Figure 3 shows the H2D+ spectra around the central position (0′′,0′′)
of the dust peak emission.
The offset positions shown in the upper left are in arcseconds. A Gaussian fit for each detected line is plotted, using the
CLASS program, and the line parameters are presented in Table 1. A double-peak profile seems to
appear in the south-east as well as in the central part of the map.
Considering the rms value, it is only possible to say that this non Gaussian profile is localized in the central
positions around the dust peak emission. A possible interpretation could be the presence of two different layers
with different velocities along the line of sight. Another explanation could be that the observed profiles
are affected by absorption in a low-density (104 cm-3) foreground layer redshifted ( 0.08 km s-1)
relative to the high-density core, as found by (Williams et al., 1999) in the
case of N2H+(1–0) mapped at high spatial resolution. A more detailed study of the H2D+ line profile toward
the L1544 dust peak has been recently carried out by van der Tak et al. (2005), who suggested that the
observed H2D+ line, besides being broadened by the central
infall, can also be absorbed in the outer parts of the core. The presence of a central dip in the H2D+ profile of at
least four spectra across the L1544 map (see Fig. 3) favours this scenario.
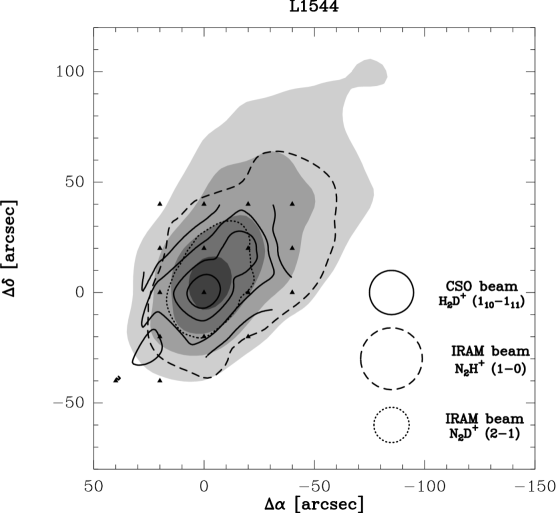
Figure 4 shows the integrated intensity map () of ortho-H2D+ (110-111), together with maps of N2H+ (1-0) and N2D+ (2-1) obtained by Caselli et al. (2002a) and the 1.3 mm continuum emission map from Ward–Thompson et al. (1999), smoothed to a resolution of 22′′. We note the close similarity between the H2D+ and the N2D+ maps and this will be discussed in the next sections. In this paper, we studied the chemistry using the maps made by Caselli et al. (2002a) in H13CO+, HC18O+, DCO+, D13CO+, C17O and C18O with the IRAM 30 m telescope.
3 Column density and abundance determinations
The observed molecular ions maps presented in Figure 4 show a general correlation, despite different
beamwidths, with the distribution of dust continuum emission, in contrast to C18O (1-0) and
C17O (1-0) (Caselli et al. 1999), which give clear evidence for depletion of CO at positions
close to the continuum peak. H2D+ (110-111), N2D+ (2-1) and to a lesser spatial extent
N2H+ (1-0) appear to trace the dust continuum. From these maps N2H+ does not seem to be
depleted at the dust peak position.
In order to compare the observed species and put constraints on chemical models, we
need to infer the column densities and abundances of H2D+ and D2H+ (defined as
for a generic species , with derived
from the 1.3 mm dust continuum emission map of Ward–Thompson et al. 1999).
Assuming LTE conditions, we can estimate the optical depth at the line center
from the observed line intensities:
| (4) |
where is the radiation temperature of a blackbody at a temperature T, and Tbg is the cosmic background temperature of 2.7 K. The column density is then given by:
| (5) |
where Q(Tex) is the partition function:
| (6) |
In the case of the H2D+ transition, gu = 9,
Aul = 1.04 10-4 s-1, Eul = 17.9 K; in the case of the D2H+ transition, gu = 9,
Aul = 4.55 10-4 s-1, Eul = 33.2 K.
Using equation 4, we can estimate the upper limit on the D2H+ main beam temperature, under the
assumption that the conditions of LTE are valid. With an excitation temperature of 8 K, the maximum
main beam temperature reaches 0.53 K, which is about the observed main beam temperature of the D2H+
tentative detection, in the case where the spatial extent is larger than the beamsize of 11′′.
The derived column densities depend on the assumed value of the excitation temperature. Within the 7–9 K
temperature range, the column density at the dust peak can vary by a factor of 2. At larger distance, considering
the increasing kinetic temperature and the decreasing molecular hydrogen density, the excitation temperature
could be as low as 6 K. However, at these positions, the H2D+ column densities should only be decreased
by a factor 2.5. Consequently we used a constant Tex for our observations as an approximation.
The corresponding line parameters and column densities are presented in Table 1. The upper limit on
the para–D2H+ column density has been
calculated using the thermal linewidth at 8 K (0.27 km s-1).
At the (0′′,0′′) position, the column densities of ortho–H2D+ and para–D2H+ are
1.8 1013 cm-2 and 2.3 1013 cm-2, respectively (see Table 1). The
abundances of species , , have been determined dividing the column densities by the associated H2
column density derived from the 1.3 mm dust continuum emission. At the dust peak, we obtain
1.510-10 and 1.810-10.
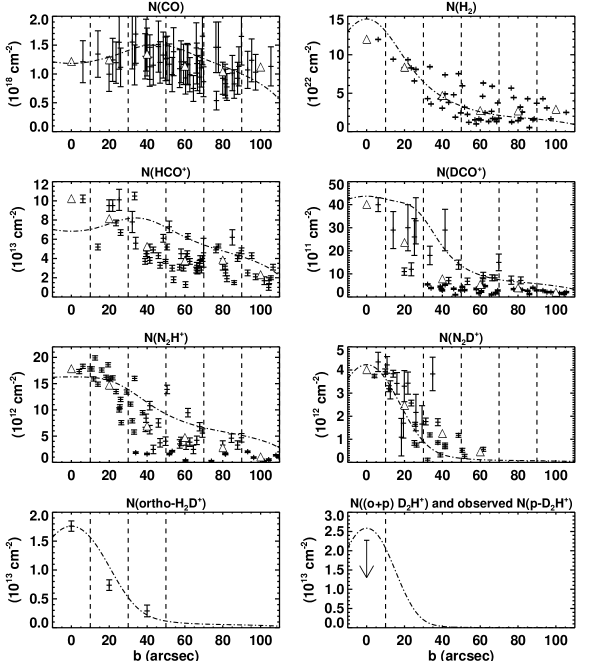
We present in Figure 6 the variation of the observed
ortho–H2D+, CO, H2, HCO+, DCO+,
N2H+, and N2D+ column densities (crosses) across the
core (as a function of the impact parameter, the projected distance
from the dust peak) as well as
an upper limit on the para–D2H+. Note that we used the ortho–H2D+ observations.
We did not use any ortho–to–para ratio to estimate the total H2D+ column density or abundance
because of the large uncertainty on this ratio. A more thorough discussion on the orth–to–para ratio for
H2D+ and D2H+ will be performed in section 4.2.2.
The observed column densities have then been averaged within the ranges delimited by the vertical dashed lines, at the
positions (2i + 1) 10” where i=0,1,2,3… and are represented by triangles. The same computation
was performed to present in Figure 7 the variation of the abundances as a function of the
distance to the core center, limited to the central 70′′ (r 9800 AU).
We will compare in section 4.1 these observations with the result from a best-fit model (dashed lines).
From Figures 6 and 7, we see that only CO is strongly depleted in the core center. Note that we used, in the CO column density computation: 16O/18O=560 (Wilson & Rood 1994), and 18O/17O=4 (Wouterloot et al. 2005; Ladd 2004). Defining the CO depletion factor, , as the ratio of the CO “canonical” abundance ([CO]/[H2] = 9.510-5; Frerking, Langer & Wilson 1982) and the observed CO abundance (N(CO)/N(H2)), Caselli et al. (1999) found = 10 toward the dust peak and concluded that the most likely explanation for the low CO abundance is the freeze–out of CO onto dust grains at high densities (n 105 cm-3). The corresponding radius of the depleted region is r 6500 AU ( 45′′).
The CO abundance is a critical parameter in the deuteration of the molecular ion H (see Figure 1).
In fact, from the abundance profiles presented in Figure 7 it is clear that the degree of deuterium
enhancement (with DCO+, N2D+, and H2D+) increases toward the dust peak emission of
L1544 where CO is highly depleted, as previously found by Caselli et al. (2002b).
N2H+ does not show any signs of depletion. It is mainly formed by interaction between H3+ and
molecular nitrogen, which is likely to be the main repository of nitrogen in the gas phase. N2 is only slightly
less volatile than CO (factor of 0.9; Öberg et al. 2005), so that the two neutrals are expected to behave similarly.
However, N2H+ is destroyed by CO (Bergin et al. 2001, 2002; Pagani et al. 2005; Aikawa et al. 2005),
so that the CO freeze–out implies a drop in the destruction rate of
N2H+, which at least partially balance the lower formation rate due
to the N2 freeze–out (see also Aikawa et al. 2001 for a discussion on
this point). In fact, N2H+ is observed to survive in the gas phase at
higher densities (106 cm-3) compared to CO
(105 cm-3). This is also confirmed by the deuterium
fractionation observed in N2H+ (0.2), about 5 times larger
than that measured in HCO+ (Caselli et al. 2002b). HCO+ is mainly
formed via H + CO and destroyed by dissociative recombination,
so that its abundance is simply reduced by the freeze–out of CO, its parent
species. From Figure 7 it seems that the HCO+ abundance
is reduced at the dust peak, and increases at larger distance.
3.1 Correlations
In Figure 8, we show the correlation between the ortho–H2D+ abundances at the 0′′, 20′′ and 40′′ distance from the dust peak and the CO depletion factor, the DCO+/HCO+ ratio and the N2D+/N2H+ ratio. As intuitively expected, the ortho-H2D+ abundance appears to be well correlated with the CO depletion factor (see Figure 1). Also, the degree of deuterium enhancement in the HCO+ and N2H+ molecules (measured from the DCO+/HCO+ and N2D+/N2H+ ratios) increases linearly with the ortho-H2D+ abundance. The parameter is calculated for the three points where the impact parameters are 0′′, 20′′ and 40′′:
| (7) |
where Xobs and Xfit are the observed and fit values of the abundance respectively, and is the uncertainty in Xobs. The associated probabilities are reported when a correlation is established. The surprisingly high confidence level for the correlations between H2D+ and the degree of deuteration in the HCO+ and N2H+ molecules (), confirms that H2D+ dominates the fractionation of these molecules at low temperatures.
4 Chemical modelling
In this section we will interpret the observations using chemical models. We will adopt a two-way strategy. First (in section 4.1), we use a full chemical model applied to a density structure derived from continuum observations to produce an overall fit to all line observations presented in the previous section. In a second step (section 4.2), we use a simplified chemical model focussing on the chemistry of H deuteration, in order to better understand the relation between CO depletion and deuteration, and even to provide some estimates of the ortho–to–para ratio in the deuterated forms of H that can be derived from our observations.
4.1 The “best–fit” model
To more quantitatively understand the column density and abundance correlations shown in Figures 6, 7 we used the model described in Caselli et al. (2002b), updated so that it now includes the multiply deuterated forms of H (as in Crapsi et al. 2005) and new values of the binding energies of CO and N2, following the measurements by Öberg et al. (2005) as well as other modifications to better account for the physical structure of the core. Briefly, the model considers a spherically symmetric cloud, with the density gradient as derived by Tafalla et al. (2002), using the 1.3 mm dust continuum emission data from Ward–Thompson et al. (1999), where the central density is = 1.4106 cm-3 (see Figure 5). The temperature profile has been included, using the recent findings of Young et al. (2004), where the temperature is about 7.5 K at the center and reaches about 12 K at the edge (see Figure 5). The chemical network contains CO, O and N2, which can freeze–out onto dust grains and desorb due to cosmic–ray impulsive heating (as in Hasegawa and Herbst 1993). The initial abundances are: (CO)=9.510-5 (cf. Frerking et al. 1982), (N2)=4.010-5 (slightly smaller than 6.610-5, the cosmic value from Snow & Witt 1996, assuming that all nitrogen is in molecular form), and (O)=(CO)/2, a factor of two less than what is typically found in gas–phase–only chemical models (e.g. Lee et al. 1996). The abundances of the molecular ions (N2H+, H3O+ and HCO+ and their deuterated forms) are calculated in terms of the instantaneous abundances of neutral species, assuming that the timescale for ion chemistry is much shorter than that for freeze–out. The electron fraction has been computed, as described in Caselli et al. (2002b), using a simplified version of the reaction scheme of Umebayashi & Nakano (1990), where the chemistry of a generic molecular ion ”mH+” is taken into account, assuming formation due to proton transfer with H and destruction by dissociative recombination with electrons and recombination on grain surfaces (using rates from Draine & Sutin 1987). The “MRN” grain size distribution has been used (Mathis, Rumpl & Nordsieck, 1977). We adopted the rate coefficients for the proton–deuteron exchange reactions recently measured by Gerlich et al. (2002). The model is run until the column density of C17O toward the core center reaches the observed value (N(C17O) = 61014 cm-2; Caselli et al. 2002b).
The “best–fit” parameters of the model, which best reproduce the observed molecular column densities at the dust peak and the observed column density and abundance profiles, are the following:
-
•
a cosmic–ray ionization rate of = 1.310-17 s-1, standard value, typically used in chemical models (since Herbst & Klemperer 1973),
-
•
binding energies for CO and N2 of (CO) = 1100 K and (N2) = 900 K, values close to the binding energies measured for CO on water ice (Collings et al. 2003); the ratio between N2 and CO binding energies (0.8) being comparable to the value (0.9) recommended by Öberg et al. (2005),
-
•
a binding energy for atomic oxygen of (O) = 750 K, used in current gas–grain chemical models (e.g. Aikawa et al. 2005),
-
•
a minimum size of the dust grains, in the MRN distribution of = 510-6 cm (10 times larger than in MRN),
-
•
a sticking coefficient of = 1.0 (Burke & Hollenbach 1983),
-
•
an initial abundance of metals (assumed to freeze–out with a rate similar to that of CO), (M+) = 10-6.
In Figures 6, 7, 8 we overlaid
the results from the best-fit model (in dashed lines), to the observations. For the H2D+ plots, we present
the ortho-H2D+ observation points, and scaled the total-H2D+ result from the model by 2.3,
the factor between the predicted and the observed value at the dust peak position (assumed constant across the core).
From this, an ortho–to–para ratio of 0.8 can be deduced for H2D+, but, considering the uncertainties
associated with this parameter (e.g. Pagani et al. 1992, Flower et al. 2005), we will postpone a discussion on this topic
in the following section, where a parameter space exploration will be presented.
For the D2H+ plot, we present the upper limit on the observed para–D2H+ compared with the
(total) D2H+ result from the model.
The ortho–H2D+ column densities and abundances observed at 0”, 20” and 40” are
well reproduced by the model, within the error bars (see Figures 6, 7).
Note that although
we need to assume a high degree of CO depletion in order to explain the CO observations, it appears that
the HCO+ column density is slightly under-estimated for the model at the dust peak emission.
However, the strong variation (factor of 2) seen in Figure 6 between 0 and
15′′ could decrease the central HCO+ column density. The discrepancy
between the HCO+ and DCO+ column densities at larger distances can
be explained by the uncertainties on the optical depth, since the less optically thick isotopes (HC18O+ and
D13CO+) have only been used for the central position. Also the beamsize for the HC18O+
observations is larger (by 50%) than the 20′′ range.
Some N2 depletion is needed in order to explain the N2H+ and N2D+
observations. Through the hyperfine structure of these species we can determine directly the optical depth
in several transitions using the relative intensities of the hyperfine satellites. This considerably reduces the
error in our computations, compared to other species like HCO+ and DCO+.
This detailed model of the ion chemistry in L1544 simulates the observed depletion in the core center, and can reproduce the observed dependency of the column densities and abundances of species such as N2H+, N2D+, HCO+, DCO+ as a function of the impact parameter. This allows us to separately discuss the relative contributions from the high-density depleted core and the lower density foreground (and background) gas.
4.2 Chemical parameter space exploration
In order to focus and analyse in detail the H2D+ chemistry,
we performed a parameter study using a model that computes the
deuterated forms of H as a function of some key parameters, like
the grain size, the age of the L1544 condensation, and the cosmic rays
ionization rate. This method has the advantage of concentrating on the
H2D+ chemistry, avoiding to reproduce other molecular observations.
Before discussing the comparison of the theoretical
predictions with the observations, we give a short description of the
model used.
It is an adaptation of the Ceccarelli & Dominik
(2005) model, which has been developed for the proto-planetary disks.
It computes the H, H2D+, D2H+ and D abundances
in cold and dense gas. Since the involved temperatures ( K)
and densities ( cm-3) are very similar to those found
around L1544, the model can be used directly, by just changing the
geometry. For an easy and straightforward comparison with the
observations we compute the H chemistry in a gas cube with a
given density and temperature. The relative abundances of the H
deuterated forms are computed solving the charge equilibrium equations
and the deuterium chemistry equations.
In this model we also consider grains as a
possible source of H, H2D+, D2H+ and D
destruction. In practice, the larger the CO depletion, the larger the
H2D+/H and D2H+/H2D+ ratios.
Two factors
(other than the dust temperature) can modify the CO depletion : the age of the
condensation (larger ages give larger CO depletions because the
molecules have more time to freeze out onto the grains), and the gas
density (the condensation rate is proportional to the gas density).
In addition, the cosmic ray ionization rate regulates the overall
ionization degree in the condensation, and therefore the H
isotopomers abundances. Finally, the grain sizes enter both in the CO
condensation rate (via the grains area), and in the charge balance,
because negatively charged grains recombine with the positively charged
molecular ions. In this model, we adopted the same parameters
(binding energy for CO and N2, sticking coefficient)
chosen for our best-fit model (see section 4.1).
4.2.1 H2D+ and D2H+ versus CO depletion
In Figure 9, we present the results of the model, varying the three key parameters of the model
(cosmic ionization rate, the grain radius and the age of the core) in order to reproduce the total (ortho + para)
H2D+ and D2H+ abundances. We plot the abundances as a function of depletion because
this parameter is more directly observed (via CO column density and dust continuum observations) than the gas
density. We also make a comparison with the observations of
ortho–H2D+ and para–D2H+ to get an insight into the deuterium chemistry of H.
We fixed the temperature of the cloud in the model to 8 K, which is within the range found from molecular and dust
measurements. For comparison we also ran the cases with a temperature of 10 K and did not find any substantial difference.
The free-fall time is approximately 3 104 years for a density of about 106 cm-3. In
presence of a magnetic field, the collapse time is about an order of magnitude larger (Ciolek & Basu 2000).
We will vary the age between 104 to 106 years, the latter being close to the lifetime
of a starless core. In our calculations, we assumed all the grains in the cloud to have the same size, but we investigated the
result for different values of the grain radius. A grain size of 0.1 m is the typical value assumed in
chemical models for the interstellar medium, where it follows the MRN distribution.
In the upper plot of Figure 9 we used a standard cosmic ionisation rate of
3 10-17 s-1, a typical age of 105 years and
varied the dust grain averaged sizes between 0.05 m and 0.2 m.
In the middle plot we fixed the age to 105 years, the grain size to 0.1 m and varied the cosmic ionization
rate between 3 10-18 to 3 10-16 s-1.
In the lower plot we fixed the grain size to 0.1 m, the cosmic ionization rate to 3 10-17 s-1 and varied
the age of the cloud between 104 and 106 years.
The observation points (or upper limit in the case of D2H+) and their corresponding error bars are supperposed
in these plots: ortho–H2D+ on the left side and para–D2H+ on the right side.
As the grain size increases while the total grain mass is conserved, the abundance of grains relative to H2 decreases , and also the grain surface area per H2 decreases . As this effect slows down the freezeout of CO, the same CO depletion is therefore reached either after a longer time, or at a higer density. Since we keep the age constant, the effect of the density is observed in Figure 9: larger grain sizes correspond to higher densities, at which the overall degree of ionization is smaller. Since H2D+ is the dominating ion, this is directly mirrored in the H2D+ abundance. Also, decreasing the cosmic ionization rate leads to a decrease in the abundances. Indeed, H3+ ions (and consequently their deuterated forms) are formed by the ionization of H2 due to cosmic rays. And finally, increasing the age of the cloud will increase their abundances, as the CO depletion rate is time dependant. Consequently, for a more evolved cloud the same CO depletion is achieved for lower densities, corresponding to a higher degree of ionization, which is again directly reflected in the H2D+ and D2H+ abundances.
4.2.2 The ortho and para forms
Both H2D+ and D2H+ molecules have ortho and para forms, corresponding to the spin states
of the protons (for H2D+) or deuterons (for D2H+). In order to compare the modeled abundances
with the observations of one spin state only, it is critical to know the ortho–to–para ratio for these two molecules.
Under LTE conditions, at temperature T, the relative populations of the lowest ortho (11,1) and para (00,0)
levels of H2D+ would be:
| (8) |
and the relative populations of the lowest ortho (00,0) and para (10,1) levels of D2H+ would be:
| (9) |
With these formulae, at 8 K, the H2D+ ortho–to–para ratio would be 1.8 10-4 and the
D2H+ para–to–ortho ratio would be 2.8 10-3. The ortho form of H2D+ is
produced mainly in reactions of the para form with ortho–H2 (e.g. Gerlich, Herbst & Roueff 2002).
Therefore, its high o/p ratio is attributable to the relatively high ortho–H2 abundance as first noticed by
Pagani et al. (1992) . Because the o/p ratio
is not thermalized at the low temperature considered here, the o/p H2D+ ratio is not thermalized either.
This can be illustrated in Flower, Pineau des Forêts, Walmsley (2004) model where, at temperatures lower than
10 K, a hydrogen density of 2 106 cm-3 and a grain size of 0.1 m, the o/p–H2D+
reaches unity and the p/o–D2H+ value is about 0.1. Increasing the grain size will decrease the grain surface,
leading to a decrease of the H2 formation rate. Therefore, the H2 ortho–to–para ratio will obsiously decrease,
as well as the H2D+ ortho–to–para ratio.
From our observations we find that para–D2H+/ortho–H2D+ is less than 1.3 at the dust peak emission assumed to be at 8 K. In the prestellar core 16293E (Vastel et al., 2004) we measured a para–D2H+/ortho–H2D+ of 0.75 for an excitation temperature of 10 K. We also computed the H2D+ ortho–to–para ratio and an upper limit on the D2H+ para–to–ortho ratio by comparing the observed abundances of ortho–H2D+ and para–D2H+ with the total (ortho + para) abundances of H2D+ as calculated using the model described in the previous section. In Table 2, the ortho–to–para ratio for H2D+ and the para–to–ortho ratio for D2H+ are quoted in order to reproduce the values obtained by the model for different sets of parameters, which are the cosmic ionization rate, the age of the core and the grain radius. We can directly compare our results on H2D+ with the Flower, Pineau des Forets, Walmsley (2004) model, even if their study assumes complete depletion (i.e. that CO abundance should be less than 10-6). Indeed the abundance of both ortho and para spin states of H2D+ depends on the ortho and para forms of molecular hydrogen (through the proton-exchanging reaction of H3+ with H2 followed by reaction 1) which does not vary as a function of depletion. On the contrary, the abundance of both para and ortho forms of D2H+ is determined by reactions with HD (produced on the grain surfaces) and will therefore depend on the core depletion. The Flower et al. model predicts H2D+ ortho–to–para ratios larger than the maximum value of 0.3 we observed for a temperature of 8 K and a H2 density of 2 106 cm-3 (Pineau des Forets, private communication) spanning ranges up to 0.4 m of the grain radius. As a consequence, since the H2D+ ortho–to–para ratio decreases as a function of the grain radius, it is likely that this should be larger than 0.3 m. This depletion of small grains in this core is consistent with grain coagulation since ice condensation is not enough to increase the grain radius.
5 Conclusions and Perspectives
In this paper we studied the prestellar core L1544, focusing on the H2D+ chemistry
throughout the cloud. It is now widely accepted that the H2D+ molecule is the main tracer of the
CO depleted prestellar cores, and we point out in this paper that the H2D+ emission is extended
(over 60′′), and an excellent tracer of the dust continuum, with a emitting radius
of about 7,000 AU in the case of L1544. Hence, the line profile of this molecule would provide a crucial
guide to the dynamical behavior of the high-density core. It is likely that the double-peak profile found
in the central position, as well as positions around, is broadened by the central infall and is absorbed in the
outer parts of the core (van der Tak et al., 2005).
We first used a model of the ion chemistry coupled with the physical structure of the core of L1544,
including the deuterated isotopologues of the H3+ ion. This simulates the observed depletion
and can approximatively reproduce the observed dependence of the column densities of species like
N2H+, N2D+, HCO+, DCO+, H2D+ as a function of radius.
This study reveals a correlation between the ortho–H2D+ abundance and 1) the
CO depletion factor, 2) the degree of deuteration in the HCO+ molecule, 3) the degree of deuteration
in the N2H+ molecule. H2D+ will survive longer, at higher density than
N2H+ and N2D+.
We then used a simpler model focusing on the H2D+ chemistry where we did a wide parameter study.
We discuss how the H2D+ and D2H+ abundances depend
on the cosmic ionization rate, the age of the core, and the grain radius, by varying these parameters.
It appears that the most important parameters to reproduce the observed values is the grain radius
as small grains accelerate the freeze-out of CO and the observed values are consistent with a freeze-out rate
dominated by larger grains. Therefore, we found that to reproduce the observations we need a larger grain
radius of 0.3 m.
This study can be considered as a springboard for observations to come, since the current
observations are limited by the poor atmospheric transmission at the relevant frequencies.
Table 3 lists some of the major telescopes and interferometers that can be used for
the study of H2D+ chemistry in prestellar cores, proto-planetary disks and protostars.
Probably, D3+ can not be observable because enhanced D3+ abundance implies
very cold and very dense regions. Since D3+ is a symmetric molecule, it does not have
rotational transitions and does have its bending modes are in the near infrared. Therefore, these transitions
will only be observable in absorption against a strong near infrared continuum. H2D+ and
D2H+ are hence the only tracers of cold, dense phases of molecular clouds prior to star
formation.
References
- Aikawa et al. (2001) Aikawa, Y., Ohashi, N., Inutsuka, S.-i., Herbst, E., & Takakuwa, S. 2001, ApJ, 552, 639
- Aikawa et al. (2005) Aikawa, Y., Herbst, E., Roberts, H., & Caselli, P. 2005, ApJ, 620, 330
- Alves et al. (1999) Alves, J., Lada, C.J. & Lada, E.A., 1999, ApJ, 515, 265
- Amano & Hirao (2005) Amano, T, & Hirao, T., 2005, J. Mol. Spectroscopy, 233, 7
- André et al. (2000) André, P., Ward-Thompson & D., Barsony, M., 2000, in Protostars and Planets IV, ed. Mannings, V., Boss, A.P., Russel, S.S.
- Bacmann et al. (2002) Bacmann, A., Leffloch, B., Ceccarelli, C., Castets, A., Steinacker, J., & Loinard, L., 2002, A&A 389, 6
- Bacmann et al. (2003) Bacmann, A., Lefloch, B., Ceccarelli, C., Steinacker, J., Castets, A., & Loinard, L. 2003, ApJ, 585, L55
- Bergin & Langer (1997) Bergin, E.A. & Langer, W.D., 1997, ApJ 486, 316
- Bergin et al. (2001) Bergin, E., Ciardi, D, Lada, C.J., Alves, J., & Lada, E.A., 2001, ApJ 557, 209
- Bergin et al. (2002) Bergin, E. A., Alves, J., Huard, T., & Lada, C. J. 2002, ApJ, 570, L101
- Burke & Hollenbach (1983) Burke, J. R., & Hollenbach, D. J. 1983, ApJ, 265, 223
- Butner, Lada & Loren (1995) Butner, H. M. and Lada, E. A. & Loren, R. B., 1995, ApJ, 448, 207
- Caselli et al. (1999) Caselli, P., Walmsley, C.M., Tafalla, M., Dore, L., & Myers, P.C., 1999, ApJ 523, L165
- Caselli et al. (2002a) Caselli, P., Walmsley, C.M., Zucconi, A., Tafalla, M., Dore, L. & Myers, P.C., 2002, ApJ 565, 331
- Caselli et al. (2002b) Caselli, P., Walmsley, C.M., Zucconi, A., Tafalla, M., Dore, L. & Myers, P.C., 2002, ApJ 565, 344
- Caselli et al. (2002) Caselli, P., Stantcheva, T., Shalabiea, O., Shematovich, V. & Herbst, E., 2002, P&SS 50, 1257
- Caselli et al. (2003) Caselli, P., van der Tak, F., Ceccarelli, C. & Bacmann, A., 2003, A&A 403, L37
- Ceccarelli & Dominik (2005) Ceccarelli, C., & Dominik, C. 2005, A&A, 440, 583
- Charnley (1997) Charnley, S.B., 1997, MNRAS 291, 455
- Ciolek & Basu (2000) Ciolek, G. E., & Basu, S. 2000, ApJ, 529, 925
- Collings et al. (2003) Collings, M. P., Dever, J. W., Fraser, H. J., McCoustra, M. R. S., & Williams, D. A. 2003, ApJ, 583, 1058
- Crapsi et al. (2004) Crapsi, A., Caselli, P., Walmsley, C. M., Tafalla, M., Lee, C. W., Bourke, T. L., & Myers, P. C. 2004, A&A, 420, 957
- Crapsi et al. (2005) Crapsi, A., Caselli, P., Walmsley, C. M., Myers, P. C., Tafalla, M., Lee, C. W., & Bourke, T. L. 2005, ApJ, 619, 379
- Dalgarno & Lepp (1984) Dalgarno, A., & Lepp, S. 1984, ApJ, 287, L47
- Draine & Sutin (1987) Draine, B. T., & Sutin, B. 1987, ApJ, 320, 803
- Evans et al. (2001) Evans, N.J. II, Rawlings, J.M.C., Shirley, Y. & Mundy, L.G., 2001, ApJ 557, 193
- Flower et al. (2004) Flower, D.R., Pineau des Forets, G. & Walmsley, C.M., 2004, A&A 427, 887
- Flower et al. (2005) Flower, D. R., Pineau Des Forêts, G., & Walmsley, C. M. 2005, A&A, 436, 933
- Frerking et al. (1982) Frerking, M. A., Langer, W. D., & Wilson, R. W. 1982, ApJ, 262, 590
- Gerlich et al. (2002) Gerlich, D., Herbst, E., & Roueff, E. 2002, Planet. Space Sci., 50, 1275
- Hasegawa & Herbst (1993) Hasegawa, T. I., & Herbst, E. 1993, MNRAS, 263, 589
- Herbst & Klemperer (1973) Herbst, E., & Klemperer, W. 1973, ApJ, 185, 505
- Hirao & Amano (2003) Hirao, T. & Amano, T., 2003, ApJ 597, L85
- Hirota et al (.) Hirota, T., Ikeda, M., & Yamamoto, S. 2003, ApJ, 594, 859
- Jessop & Ward-Thompson (2001) Jessop, N.E., Ward-Thompson, D., 2001, MNRAS 323, 1025
- Kirk et al. (2005) Kirk, J.M., Ward-Thompson, D., & André, P., 2005, accepted in MNRAS
- Kramer et al. (1999) Kramer, C., Alves, J., Lada, C.J., Lada, E.A., et al., 1999, A&A 342, 257
- Ladd (2004) Ladd, E. F. 2004, ApJ, 610, 320
- Lee et al. (2003) Lee, J.-E., Evans, N. J., Shirley, Y. L., & Tatematsu, K. 2003, ApJ, 583, 789
- Linsky (2003) Linsky, J.L., 2003, Space Science Review 106, 49
- Lis et al. (2002) Lis, D. C., Roueff, E., Gerin, M., Phillips, T. G., Coudert, L. H., van der Tak, F. F. S., & Schilke, P. 2002, ApJ, 571, L55
- Loinard et al. (2001) Loinard, L., Castets, A., Ceccarelli, C., Caux, E., & Tielens, A. G. G. M. 2001, ApJ, 552, L163
- Mathis, Rumpl & Nordsieck (1977) Mathis, J. S., Rumpl, W., & Nordsieck, K. H. 1977, ApJ, 217, 425
- Öberg et al. (2005) Öberg, K. I., van Broekhuizen, F., Fraser, H. J., Bisschop, S. E., van Dishoeck, E. F., & Schlemmer, S. 2005, ApJ, 621, L33
- Pagani et al. (1992) Pagani, L., Salez, M., & Wannier, P. G. 1992, A&A, 258, 479
- Pagani et al. (2005) Pagani, L., Pardo, J.-R., Apponi, A. J., Bacmann, A., & Cabrit, S. 2005, A&A, 429, 181
- Parise et al. (2004) Parise, B., Castets, A., Herbst, E., Caux, E., Ceccarelli, C., Mukhopadhyay, I., & Tielens, A. G. G. M., 2004, A&A, 416, 159
- Phillips & Vastel (2003) Phillips, T.G. & Vastel, C., 2003, in ”Chemistry as a diagnostic of star formation”, ed. C. Curry & M. Fish, astro-ph/0211610
- Redman et al. (2002) Redman, M. P., Rawlings, J. M. C., Nutter, D. J., Ward-Thompson, D., & Williams, D. A., 2002, MNRAS, 337, L17
- Roberts & Millar (2000) Roberts, H. & Millar, T.J., 2000, A&A 361, 388
- Roberts, Herbst & Millar (2003) Roberts, H., Herbst, E. & Millar, T.J., 2003, ApJ 591, 41
- Roberts et al. (2004) Roberts, H., Herbst, E., & Millar, T. J. 2004, A&A, 424, 905
- Roueff et al. (2000) Roueff, E., Tiné, S., Coudert, L. H., Pineau des Forêts, G., Falgarone, E., & Gerin, M. 2000, A&A, 354, L63
- Tafalla et al. (1998) Tafalla, M., Mardones, D., Myers, P. C., Caselli, P., Bachiller, R., & Benson, P. J. 1998, ApJ, 504, 900
- Tafalla et al. (2002) Tafalla, M., Myers, P. C., Caselli, P., Walmsley, C. M., & Comito, C. 2002, ApJ, 569, 815
- Tafalla et al. (2004) Tafalla, M., Myers, P. C., Caselli, P., & Walmsley, C. M. 2004, A&A, 416, 191
- Tafalla & Santiago (2004) Tafalla, M., & Santiago, J. 2004, A&A, 414, L53
- Tiné et al. (2000) Tiné, S., Roueff, E., Falgarone, E., Gerin, M., & Pineau des Forêts, G. 2000, A&A, 356, 1039
- Umebayashi & Nakano (1990) Umebayashi, T., & Nakano, T. 1990, MNRAS, 243, 103
- van der Tak et al. (2002) van der Tak, F. F. S., Schilke, P., Müller, H. S. P., Lis, D. C., Phillips, T. G., Gerin, M., & Roueff, E. 2002, A&A, 388, L53
- van der Tak et al. (2005) van der Tak, F. F. S., Caselli, P., & Ceccarelli, C. 2005, A&A, 439, 195
- Vastel et al. (2003) Vastel, C., Phillips, T. G., Ceccarelli, C., & Pearson, J. 2003, ApJ, 593, L97
- Vastel et al. (2004) Vastel, C., Phillips, T.G., & Yoshida, H., ApJL 606, 127
- Walmsley et al. (2004) Walmsley, C. M., Flower, D. R., & Pineau des Forêts, G. 2004, A&A, 418, 1035
- Ward-Thompson, Motte, André (1999) Ward-Thompson, D., Motte, F., & André, P., 1999, MNRAS 305, 143
- Willacy et al. (1998) Willacy, K., Langer, W., & Velusamy, T., 1998, ApJ 507, 171
- Williams et al. (1998) Williams, J. P., Bergin, E. A., Caselli, P., Myers, P. C., & Plume, R. 1998, ApJ, 503, 689
- Williams et al. (1999) Williams, J., Myers, P., Wilner, D., & Di Francesco, J., 1999, ApJ 513, L61
- Wilson & Rood (1994) Wilson, T. L., & Rood, R. 1994, ARA&A, 32, 191
- Wouterloot et al. (2005) Wouterloot, J. G. A., Brand, J., & Henkel, C. 2005, A&A, 430, 549
- Young et al. (2004) Young, K. E., Lee, J.-E., Evans, N. J., Goldsmith, P. F., & Doty, S. D. 2004, ApJ, 614, 252
- Zucconi et al. (2001) Zucconi, A., Walmsley, C. M., & Galli, D. 2001, A&A, 376, 650


| Position | rms | VLSR | v | Tmbv | N(o-H2D+) | tau | |
| (′′) | (K) | km s-1 | km s-1 | km s-1 | mK km s-1 | cm-2 | |
| (0,0) | 0.11 | 7.277(0.016) | 0.039 | 0.50(0.03) | 495(33) | 1.78(0.10) 1013 | 0.58(0.05) |
| (20,0) | 0.12 | 7.319(0.045) | 0.039 | 0.52(0.12) | 255(37) | 7.77(1.01) 1012 | 0.24(0.04) |
| (0,-20) | 0.10 | 7.382(0.040) | 0.039 | 0.59(0.09) | 232(33) | 6.92(0.90) 1012 | 0.19(0.03) |
| (-20,0) | 0.13 | 7.269(0.033) | 0.039 | 0.52(0.06) | 293(40) | 9.14(1.10) 1012 | 0.29(0.05) |
| (-20,-20) | 0.11 | 7.238(0.023) | 0.039 | 0.20(0.06) | 98(20 ) | 2.99(0.58) 1012 | 0.24(0.05) |
| (-40,0) | 0.13 | 0.077 | 49 | 1.46 1012 | |||
| (-40,20) | 0.12 | 7.294(0.035) | 0.039 | 0.27(0.07) | 115(26) | 3.45(0.73) 1012 | 0.21(0.05) |
| (-20,20) | 0.21 | 7.316(0.018) | 0.039 | 0.37(0.04) | 386(54) | 1.28(0.15) 1013 | 0.58(0.10) |
| (0,20) | 0.08 | 7.094(0.015) | 0.039 | 0.43(0.04) | 288(22) | 9.27(0.62) 1012 | 0.35(0.03) |
| (20,20) | 0.09 | 7.256(0.026) | 0.039 | 0.29(0.08) | 111(15) | 3.30(0.57) 1012 | 0.19(0.03) |
| (0,40) | 0.11 | 7.300(0.024) | 0.039 | 0.18(0.05) | 75(20) | 2.24(0.55) 1012 | 0.20(0.03) |
| (-20,40) | 0.12 | 7.138(0.032) | 0.039 | 0.45(0.09) | 206(34) | 6.24(0.94) 1012 | 0.23(0.04) |
| (-40,40) | 0.10 | 0.039 | 27 | 4.52 1012 | |||
| (20,-20) | 0.14 | 7.378(0.040) | 0.039 | 0.49(0.06) | 224(42) | 6.79(1.15) 1012 | 0.23(0.04) |
| (20,40) | 0.12 | 0.077 | 46 | 1.27 1012 | |||
| (20,-40) | 0.11 | 7.436(0.054) | 0.077 | 0.46(0.10) | 215(45) | 6.55(1.23) 1012 | 0.23(0.04) |
| (40,-40) | 0.12 | 0.077 | 46 | 1.27 1012 | |||
| Position | rms | VLSR | v | Tmbv | N(p-D2H+) | tau | |
| (0,0) | 0.072 | 7.290(0.007) | 0.021 | 0.27 | 103 | 2.27 1013 | 1.13 |
| parameters | H2D+ | D2H+ | ||
|---|---|---|---|---|
| cosmic ionization rate | age | grain radius | ||
| (s-1) | (years) | (m) | ||
| 3 10-17 | 105 | 0.05 | 0.02 | 1.07 |
| 3 10-17 | 105 | 0.1 | 0.03 | 0.15 |
| 3 10-17 | 105 | 0.2 | 0.08 | 0.55 |
| 3 10-16 | 105 | 0.1 | 0.03 | 0.29 |
| 3 10-18 | 105 | 0.1 | 0.07 | 0.29 |
| 3 10-17 | 104 | 0.1 | 0.07 | 0.29 |
| 3 10-17 | 106 | 0.1 | 0.03 | 0.29 |
| 3 10-17 | 105 | 0.3 | 0.17 | 0.63 |
| 3 10-17 | 105 | 0.4 | 0.32 | No solution |
| 3 10-18 | 105 | 0.4 | 0.33 | 11.81 |
| 3 10-17 | 104 | 0.4 | 0.33 | 11.81 |
| Name | Aperture | Platform | Available | H2D+ | D2H+ | ||
|---|---|---|---|---|---|---|---|
| 11,0–11,1 | 10,1–00,0 | 11,0–10,1 | 11,1–00,0 | ||||
| (372.4 GHz) | (1.37 THz) | (691.7 GHz) | (1.48 THz) | ||||
| CSO | 10.4 m | Mauna Kea (USA) | Y | Y | N | Y | N |
| JCMT | 15 m | Mauna Kea (USA) | Y | HARP B | N | Y | N |
| SOFIA | 2.5 m | Airborne (747) | 2007 | N | Casimir | Casimir | Casimir |
| GREAT (CONDOR) | GREAT (CONDOR) | ||||||
| Herschel (HIFI) | 3.5 m | Space (L2) | 2007 | N | N | Y | Y |
| ALMA | 50 12 m | Atacama (Chile) | 2010 | Y | N | Y | N |
| APEX | 12 m | Atacama (Chile) | 2005-2006 | Y | CONDOR | Y | CONDOR |