3D spectroscopy with VLT/GIRAFFE - II: Are Luminous Compact Galaxies merger remnants ?††thanks: Based on observations collected at the European Southern Observatory, Paranal, Chile, ESO Nos 71.A-0322(A) and 72.A-0169(A)
Luminous Compact Galaxies are enigmatic sources by many aspects. They can reach the luminosity of the Milky Way within a radius of only a few kpc. They also represent one of the most rapidly evolving populations of galaxies since they represent up to 1/5 of the luminous galaxies at redshift while being almost absent in the local Universe. The measurement of their dynamics is crucial to our understanding of LCGs since this has the potential of telling us which physical process(es) that drives them, and ultimately to link them to the existing present-day galaxies. Here we derive the 3 dimensional velocity fields and velocity dispersion () maps of 17 Luminous Compact Galaxies selected from the Canada France Redshift Survey and the Hubble Deep Field South with redshifts ranging from z=0.4 to z=0.75. We find that only 18% of them show rotational velocity fields typical of rotating disks, the others showing more complex kinematics. Assuming that LCGs are not too far from equilibrium, about half of LCGs then appear to be either non-relaxed objects, or objects that are not supported by velocity dispersion alone. This supports the view that an important fraction of LCGs are probably mergers. It brings additional support to the “spiral rebuilding scenario” in which LCGs correspond to a previous or post-merger phase before the disk re-building.
Key Words.:
Galaxies: evolution, Galaxies: formation , Galaxies: kinematics and dynamics , Galaxies: bulges1 Introduction
Luminous Compact Galaxies (LCGs) (, kpc and 15Å) correspond to the most rapidly evolving population seen in the UV (Lilly et al. 1998): they represent 20% of the galaxies (Zheng et al. 2005), 50% of the emission line galaxies (see Paper I, Flores et al. 2006) and almost vanish in the local Universe, with their number density decreasing by factors 7–10 (Jangren et al. 2004; Garland et al. 2003; Werk et al. 2004). Moreover, LCGs contribute to 40–50% of the increase in the cosmic Star Formation Rate (SFR) density between z=0 and 1 as measured from rest frame UV luminosities (Lilly et al. 1995; Guzman et al. 1997) and 25% in the IR (Zheng et al. 2004). The spectra of LCGs reveal a mixture of old, intermediate and young stellar populations (Hammer et al. 2001). Apart from their compactness, LCGs have properties surprisingly similar to those of other, more extended luminous IR galaxies and starbursts: They show a similar mix of stellar populations, extinction property distributions, stellar masses and SFRs (Hammer et al. 2005). This led Hammer et al. (2001) to propose that LCGs are the progenitors of present-day bulges of early type spirals.
Recently, Hammer et al. (2005) proposed the so-called “spiral rebuilding scenario” to explain the formation of the 75% most massive local spirals. This scenario is composed of 3 major phases: a “pre-merger phase” during which two distant spirals merge, the “LCG phase” where all material from the progenitors fall into the mass barycenter of the system and form a bulge, and the “disk growing phase” where subsequently accreted material form a rotating disk. This scenario is partly supported by Östlin et al. (1999 and 2001) who obtained very complex H velocity fields for local LCGs, characteristic of what is expected from merging galaxies. Another alternative is the one proposed by Barton and Van Zee (2001): comparing HI and optical emission line widths of nearby LCGs candidates they argued that interactions and minor mergers of disk galaxies may cause apparently compact morphology leading too to the formation of a bulge. Both views are not incompatible and can occur during different stages of the “LCG phase” described by Hammer et al. (2005).
Compact galaxies have been extensively studied in the past. Koo et al. (1995) were the first to propose that some compact galaxies could be the progenitors of local dwarf ellipticals (dE), assuming that they experience a dramatic event of star formation before fading away by up to 5 magnitudes. Guzman et al. (1997) established a distinction between two types of compact galaxies: 60% present properties characteristic of young star-forming HII galaxies (in e.g. velocity widths, SFRs and mass-to-light ratios), whereas the remaining 40% constitute a more heterogeneous class of evolved starbursts, similar to local starburst disk galaxies. Philips et al. (1997) then suggested that the HII-like compact galaxies are the best candidates to evolve into dEs. In this paper we study the most Luminous and most actively star forming fraction of the population of Compact Galaxies (LCGs), i.e. those which contribute most to the increase in the star formation rate density. It is important here to stress that the sample presented in this paper correspond to the brightest 25% of galaxies in the sample of Blue Compact Galaxies (BCGs) in the Hubble Deep Field (HDF) at studied by Guzman et al. (1997)111They defined a compact galaxy as arcsec and mag.arcsec-2., and would have mostly been classified as SB-disk like compact galaxies following their criteria. They thus do not correspond to the sub-class of compact galaxies for which Guzman et al. (1997) would have considered as possible progenitors of dEs. Notice that for another sub-class of compact galaxies, Philips et al. (1997) found that “one possibility is that they are disks forming from the center outward, and so the radius of the luminous material and enclosed mass are small compared to present-day spirals”.
Whereas the LCGs are important for understanding galaxy evolution since , their nature is thus still enigmatic. The aim of this paper is to evaluate the nature of their kinematics from a survey of 17 LCGs randomly selected from the CFRS and the HDF-South (HDFS) field at redshifts from 0.4 to 0.75, and to investigate if their dynamics is supported either by rotation or velocity dispersion. This will help in distinguishing a merger scenario from a dwarf elliptical experiencing a 5 magnitude brightening. Section 2 present the sample, observations and the methodology we followed. Kinematical and dynamical results are in section 3 and 4. We discuss our results in section 5 and a conclusion is given in section 6. In the following, we assumed a -CDM cosmology with , , and .
2 Sample, observations & methodology
To select compact galaxies, we used Hubble Space Telescope (HST) images in the F814W filter (WFPC2, 0.1 arcsec/pix; and ACS, 0.05 arcsec/pix) in the CFRS (3hr and 22hr fields) and the HDFS field. For one galaxy, however, we used ground-based images obtained by the CFRS team at the CFHT (0.207 arcsec/pix, see Hammer et al. 2001).
We selected 21 LCGs with , following the procedure detailed in Hammer et al. (2001), using the light concentration parameter as a compactness criterion which measures the difference between the luminosities within the 5 and 15 kpc radii (see Table 1). The condition allows to select galaxies with kpc in a homogeneous way. This value corresponds to kpc in a -CDM cosmology at . To achieve a homogeneous selection, ACS images were degraded and re-sampled to the WFPC2 quality using a point spread function (PSF) generated with the Tiny Tim software. This size criterion ensures the selection of relatively small galaxies (see Ravindranath et al. 2004), although not necessarily as compact as those selected by some other authors (e.g. Guzman et al. 1997). Half light radii were then derived by interpolating luminosities enclosed within concentric ellipses using the IRAF polyphot task (see Hammer et al. 2001 for a complete description of the procedure). Inclinations were estimated using Sextractor (Bertin et al. 1996) and the ellipse task of IRAF: we find a mean absolute difference of degrees between these two methods. Independent measurements were also done by eye and gave similar results as Sextractor to within degrees. In the following, we will use the estimates from Sextractor and assume an error of degrees.
As part of the Guaranteed Time Observations (GTO) of the Paris Observatory, we obtained observations with the FLAMES/GIRAFFE instrument of the 21 compact galaxies using the deployable integral field units (IFUs), each covering an area of 3 by 2 arcsec2, at 0.52 arcsec/pixel. The complete description of the GTO sample is given in Paper I (Flores et al. 2006). Briefly, we used LR04 and LR05 setups targeting the [OII] doublet (R), integration times ranging from 8 to 13 hours and the seeing was typically arcsec during all the observations. Data cubes were reduced using the GIRBLDRS v1.12 package (Blecha et al. 2000), including narrow flat-fielding. Sky was carefully subtracted with our own IDL procedures.
Among these 21 compact galaxies, we selected 17 galaxies for which at least 4 pixels had [OII] doublet reaching a spectral signal to noise ratio (SNR) of 4 (see definition in Paper I). In the following we focus only on these 17 remaining LCGs (see Table 1). At first sight, it might seem too challenging to derive velocity fields of compact galaxies ( 0.5 arcsec), using the GIRAFFE/IFU with 0.52 arcsec microlenses. To assess this we examine how many pixels that reach an integrated SNR of 3. Among the sample of LCGs, we found a median value of 11 pixels ( 3 arcsec2) compared to 16 ( 4.3 arcsec2) for a sample of 8 spirals of Paper I (Flores et al. 2006). On average our LCGs are thus 30% less extended than spirals. However, the average filling factor of the IFU (20 pixels) for the sample of 17 LCGs is 55 %, which is sufficient to explore the kinematics of these galaxies.
We processed the spectra with a Savitzky-Golay filtering, which has the advantage over the widely used box smoothing that it conserves the first moment of spectral lines (Press et al. 1989). We identified the [OII] doublet by visual inspection and retained the spectra that reached a sufficient spectral SNR of 3. We then fitted a double Gaussian with the following constraints (where the subscripts denote the two components of the fit): -=2.783 (in rest frame wavelength) and =. The line ratio was allowed to vary freely except when the fit failed: in these cases we forced the line ratio to a value of 1.4 which was the median value observed in our integrated spectra. This occurs for pixels with rather low SNR and affects 10 % of the measured pixels and will thus not significantly affect our results. In all such cases, we checked by eye that the derived fit was acceptable and took this into account during the classification (see below). The complete procedure is described in Paper I.
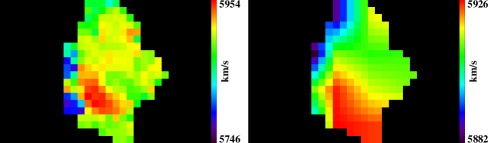
Figure 1 shows velocity and velocity dispersion () maps for the 17 LCGs. The -maps were corrected for the instrumental broadening using sky lines. To make the interpretation easier, velocity fields and -maps are presented after a simple 5x5 linear interpolation.
| ID | z | I | M | M | r | id | |
|---|---|---|---|---|---|---|---|
| HDFS4170 | 0.4602 | 20.79 | -20.43 | -22.60 | 0.56 | 3.57 | 51 |
| HDFS5190 | 0.6952 | 21.31 | -21.25 | -21.92 | 0.60 | 4.07 | 59 |
| CFRS03.0619 | 0.4854 | 20.80 | -20.67 | -21.93 | 0.63 | 3.87 | 27 |
| CFRS03.1032 | 0.6180 | 20.49 | -21.18 | -22.64 | 0.51 | 1.79 | 37 |
| CFRS22.0619 | 0.4676 | 21.55 | -19.33 | -19.33 | 0.70 | 4.31 | 68 |
| CFRS03.1349 | 0.6155 | 20.87 | -21.19 | -22.92 | 0.56 | 3.84 | 48 |
| CFRS22.1064 | 0.5383 | 22.08 | -19.87 | -21.64 | 0.24 | 2.36 | 49 |
| HDFS5150 | 0.6956 | 22.36 | -20.20 | -21.03 | 0.72 | 3.39 | 42 |
| CFRS03.0508 | 0.4642 | 21.92 | -19.61 | -20.35 | 0.46 | 3.32 | 38 |
| CFRS03.0645 | 0.5275 | 21.36 | -20.30 | -21.34 | 0.71 | 4.57 | 45 |
| CFRS22.0919 | 0.4738 | 21.77 | -19.99 | -19.53 | 0.41 | 2.52 | 61 |
| CFRS22.0975 | 0.4211 | 20.21 | -20.40 | -22.53 | 0.59 | 3.82 | 50 |
| CFRS03.0523 | 0.6508 | 21.31 | -20.67 | -21.55 | 0.48 | 3.57 | 41 |
| HDFS4130 | 0.4054 | 20.09 | -20.90 | -22.13 | 0.62 | 4.04 | 36 |
| HDFS4090 | 0.5162 | 22.15 | -19.71 | -19.83 | 0.35 | 1.54 | 45 |
| HDFS5140 | 0.5649 | 22.38 | -19.76 | -20.46 | 0.36 | 2.57 | 50 |
| HDFS5030 | 0.5821 | 20.40 | -21.74 | -22.68 | 0.66 | 4.19 | 25 |
-
a
isophotal magnitudes.
-
b
from Hammer et al. 2005.
-
c
in kpc.
-
d
inclination, in deg.
3 Kinematics of LCGs
Following Paper I (Flores et al. 2006), we define 3 kinematical classes: rotating disks (velocity field showing rotation and -map showing a peak near the center), perturbed rotations (velocity field showing rotation but -map without peak or with a peak offset from the center) and complex kinematics, (see Figure 1 and comments on individual objects). This classification relies on the fact that observations with a low spatial resolution integral field spectrograph, such as GIRAFFE, should reveal line widths dominated by the integration of larger scale motions and not by intrinsic random motions: in the case of a rotating disk, should show a peak near the galaxy center, where the gradient of the rotation curve is the steepest (e.g. Van Zee & Bryant 1999). This classification has been checked through numerical simulations which are described in detail in Paper I. In these simulations, we assumed that all the observed galaxies are indeed rotating disks (taken as a standard model) and that all the observed large scale motions in the velocity fields correspond to rotations. In other words, we have tried to force each system to appear as rotational disks and then estimate the discrepancy between the observed system and the adopted standard rotation (see Paper I). Below we comment on the velocity fields of individual objects.
-
HDFS4170
Its kinematics is classified as a rotating disk: a rotation is seen in the velocity field and the -map has a clear peak in the center.
-
HDFS5190
Its kinematics is classified as a rotating disk: a clear rotation is seen in the velocity field and the -map shows a peak near the center.
-
CFRS03.0619
Its kinematics is classified as a rotating disk: the velocity field shows a clear rotation and the -map has a peak slightly offset from the center of the galaxy. Due to the low spatial resolution of GIRAFFE, we choose to classify this galaxy as rotating disk rather than perturbed rotation.
-
CFRS03.1032
Its kinematics was first classified as complex because the velocity field looked perturbed and the -map has a peak near the edge of the galaxy. Although our simulation cannot reproduce the amplitude of the peak, this peak is however located in the same pixel as the one seen in the observed -map. HST/ACS imaging reveals a very compact structure, completely dominated by the center. This galaxy is the most compact in the sample. We retrieved a FORS slit spectrum from which we found a Log([OIII]/Hβ) ratio of 1.8, which characterize a Seyfert galaxy spectrum: the high value of this galaxy might reflects an AGN activity. We choose to re-classify its kinematics as a perturbed rotation, but we notice that it somewhat escapes our classification scheme.
-
CFRS22.0619
Its kinematics is classified as a perturbed rotation: a clear rotation is seen in the velocity field but the -map has a peak at the edge of the galaxy. Note that this galaxy is seen nearly edge-on.
-
CFRS03.1349
Its kinematics was first classified as a rotating disk because a clear rotation is seen in the velocity field and a peak is seen near the center of the -map. However, the simulation (see Paper I) cannot reproduce the location of the peak, although the secondary peak (at the bottom-left of the maximal peak) is reproduced. Zheng et al. (2004) classified this galaxy as Sab with a compact bulge, relatively blue compared to the disk. An interacting companion is 20 kpc away at the same redshift. Interestingly, this galaxy shows a companion galaxy at 7 kpc, and the distorsion in the map is oriented towards this companion. We suspect that an interaction (gas falling) is responsible for both the star formation activity and distorsion of the kinematics (following the scenario proposed by Barton & Van Zee 2001). We then choose to re-classify its kinematics as a perturbed rotation.
-
CFRS22.1064
Its kinematics is classified as perturbed: the velocity field shows rotation but the -map is very perturbed.
-
HDFS5150
Its kinematics is classified as a perturbed rotation: rotation is seen in the velocity field but the -map has a peak at the edge of the galaxy. The morphology looks quite irregular.
-
CFRS03.0508
The velocity field clearly shows an apparent rotation and the -map has a well-defined peak in the center. Note however that the dynamical axis seems almost orthogonal to the photometric axis of the brightest component: this could be a signature of outflows (Veilleux et al. 2005; Bosma, private communication). Hence its kinematics has been classified complex. From morphological studies, Zheng et al. (2005) classified this galaxy as the relics of an interaction or merger, with a relatively blue color over the whole galaxy.
-
CFRS03.0645
Also this galaxy shows rotation that is orthogonal to the photometric major axis, which may indicate an outflow and the -map has a peak at the edge of the galaxy. We classified the kinematics as complex. Zheng et al. (2005) found a relatively blue color all over the galaxy and classified it as a probable merger.
-
CFRS22.0919
Its kinematics is classified as complex: the velocity field is perturbed and the -map does not show any peak. Note the tails, characteristic of interacting systems, seen in the HST image.
-
CFRS22.0975
Its kinematics is classified as complex: the velocity field is perturbed and the -map shows a peak but not at the galaxy center. HST imaging reveals 3 distinct components. This system is probably just preceding a merger and the high velocity gradient in Figure 1 can probably not be attributed to rotation.
-
CFRS03.0523
Its kinematics is classified as complex: the velocity field and the -map do not show any kind of structure expected from rotation. HST imaging shows a tidal tail, probably indicating ongoing interactions or gas accretion. This galaxy has a central region bluer than the outer region (Zheng et al. 2004). The maxima on the outer edges of the galaxy correspond to relatively blue regions (see Zheng et al. 2004).
-
HDFS4130
Its kinematics is classified as complex: the velocity field shows rotation but the -map does not have any peak. This galaxy is asymmetric with (spiral ?) arms visible on one side only (maybe a distant version of a “tadpole” galaxy).
-
HDFS4090
Its kinematics is classified as complex: the velocity field is perturbed and the -map does not have any peak. The morphology looks like a “peanut”.
-
HDFS5140
Its kinematics is classified as complex: the velocity field is very perturbed, although the -map has a peak near the center.
-
HDFS5030
Its kinematics is classified as complex: both the velocity field and the -map appear perturbed.
In the sample, 53% of the LCGs (9 galaxies) present complex kinematics, which are very different from classical nearby spiral galaxies (e.g. Garrido et al. 2002; 2003 & 2004) or early-type galaxies (Emsellem 2004), indicating that these LCGs are unrelaxed systems. As Figure 1 shows, there is no correlation between these dynamical classes and their SNR. Even discarding the lowest SNR pixels would not change the nature of the kinematics and hence the kinematical complexity of a galaxy cannot be attributed to a lower SNR.
Five galaxies, or 29%, have perturbed kinematics and the remaining three galaxies (18%) look like normal spiral galaxies. Interestingly, among these last eight galaxies (perturbed rotation and rotating disks), all but three (CFRS03.0619, HDFS5150 and HDFS5190) have possible nearby companions which might indicate interactions responsible for their compactness (see Barton & van Zee 2001).
Before concluding on the dynamical nature of LCGs, we have to investigate whether such perturbed/complex velocity fields could be artificial features caused by the low spatial sampling of GIRAFFE. In Flores et al. (2004 & 2006), we illustrated the ability of GIRAFFE to recover regular velocity fields of distant rotating disks. The question is then to demonstrate the ability of GIRAFFE to recover also more complex velocity fields in distant galaxies. To tackle this issue, we used Perot-Fabry observations by Östlin et al. (1999) of a local LCG. We redshifted the ESO 400-G43 data cube (see Östlin et al. 1999 & 2001) to z=0.6 and simulated the effects of a 0.52 arcsec sampling and a 0.6 arcsec seeing. The result is illustrated in Figure 2: GIRAFFE smoothes the velocity fields (and thereby underestimates the velocity gradient) but no artificial features are created. Moreover, the simulated velocity field shows some similarities with those of the LCGs in Fig. 1.
We can then conclude that LCGs are mainly (53 to 82% as judged from our rather small number statistics) unrelaxed systems, at least when ionized gas motions are considered. Such kind of complex kinematics have also been observed by Swinbank et al. (2005) who obtained the velocity field of a merger remnant at 0.1, similar to the complex velocity fields of our LCGs. However, this conclusion relies on the kinematics of the gas only: Östlin et al. (2004) showed that in one local LCG, gas and stars seem dynamically decoupled, and that stars seem more relaxed than the gas. In the following section, we attempt to investigate the nature of the LCG kinematics, namely if they are mostly dominated by rotation or by dispersion. The fact that LCGs are not dynamically relaxed systems is a severe limitation for this exercise.
4 Test of the dynamics of LCGs
To investigate energy balances of LCGs, we assume in this section that LCGs are systems almost at equilibrium. In this case, one could imagine two possibilities: (1) LCGs are mainly supported by velocity dispersion, or (2) LCGs are mainly supported by rotation. Both options require to assume that LCGs are dynamically not too far from equilibrium and we would like to point out again that this assumption represent a severe limit in setting up energy balances of LCGs. Moreover, the last possibility (that LCGs are dominated by rotation) requires in addition to identify large scale motions to rotation, which is even more speculative and will thus be detailed in appendix.
4.1 Can LCGs be supported by velocity dispersion?
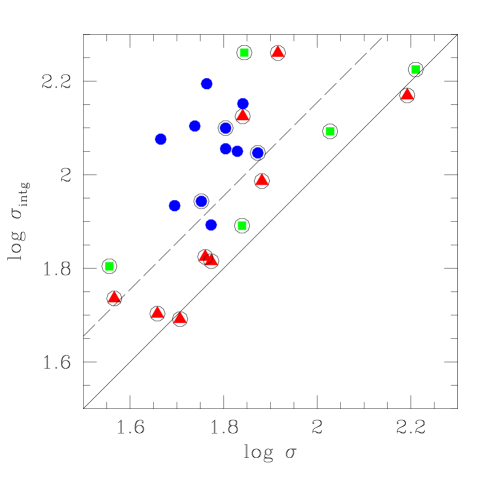
If LCGs were systems at equilibrium and supported by velocity dispersion, then the intensity-weighted mean and the one derived from their integrated spectra should be in agreement (e.g. Bershady et al. 2004; Östlin et al. 2001).
We constructed integrated spectra by the direct summation of all the spatial elements in the whole IFU. Integrated [OII] lines were fitted following the same way as for IFUs pixels, but due to the influence of larger scale motions (rotation for spirals) that widen integrated lines, about of the integrated spectra were impossible to fit correctly by a double Gaussian. We then summed independently the fits of each line of the [OII] doublet over the whole IFU, fitted both by single Gaussian (corrected from instrumental dispersion) and estimated the integrated velocity dispersion taking the mean of the two velocity dispersions derived independently. We checked that in most cases, these two velocity dispersions were very similar and that when integrated line fit was possible, both methods gave similar results.
Both measurements are presented in Table 2 and Figure 3. We estimated the error on the sigma measurement to be 10% (median, see Paper I). We thus adopt a 30% relative treshold (3-sigma treshold) between and to identify the galaxies which could potentialy be supported by velocity dispersion. Nine galaxies (roughly 50%) have such a relative difference between and : CFRS03.0523, CFRS03.1032, CFRS22.0919, HDFS4090, HDFS5030, HDFS5150, CFRS03.0645 CFRS22.1064 and HDFS4130 (see Table 2 and Figure 3). Note that among these galaxies, CFRS03.1032 is a very peculiar case because of both its very high central and its AGN activity (see individual comments).
| ID | class | ||||
|---|---|---|---|---|---|
| HDFS4170 | RD | 173 | 75 | 111 | 10.83 |
| HDFS5190 | RD | 168 | 64 | 126 | 10.51 |
| CFRS03.0619 | RD | 155 | 57 | 88 | 10.50 |
| CFRS03.1032 | PR* | 139 | 162 | 168 | 10.87 |
| CFRS22.0619 | PR | 67 | 36 | 64 | 9.50 |
| CFRS03.1349 | PR* | 235 | 70 | 183 | 10.91 |
| CFRS22.1064 | PR | 124 | 107 | 124 | 10.39 |
| HDFS5150 | PR | 77 | 69 | 78 | 10.14 |
| CFRS03.0508 | CK | 78 | 37 | 54 | 9.87 |
| CFRS03.0645 | CK | 125 | 58 | 67 | 10.27 |
| CFRS22.0919 | CK | 45 | 46 | 51 | 9.54 |
| CFRS22.0975 | CK | 409 | 82 | 182 | 10.82 |
| CFRS03.0523 | CK | 97 | 156 | 148 | 10.35 |
| HDFS4130 | CK | 153 | 76 | 97 | 10.63 |
| HDFS4090 | CK | 20 | 51 | 49 | 9.67 |
| HDFS5140 | CK | 224 | 69 | 133 | 9.91 |
| HDFS5030 | CK | 74 | 59 | 65 | 10.81 |
4.2 Dynamical support of LCGs
The other possibily for LCGs to be systems at equilibrium is to be supported by rotation. This would imply that the large scale motions seen in the velocity fields of LCGs are due to rotation, althgough these motions are not completely relaxed. However, we already know that this is not true for at least the objects whose dynamical axis are not aligned with the optical one, ie for objects suspected of outflows (see individual comments). In the appendix, we nevertheless naively assumed that the large scale motions are precisely due to rotation. As we assumed that LCGs are at equilibirum, we can then set up energy balance using classical relations linking their kinematics (velocity or dispersion) to their mass, to see if these balances are effectively dominated by the large scale motions interprated as rotation. Under such an assumption, one finds that 70% of LCGs have an energy balance effectively consistent with rotation. However, this question can only be properly addressed with the knowledge of the kinematics of the stars (see e.g. Östlin et al. 2004).
To summarize, we find that about 50% of LCGs could be supported by velocity dispersion, assuming they are not too far from equilibrium. Given that 18% of LCGs are classified as RD, it remains one third of LCGs for which we cannot exclude that a rotational support could play a role in their dynamical state. Both large scale and random motions seem to play an important role in about 40% of LCGs. Such a mix is perfectly compatible with mergers.
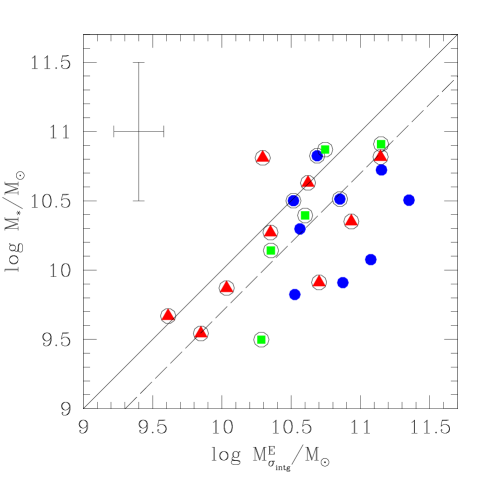
5 Stellar vs. dynamical masses
We derive stellar masses following Hammer et al. (2005) (see Table 2). Figure 4 compares stellar masses with total dynamical pseudo-equivalent masses derived from integrated spectra, which is the most reliable estimate of the total dynamical mass we can use (see Appendix). Following Conselice et al. (2005) who carried an extensive study of uncertainties and systematics on stellar masses, we estimate our error on stellar masses to be 0.5 dex. Among the sample of spirals of Paper I (Flores et al. 2006), a mean ratio of dynamical to stellar masses of 6 (median 7) was found, which is roughly in agreement with the value of Conselice et al. (2005) who found a mean ratio of 5 for a sample of 0.5 disk galaxies. The difference between these two samples of spirals is most probably related to the difference of observational strategy (slit spectroscopy vs Integral Field Spectroscopy), because the maximal rotational velocity can be largely underestimated when measured by slit spectroscopy, since only a part of the whole kinematics is sampled (see Discussion). On the other hand, we find for our sample of LCGs a mean ratio between dynamical and stellar masses of 2 (median 1.6). If the majority LCGs are merging systems, as suggested by their kinematics, their spectra are then likely dominated by unrelaxed motions, which could lead to underestimate their total dynamical .
6 Discussion & conclusion
We have presented GIRAFFE-IFU observations and derived velocity fields and maps for 17 LCGs. Our main result is that 18% have velocity fields characteristic of rotating disks kinematics, the rest having perturbed or complex kinematics. This result is unlikely to be affected if we account for the four objects that were discarded because of a too low SNR. Among them, two show (in HST images) tails characteristics of ongoing interactions. Assuming that they are not too far from equilibrium, we find that about half of LCGs could be supported by velocity dispersion. The remaining 32% of LCGs seems to be dominated by large scale motions. An important fraction of LCGs, between 32 and 82%, are thus probable mergers.
In this sample of 17 LCGs, four have their velocity gradient nearly perpendicular to their main optical axis (CFRS03.0508, CFRS03.0645, CFRS22.0975 and HDFS5140). It suggests that in these galaxies, gas is tracing feedback processes such as outflows, rather than gravitational dynamics: in this case, the dynamical axis should appear off axis relative to the optical main axis (see Veilleux et al. 2005 and references therein). All of them except CFRS22.0975 have stellar masses lower than which is the upper threshold for supernova feedback to drive efficient outflows (Dekel & Birnboim 2005). In CFRS22.0975, the gas velocity field probably traces the relative motion of the merger progenitors (see its morphology in Figure 1). For CFRS03.0645, we retrieved FORS slit spectra (Hammer et al. 2001) to compare systemic velocities of emission (, , [OII] and [OIII]) and absorption lines (CaII, H and K) and found no significant shifts between them, which makes the outflow hypothesis uncertain for this galaxy. Note however that the slit has been aligned with the apparent (optical) main axis which could explain why we did not see any shift between emission and absorption lines. The electron density map of CFRS03.0508 is presented in Paper III (Puech et al. 2006b) and support the outflow hypothesis.
Bershady et al. (2004) used the STIS long slit spectrograph onboard the HST to study the kinematics of 6 LCGs with , kpc and 65 km/s, and found that LCGs are supported by velocity dispersion. Unfortunately, only one galaxy of the present sample (CFRS220919) is enough compact to fulfill these selection criteria. Interestingly, it has being pointed out by Hammer et al. (2001) that this galaxy could be a possible progenitor of a dE. Here we find that this galaxy is a possible candidate for being supported by dispersion. However, given the complexity of most LCGs kinematics presented here, slit spectroscopy should be used with care for this kind of objects. A careful inspection of Figure 1 reveals that with long slit spectroscopy, the real nature of many LCGs presented in this paper would have been misinterpreted. In the case of CFRS03.0645, a slit positioned along the main optical axis would have revealed a rather flat velocity gradient and would have completely missed the rotation. The case of CFRS03.0508 is even more instructive: the same exercise would have revealed a flat velocity gradient and a clear peak, and this galaxy would then have been classified as supported by dispersion.
Finally, how can we interpret the compactness of LCGs? Most of perturbed kinematics and rotating LCGs show possible companions with which they could be in interaction. This could explain their compactness as due to interactions and/or minor mergers, following Barton & van Zee (2001, see introduction). Another conjecture is the one of Hammer et al. (2005). They proposed a scenario where local massive spiral could form after major mergers in three main phases. The sequence would start by a pre-merging phase during which the system would form a huge amount of stars and appear as a LIRG. The second phase would be the LCG phase, were all material falls onto the mass barycenter of the merging system which could enhanced the star formation activity in the center of these systems, making them looking compact. This is consistent with Bergvall & Östlin (2002) who found central intense starbursts superimposed on low surface brightness components in four local BCGs. Our results are consistent with this picture as we found that most LCGs are objects with complex kinematics as expected from major mergers. During the third phase of the scenario, a disk would grow thanks to material accreted from the IGM. Inflows/outflows are also predicted by this scenario, arising from feedback and gas falling back to form a new disk (see Robertson et al. 2005).
How could we distinguish between minor and major mergers? In a minor merger, the disk cannot be destroyed and the kinematics of the remnant cannot appear too complex. We should then observe a galaxy still rotating along its main optical axis but a dispersion map peaking outside the center, where the smaller progenitor falls. This could correspond to the LCGs we classified perturbed. On the other hand, during a major merger the disk is completely destroyed or at least strongly perturbed. In such a case, we should then observe either a rotation significantly misaligned with the optical axis combined with a non-centered dispersion map, or a complex kinematics without any obvious structure. We emphasize that given our spectral resolution, reaching 10000, the fact that the [OII] doublet is not always resolved reveals by itself the complexity of some of these galaxies.
LCGs dominate the evolution of the UV luminosity from 1 to 0. Their role can thus not be negligible in the process of formation and evolution of galaxies during the last 8 Gyr. Our results highly support a hierarchical type picture where galaxies form from smaller units. In this picture, LCGs seem to be a major event as proposed by Hammer et al. (2005). Although based on small numbers, our sample is nevertheless representative of the galaxy population at (see Paper I). A larger sample is under construction as part of the ESO Large Program IMAGES (P.I.: F. Hammer) and will be a decisive step towards the confirmation of the spiral rebuilding scenario. Recently, it has been shown that major merger remnants may not necessarily be ellipticals but also spirals, depending on the gas abundance (Springel and Hernquist 2005) and/or the Black Hole feedback (Robertson et al. 2005). Comparisons with theoretical simulations will bring a crucial test of the spiral rebuilding scenario and on the nature of LCGs.
Acknowledgements.
We thank P. Amram and C. Balkowski for their help and very useful comments, and our R. Guzman, our referee, for his very useful comments and suggestions. We also thank A. Bosma for his enlightening comment on CFRS03.0508. We are especially indebted to T.J. Cox who provide us with an hydrodynamical simulations of a Sbc galaxy. HF and MP wish to thank ESO Paranal staff for their reception and their very useful advises during observations. We thank all the team of GIRAFFE at Paris Observatory, at Geneve Observatory and at ESO for the remarkable accomplishment of this unique instrument, without which, none of these results would be obtained.References
- (1) Barton E. & Van Zee L., 2001, ApJ, 550, L35.
- (2) Bender R., Burstein D. & Faber S.M., ApJ, 1992, 399, 462.
- (3) Bergvall N. & Östlin G., 2002, A&A, 390, 891.
- (4) Bershady M., Vils M., Hoyos C. et al., 2004, astro-ph/0411597.
- (5) Bertin E.& Arnouts S., A&AS, 1996, 117, 393.
- (6) Blecha A., Cayatte V., North P. et al., Optical and IR Telescope Instrumentation and Detectors, Masanori Iye & Alan F. Moorwood Eds., 2000, SPIE proc. vol. 4008, 467.
- (7) Conselice C.J., Bundy K., Ellis R.S. et al., 2005, ApJ, in press, astro-ph/0503597.
- (8) Cox T.J., Primack J., Jonsson P. et al., ApJ, 2004, 607, 87.
- (9) Dekel A. & Birnboim Y., 2005, astro-ph/0412300.
- (10) Emsellem E., Cappellari M., Peletier R.F. et al. MNRAS, 352, 721.
- (11) Flores H., Puech M., Hammer F. et al., 2004, A&A, 420, L31.
- (12) Flores H., Hammer F., Puech M. et al., 2006, A&A, submitted (Paper I).
- (13) Garland C., Pisano D., Williams J. et al., 2003, in 4th Cologne-bonn-zermatt-Symposium, ed. S. Pfalznert et al., astro-ph/0310857.
- (14) Garland C., Pisano D., Williams J. et al., 2004, ApJ, 615, 689.
- (15) Garrido O., Marcelin M., Amram P. et al. A&A, 2002, 387, 821.
- (16) Garrido O., Marcelin M., Amram P. et al. A&A, 2003, 399, 51.
- (17) Garrido O., Marcelin M., Amram P. et al. MNRAS, 2004, 349, 225.
- (18) Guzman R., Gallego J., Koo D. et al., 1997, ApJ, 489, 559.
- (19) Hammer F., Gruel N., Thuan T.X. et al., 2001, ApJ, 550, 570.
- (20) Hammer F., Flores H., Elbaz D. et al., 2005, A&A, 430,115.
- (21) Jangren A., Bershady M., Conselice C. et al., 2004, AJ, submitted.
- (22) Koo D., Guzman R., Faber S. et al., 1995, ApJ, 440, L49.
- (23) Lequeux J., A&A, 1983, 125, 394.
- (24) Lilly S.J., Hammer, F., Le F vre, O. et al. 1995, ApJ, 455, 75.
- (25) Lilly S.J., Schade D., Ellis R. et al., 1998, ApJ, 500, 75.
- (26) Östlin G., Amram P., Masegosa J. et al., 1999, A&AS, 137, 419.
- (27) Östlin G., Amram P., Bergvall N. et al., 2001, A&A, 374 ,800.
- (28) Östlin G., Cumming R., Amram P. et al., 2004, A&A, 419, L43.
- (29) Persic M. & Salucci P., 1988, MNRAS, 234, 131.
- (30) Phillips A., Guzman R., Gallego J. et al., 1997, ApJ, 489, 543.
- (31) Press W.H., Flannery B.P., Teukolsky S.A. et al., Numerical recipes in C, Cambridge University Press, 1989.
- (32) Puech M., Flores H., Hammer F., 2006b, A&A, submitted (Paper III).
- (33) Ravindranath S., Ferguson H.C., Conselice C. et al., 2004, ApJ, 604, 9.
- (34) Robertson B., Hernquist L., Bullock J.S. et al., ApJL, submitted, astro-ph/0503369.
- (35) Rozas M., Sabalisck N., Beckman J.E. et al., A&A, 1998, 338, 15.
- (36) Springel V. & Hernquist L., 2005, 622, 9.
- (37) Swinbank A.M., Balogh M.L., Bower R.G. et al., ApJ, 2005, 622, 260.
- (38) Tokovinin A., 2002, PASP, 114, 1156.
- (39) Van Zee & Bryant, 1999, AJ, 118, 2172.
- (40) Veilleux S., Cecil G., Bland-Hawthorn J., ARA&A, 2005, in press, astro-ph/0504435.
- (41) Werk J., Jangren A., Salzer J., 2004, ApJ, 617, 1004.
- (42) Zheng X.Z., Hammer F., Flores H. et al., 2004, A&A, 421, 847.
- (43) Zheng X.Z., Hammer F., Flores H. et al., 2005, A&A, 435, 507.
Appendix A Energy balance of LCGs
This appendix is devoted to the energy balance of LCGs. It is explicitly assumed that LCGs are systems at equilibrium and supported by rotation. We will thus assume in this appendix that the large scale motions seen in the velocity fields are associated with rotation, even if the true origin of these large scale motions is largely uncertain, except for some suspected outflows and those clearly identified as RD from their kinematics (see individual comments and section 4.2). We will nevertheless naively assume that their origin is rotation and see if any contradiction arises. To test this hypothesis, we set up an energy balance in the sample of LCGs. In this balance, we will take into account the contributions from large scale ordered motions (interpreted as rotation) and from random motions. Energies are estimated in what we call “pseudo equivalent masses” (, i.e. in mass units). It is important to emphasize that these can be interpreted as real masses only for galaxies in equilibrium.
A.1 Contribution from rotation
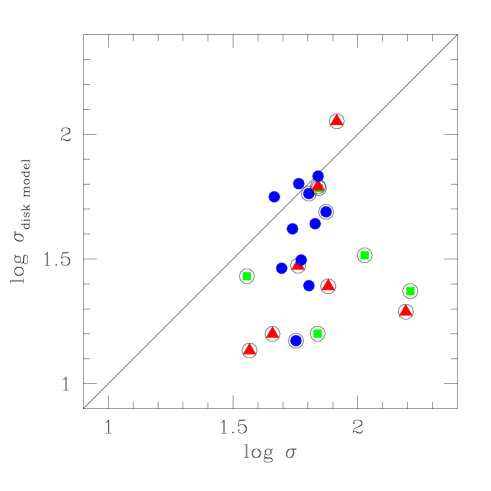
To estimate the mass supported by rotation, we assumed that the maximal rotational velocity is equal to half the maximal gradient of the velocity field, corrected for inclination (see Table 1). Due to the low spatial sampling and large distances to our targets, we have already pointed out that the GIRAFFE/IFU observations will underestimate the maximal rotational velocity (see Figure 2). Using hydrodynamical simulations of an Sbc (Milky-Way like) galaxy by Cox et al. (2004), we simulated our GIRAFFE observations assuming median atmospherical conditions at ESO VLT (0.81 arcsec seeing at 500 nm and an outer scale for the turbulence of 24 m, see Tokovinin 2002). We scaled this template galaxy ( km/s and degrees) to fill boxes of length ranging from 0.75 to 6 arcsec to mimic distant galaxies, and then compared the kinematics seen by GIRAFFE with the original simulation (see Figure 5). We found that for spiral galaxies with sizes between 2 and 3 arcsec, GIRAFFE is able to correctly recover the maximal rotational velocity, although it is underestimated by 20 %. For more complex kinematics, the correction factor should be larger (see also Figure 2): between 2 and 6. However, as we explicitly assume in this section that LCGs are rotating disks, we applied a constant factor of 20% whatever the dynamical class (spiral or perturbed/complex) of LCGs in order to compute homogeneous estimates.

Rotational are then estimated from (Lequeux 1983):
with f=0.6 for a disk with a flat rotation curve and , following Phillips et al. (1997). For a pure exponential disk with scale length , . Taking in fact assumes that since (Persic & Salucci 1988). With in , in km/s and in kpc, this becomes:
Corrected rotational velocities and are given in Table 2. To estimate our error bars we took into account the uncertainties on (1/2 HST pixel which represents 0.34 kpc at z=0.6), ( 5 km/s, determined by repeating several times the fitting procedure), inclination ( degrees, see section 2) and the correction factor on the velocity (, see Figure 5). Note however, that the real uncertainty on inclination is probably higher for unrelaxed systems, as its derivation usually relies on the assumption of a thin disk seen in projection (see section 2). From this we estimated an median error on of 0.16 dex which is mainly dominated by the uncertainty in the inclination.
| ID | class | |||||
|---|---|---|---|---|---|---|
| HDFS4170 | RD | 56 | 10.63 | 10.10 | 10.74 | 10.69 |
| HDFS5190 | RD | 27 | 10.66 | 9.50 | 10.69 | 10.85 |
| CFRS03.0619 | RD | 55 | 10.57 | 10.10 | 10.70 | 10.52 |
| CFRS03.1032 | PR* | 161 | 10.14 | 10.71 | 10.81 | 10.75 |
| CFRS22.0619 | PR | 24 | 9.89 | 9.43 | 10.02 | 10.29 |
| CFRS03.1349 | PR* | 34 | 10.93 | 9.70 | 10.94 | 11.15 |
| CFRS22.1064 | PR | 101 | 10.17 | 10.43 | 10.62 | 10.60 |
| HDFS5150 | PR | 67 | 9.90 | 10.23 | 10.40 | 10.35 |
| CFRS03.0508 | CK | 34 | 9.91 | 9.63 | 10.09 | 10.03 |
| CFRS03.0645 | CK | 49 | 10.46 | 10.09 | 10.60 | 10.35 |
| CFRS22.0919 | CK | 43 | 9.30 | 9.70 | 9.85 | 9.85 |
| CFRS22.0975 | CK | 10 | 11.41 | 8.62 | 11.41 | 11.15 |
| CFRS03.0523 | CK | 155 | 10.13 | 10.97 | 11.03 | 10.93 |
| HDFS4130 | CK | 72 | 10.58 | 10.36 | 10.79 | 10.62 |
| HDFS4090 | CK | 51 | 8.38 | 9.64 | 9.66 | 9.61 |
| HDFS5140 | CK | 32 | 10.71 | 9.45 | 10.74 | 10.70 |
| HDFS5030 | CK | 59 | 9.96 | 10.21 | 10.40 | 10.29 |
A.2 Contribution from velocity dispersion
Following Östlin et al. (2001), we estimated the supported by velocity dispersion using ( in , in km/s and in kpc):
where is the intensity weighted mean of the -map. Due to the low GIRAFFE spatial sampling, will tend to be overestimated, since the coarse pixel size integrates large scale motions (rotation for a spiral galaxy). We used the same hydrodynamical simulation to estimate the increase in due to large scale motions and found 50 km/s ( km/s and degrees). We used another simulation to check that the effect approximatively scales with (within an error on of 5 km/s) and assumed the same scaling with . We then corrected the GIRAFFE intensity weighted mean using this recipe and from this estimated the mass supported by velocity dispersion (see Table 3 and Figure 6). For pure rotating disks, a correction roughly equal to the measure is expected, which means that intrinsic velocity dispersion is negligible. Galaxies classified as rotating disk and which fall far from the region could be galaxies with a significant bulge (e.g. CFRS03.9003, see also Puech et al. 2006b) or show perturbation in their -map (CFRS03.0619, CFRS22.0504 and HDFS4020). Interestingly, these 4 galaxies (plus CDFS03.1032, but see individual comments) are among those which are the nearest of the line on Figure 3, which supports the idea that their dynamical support could include a substantial contribution coming from dispersion. All points with a correction larger than the measured mean are spiral galaxies except one (CFRS22.0975) whose velocity gradient is likely due to relative motions between merging components (see its morphology in Figure 1) rather than rotation. In these few cases, we fixed the corrected value to 10 km/s which corresponds to the minimal expected line width due to intrinsic turbulent motions in spiral galaxies (Rozas et al. 1998; Van Zee & Bryant 1999). We estimate a median error on of 0.08 dex.
A.3 Total dynamical
To estimate total dynamical pseudo-equivalent masses , we simply added and . Most authors derive on integrated spectra (global velocity dispersion) and use the relation of the previous section to estimate the whole dynamical mass (Guzman et al. 1996, Phillips et al. 1997). Under assumptions concerning the anisotropy of the kinetic energy tensor and the geometry of the system, this relation can be used to estimate total dynamical masses of rotating and flattened spheroids (Bender et al. 1992). This approach is often used in studies using slit spectroscopy (Guzman et al. 1997; Guzman et al. 2001; Hammer et al. 2001) but the validity of this relation for systems dominated by rotation is uncertain. In the following, we also estimated which we compared with .
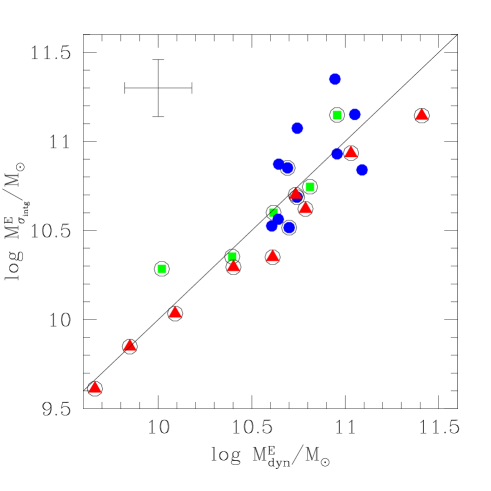
Figure 7 shows the comparison between and . We find a correlation between the two estimates, which seem to validate our estimates and is consistent with the fact that LCGs could be systems not too far from equilibrium. Spiral galaxies are almost equally distributed on both sides of the line where which is likely due to the fact that does not correct explicitly for inclination effects.
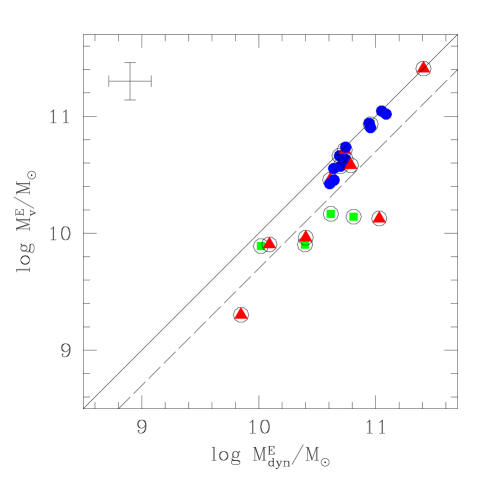
In Figure 8 we compare with to test if the LCGs are dominated by rotation. For comparison, we also plot a sample of 8 rotating disks taken from Paper I (Flores et al. 2006). Clearly, the whole spiral sample falls in the rotation dominated area. At least 70% of the LCGs (12 galaxies) seems to be dominated by rotation whereas the remaining 30% (5 galaxies) seems to be dominated by velocity dispersion. Note that these five galaxies were already identified as potentially supported by dispersion (see section 4.1): CFRS22.0919, CFRS03.0523, CFRS03.1032 HDF4090 and CFRS22.1064. Interestingly, one of these galaxies (CFRS22.0919) was identified by Hammer et al. (2001) as a potential dwarf progenitor as discussed by Guzman et al. (1997). Because we are likely underestimating their rotational velocities, we cannot exclude that all LCGs have energy balance dominated by rotation.
However, we recall that this conclusion relies on the assumptions that large scale motions in the velocity fields are due to rotation, and that we know that for some systems (e.g. the suspected outflows) this is far from being true. We nevertheless cannot exclude that a possible relation could link most of the LCGs with rotating disks.