Indirect Imaging of an Accretion Disk Rim in the Long–period Interacting Binary W Crucis††thanks: Table 1 is only available in electronic form at the CDS via anonymous ftp to cdsarc.u-strasbg.fr (130.79.128.5) or via http://cdsweb.u-strasbg.fr/Abstract.html
Abstract
Context. Light curves of the long-period Algols are known for their complex shape (asymmetry in the eclipse, light variations outside eclipse, changes from cycle-to-cycle), and their interpretation is not possible in the standard model of binary stars.
Aims. Complex structures present in these active Algol systems could be studied with the eclipse-mapping method which was successfully applied to the new 7-color photometric observations in the Geneva system of W Cru, belonging to the isolated group of these active Algols.
Methods. Several cycles of this long-period (198.5 days) eclipsing binary have been covered by observations. We have used a modified Rutten’s approach to the eclipse-mapping. The optimization of the system’s parameters and the recovery of the disk intensity distrubution are performed using a genetic algorithm (GA).
Results. It is found that a primary (hot) component is hidden in the thick accretion disk which confirms previous findings. The mass of the primary component, M⊙ indicates that it is a mid-B type star. The mass-losing component is filling its critical lobe which, for the system’s parameters, means it is a G-type supergiant with a mass M⊙. The disk is geometrically very extended and its outer radius is about 80% of the primary’s critical lobe. A reconstructed image reveals a rather clumpy and nonuniform brightness distribution of an accretion disk rim in this almost edge-on seen system. This clumpiness accounts for light curve distortions and asymmetries, as well as for secular changes.
Key Words.:
binaries: eclipsing, accretion disk: image, techniques: photometry, individual: W Cru (HD 105998)1 Introduction
W Cru (HD 105998) is a member of the rather sparse group of strongly interacting binaries which are believed to be either in the first and rapid phase of the mass exchange between components, or have just recently gone it. While mass reversal has already happened there are still many signatures of the almost cataclysmic events that were taking place. Studying the UV spectra of some long-period binaries taken with the spectrograph on-board IUE satellite Plavec & Koch (1978) have found numerous emission lines of highly-ionized species. It was immediately obvious that the underlying stellar photospheres of these binaries are not hot enough to excite such features, and therefore the accretion processes were invoked as an explanation. This sparse group of the long-period interacting binaries comprises SX Cas, RX Cas, W Cru, W Ser, V367 Cyg, and Lyr, and a few others less studied systems. All these binaries are well known for their active nature with large period changes, almost permanent Balmer line emission features, peculiar light curves, etc. (Plavec 1980).
In the long-period Algol systems with days, the primary component is rather small relative to the binary separation and its Roche lobe, and mass transfer results in a classical accretion disk. Typically, this disk is a permanent structure characterized by strong double-peaked emission lines in the spectrum. Since the disk hides the mass-gaining component, which in these post mass-exchange binaries is more massive and hotter than its companion, we are encountering a paradox that the component expected to be more luminous is invisible. This effect considerably affect the light curves.
W Cru is not an unique binary system which harbors such a large accretion disk. Several other long-period semi-detached binary systems have been found for which light curve solution has been found only after an optically and geometrically thick disk has been taken into account. Good examples are, RZ Oph (Zoła (1991), and UU Cnc (Zoła et al. 1994), with the periods of 262 and 96 days, respectively. In all these long-period Algols the separation between the components is large, and hence, mass-losing components are supergiants, and disks which surround mass-accreting (hot and more massive) component typically extend several hundred solar radii in radial direction.
It is well known that light curves of the ’active algols’ cannot be solved with standard models that deal only with two (stellar) components. In this respect the puzzling case of Lyrae is well-known (c.f. Linnell 2000, Harmanec 2002, and references therein) but the situation with other binaries of this class is quite similar. A real break-through came with Huang’s (1963) disk–model for the Lyr, and its first application to V356 Sgr by Wilson & Caldwell (1978). Following this development Pavlovski & Kříž (1985) made a computer code for the synthesis of light curves of close binary stars in which the influence of an accretion disk is taken into account. They applied it in an analysis of the light curves of SX Cas. Derived disk properties were in general accordance with multi-wavelength studies by Plavec et al. (1982). Therefore, subsequent studies have been performed on more difficult cases: RX Cas (Andersen, Pavlovski & Piirola 1989) and V367 Cyg (Pavlovski, Schneider & Akan 1992).
In the meantime, some other attempts along the same disk-model but with more or less physics details and various optimization techniques have been undertaken. In particular, Zoła (1991) has implemented a disk-model in the widely used Wilson-Devinney program, while Daems (1998) introduced an analytical disk model. However, these studies do not take into account the fact that the accretion disk intensity distribution is generally asymmetric. This means that a more realistic model(s) is needed which is capable to account for erratic changes in the light curves, asymmetry in ascending and descending branches, unequal brightness of maxima, etc. In other words, a different strategy is needed.
In the present paper we apply the technique of ‘eclipse mapping’ (Horne 1985) for the study of the complex light curves of the active Algol W Cru. The binary system and new 7-color photometric observations in the Geneva system will be described in Sec. 2 and 3, respectively. In Sect. 4 we describe the model and calculations, while Sect. 5 is devoted to the discussion of our results.
2 Description of W Cru
The binary star W Cru (HD 105998, CoD -58°4431) has the longest period among the group of W Serpentis binaries. Its exceptionally long period, d, makes its a difficult object to observe. Only a single spectroscopic study is published (Woolf 1962), and long systematic photometric observations are scarce. However, the situation was considerably improved after Plavec’s (1984) appeal for new photometric observations. As a result two photoelectric data sets of W Cru were secured at the Auckland Observatory in 1984 and 1985 (Marino et al. 1988), and at the Nigel Observatory from 1985 to 1991 (Pazzi 1993). In 1985 a systematic photoelectric campaign of W Cru was initiated by Z. Kviz at the Swiss Telescope on La Silla. As an initial results, using Geneva photometry, a new determination of the primary minimum was communicated by Kviz & Rufener (1988). This aided proper phasing of the satellite observations.
Woolf (1962) has observed W Cru spectroscopically throughout the orbital cycle and detected only the presence of a less massive component with supergiant characteristics of the spectral type G1Iab. Its RV curve is well defined and enable Woolf to derive the system’s mass function M⊙. Superimposed on the supergiant spectrum are hydrogen Balmer emission lines and displaced absorption lines; very typical for the stars of this class (c.f. Struve 1944). Woolf recognized that the deeper minimum in the light curve is due to an eclipse of the supergiant by an opaque body. Apparently, a more massive star in this system is ‘invisible’ - Woolf drew similarity of W Cru to its more famous counterpart Lyrae.
While known for the other members of the group of these long-period interacting binaries, period change is not yet found for W Cru (c.f. Zoła 1996). Asymmetry in the primary minimum, and somewhat erratic light curve from the cycle-to-cycle as is seen in our Fig. 3, are, at least, some of the reasons for unconclusive results regarding this issue.
An important step in the understanding of this system was made by the independent studies of Zoła (1996) and Daems (1998). Zoła (1996) concentrated on the analysis of the light curves secured by Marino et al. (1988) and Pazzi (1993), respectively, while the study by Daems (1998) was more elaborated, and besides an independent modeling of unpublished Geneva 7-color photometry, also included some new spectrophotometric and spectroscopic observations. In particular, Daems was able to construct the spectral energy distribution of W Cru from IUE UV region up to IRAS FIR wavelengths. In both studies disk-model was employed, Zoła used an cylindrical –disk model, while Daems had applied an analytical torus-like disk. Further discussion of their results is left for Sect. 5 where they will be compared to the results of the present work.
3 Photometric data and variability of the components
Geneva 7-colour photometric measurements (Golay, 1980; Rufener& Nicolet, 1988) of W Cru were obtained from December 1984 to July 1989, using the Swiss 70 cm telescope at La Silla Observatory (ESO, Chile), equipped with the photoelectric photometer P7 (Burnet & Rufener, 1979). During this period, 378 measurements of weight have been obtained (see Rufener, 1988, for the definition of the weight q). The photometric reduction procedure was described by Rufener (1964, 1985); the photometric data in the Geneva system are collected in the General Catalogue (Rufener, 1988) and its up-to-date database (Burki, 2006). In the case of W Cru, the all-sky reduction was improved by the measurement of a neighbouring comparison star, HD 101021 (K1III), a well measured standard, with a confirmed stability: 440 measurements over a period of 20 years, mean magnitude 5.1374 with a standard deviation = 0.0046. The same value of can be adopted for the global precision of the measures on W Cru. The data on W Cru are listed in Table 1 available at the CDS.
The magnitudes in each of the seven filters are obtained from the visual magnitude and the six colour indices in the following manner :
| (1) |
with i representing one of the seven filters , , , , , , G. Remember that the Geneva and indices are not normalized to zero for an A0V star as it is the case for the Johnson UBV indices.
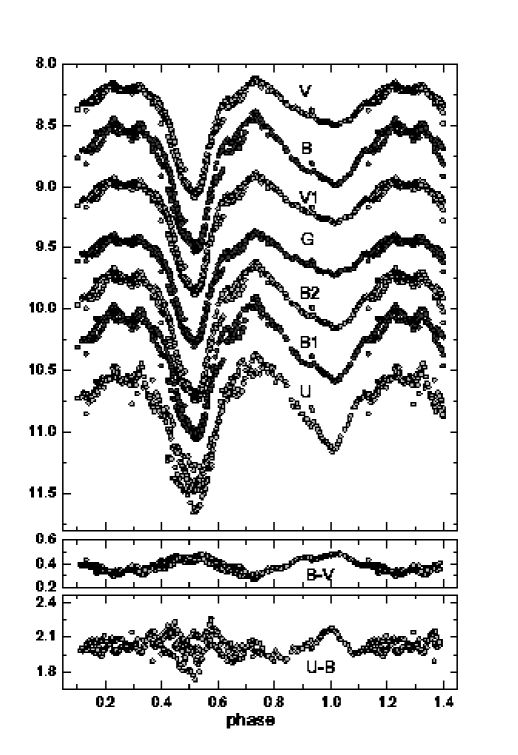
In Fig. 1 light curves in all seven photometric pass bands of the Geneva system are shown. The following ephemeris is used for the calculations of the phases: Min I (HJD) after Kohoutek (1988) and the elements are derived from all available minima found in the literature. The primary minimum, to which phase is assigned throughout in this paper, and which is caused by the eclipse of the visible component, became deeper for the shorter wavelengths. However, light curve in the -band has much larger intrinsic scatter - large changes in the width and depth of the primary minimum are evident for the light curve in the -band than for the other pass bands. Unfortunately, phase coverage of the secondary minimum is much poorer than primary and cycle-to-cycle variations in the secondary minimum are not evident as for the primary minimum. In fact, proper phase coverage in the secondary minimum has been secured in a single cycle. The width of the secondary minimum when an opaque disk is eclipsing its stellar companion is larger than the width of the primary minimum. At shorter wavelengths the secondary minimum becomes not only deeper but evidently narrower. Moreover, some other peculiarities in the light curves of W Cru are clearly seen: maximum following deeper minimum is higher than preceding, there are asymmetries in descending and ascending branches of both, primary and secondary, minima. Bumps and/or humps in the light curves at the phases are very pronounced, and, moreover, variable from cycle-to-cycle.
The color variations (bottom pannels in Fig. 1) are indicative of temperature changes. In quadratures when the supergiant is seen from the side is the largest. The amplitude of the changes in [B-V] index is about 0.25 mag. As is evident from Fig. 1 changes in are twice as large then in , i.e. about 0.50 mag. The variations are more difficult to interpret in . Large and erratic changes in around the primary minimum are present as consequence of a large activity in this system on time scale comparable to system’s orbital period. It seems that the source of these rapid fluctuations, which has different amplitudes from cycle-to-cycle is screened in the phase of the secondary minimum. But due to lack of more intensive phase coverage our conclusion is rather tentative at this point (see also Fig. 3).
4 Eclipse-mapping: model and calculation
4.1 An outline of the model
The eclipse-mapping technique introduced by Horne (1985) in combination with Doppler tomography (Marsh & Horne 1988) became an essential tool for the study of the structure and mass-flow processes in cataclysmic variables (CVs). In particular, eclipse–mapping is used to reconstruct the surface brightness distribution of the accretion disks in CVs, and is often assumed to be an indirect imaging method. Initially, only the information contained in the shape of the eclipse was used in the assembly of the map of the accretion disk surface brightness distribution. However, other sources of the radiation have been completely ignored, e.g. the secondary (often cool) component. Rutten (1998) has improved the technique with the development of 3D eclipse–mapping which fits the whole light-curve instead of just the eclipsed part.
In the present study we have followed Rutten’s (1998) approach. But, unlike the case of CVs in Algols here accretion disk is not prevailing source of radiation. Moreover, the hot component has a relatively large radius and its screening of the accretion disk should be taken into account.
Previous studies of the light curves of W Serpentis binaries have shown that hot components might be exposed to various degrees, Therefore, in the construction of the binary model we have started from the general case in which all three main radiative sources are presented: hot mass-accreting component surrounded by an optically thick disk and cool mass-loosing component which (canonically) is filling its Roche lobe.
The stellar surfaces are approximated by equipotential surfaces. These surfaces are determined by two parameters: the mass ratio and the filling factor (for description of the gravitational potential of two rotating stars in binary system see e.g. Hilditch 2001). We approximated an equipotential surface with a grid of triangles. This was done to avoid ray–tracing when calculating visibility. Geometry of an accretion disk in our model is given by an –disk model, i.e. the disk is determined by the disk radius and an opening angle .
The temperature distribution on stellar surfaces is parametrized by the effective temperatures of the components. This constant temperature distribution is modified by two effects: the gravity darkening and the reflection effect. For the stellar atmosphere in radiative equilibrium the gravity darkening exponent is 0.25 (von Zeipel 1924) while for the convective atmosphere is set to the value 0.08 according to Lucy (1968). Since we are using triangles rather than a grid of points it is assumed that the acceleration due to gravity on the stellar surface can be considered constant along the triangle’s surface for a sufficiently small triangle, and is equal to the acceleration in one of its vertices. Temperature distribution on a disk surface is computed in a simple power–law fashion. This distribution is independent of the vertical coordinate, i.e. there is only radial distribution of the disk temperature. For -disk model the temperature of disk is .
Although the geometry of an accretion disk is axially symmetric, its temperature distribution, in general, is not. In the first phase of the minimization (see Sec. 4.3) it is axially symmetric and is a power-law in radius. However, in the second phase of the minimization the requirement of the axisymmetry and radial dependence is relaxed and the temperature distribution is allowed to be essentially asymmetric. In all cases, the distribution is independent of the vertical coordinate, i.e. there is only radial and angular (with respect to the disk axis) distribution of the disk temperature. For -disk model the temperature of disk is .
Radiation from one component influences the temperature distribution on the other component. To increase the speed of the calculations the reflection effect is computed in an approximate way. Stars are assumed to be spheres of constant effective temperature. For example, when calculating the effect of reflection of radiation from the secondary (component 2) on the primary (component 1), a triangle whose one vertex has the position is considered. The radiation dilution factor is defined by , where is the solid angle within which the inner hemisphere of the secondary component is seen. The hemisphere has an area , and is the distance between the triangle and the center of the secondary component. is the albedo of the primary component, means total absorption of radiation, means total reflection.
4.2 Light curve synthesis
The light curve is synthesized using a two-dimensional pixel grid onto which the image of binary system at a particular position is projected. This subsection describes how this is done in our code.
One of the biggest difficulties in computing the total flux from the binary system at a given orbital phase and inclination is the problem of determining which parts of the system are visible and should be taken into flux determination. One approach is to approximate each surface element by a single point, then trace the ray of light from that point to observer and check whether it intersects any other surface on its way. While this method is as accurate as the point–approximation, it is relatively slow since it involves three–dimensional lines.
We have taken a different approach. The approximation of stars and disk with a network of triangles is ideal when projecting a binary system image onto a two-dimensional pixel grid since a triangle can be filled using a simple algorithm (Bresenham 1965) which does not involve neither multiplication nor division. Triangles that are facing away from observer are not considered. The remaining triangles are sorted by distance and projected in descending order onto pixel grid. If the closer triangle partially covers the further triangle, it simply ‘overwrites’ the other triangle’s pixels with its own pixels. What remains after all triangles have been projected is a two–dimensional image of the binary system. Thus, the visibility problem is solved.
Since only normalized light curves are used in our code, we define the flux from a single triangle as the product of its surface and the blackbody intensity for the triangle temperature. At a given orbital phase the total flux from all the visible pixels is divided by the total flux at phase 0.25.
We also include the possibility of having a source of this “third light,” i.e. an unobscured component which provides a constant contribution to the light curve in all orbital phases.
4.3 Minimization by Genetic algorithm
Each synthetic model of the binary system with an accretion disk can be characterized by its light curve which is observed by an observer located at a large distance from the binary system’s center. In order to deduce the parameters of the binary as well as the details of the accretion disk temperature distribution one needs to find that synthetic model whose light curve best matches the observed light curve. In practice this means using a minimization procedure on a set of parameters which describe the model. In this work we have employed the genetic algorithm (GA), see e.g. Charbonneau (1995), as the minimization procedure. GA is very efficient in case of a large number of parameters and especially in case of the image reconstruction.
The basic idea is to consider a set of binary system models which are described by their basic stellar (mass ratio, Roche lobe filling factors, stellar effective temperatures, inclination) and accretion disk parameters (radius, height) as well as the accretion disk temperature distribution (image). From the standpoint of a general GA, each model is simply a set of real numbers which we call organism in the rest of this section.
In general, we define the fitness of an organism as a continuous monotonous function of its parameters. In our particular case we define the fitness as the function of the light curve synthesized from the organisms parameters and the observed light curve. Since it is desirable that the fitness increases as the difference between the two light curves decreases, we define fitness as
| (2) |
where is the observed light curve containing points and is the light curve synthesized from the organism at exactly the same orbital phases present in .
The GA starts with the random population of organisms which are sorted according to their fitness. The most-fit (better) half of the population is selected for reproduction, so that “parent” pairs are randomly selected (with better organisms being more probable to be selected than worse (less-fit) organisms) and then two “children” from each pair are created to replace the worse half of the population. This “reproduction” process is performed analogously to the similar process in biology, i.e. the organisms are divided into chromosomes and then the chromosomes of the children are obtained from the chromosomes of the parents through crossover process: first child gets one part of the chromosome from the first parent and the second part from the second parent, while the second child gets the first part from the second and the second part from the first parent.
This process converges very quickly to the nearest local minimum. In order to avoid the “stagnation” of the population in a local minimum random “mutations” are introduced, such as “copy-errors” during crossover, random changes of the individual genes (numbers), as well as the global mutations such as the “asteroid hit”: a large number of the population is radnomly re-initialized.
Our fitting process consists of two steps:
-
1.
GA minimization of the binary system and accretion disk parameters without minimizing the accretion disk image (which is assumed to be a power-law function of radius);
-
2.
GA minimization of an accretion disk image while keeping the binary system’s parameters constant.
This splitting of our method is necessary due to the limited computational resources. A more general approach would involve an intrinsically three-dimensional disk geometry and would then simultaneously minimize both the geometry and the temperature distribution. However, the number of parameters that describe disk geometry would be much larger than in our approach. Unfortunately, these parameters would only make a difference in a relatively small part of the light curve near the minima, i.e. the amount of deviation from the symmetric shape. Therefore, one would need to use a prohibitively large number of organisms with a much larger set of parameters to minimize the light curve. Instead, we use our two-phase approach where the first phase can be thought of as the zeroth order phase (fitting of the light curve with axisymmetric disk temperature distribution and an optional hot spot), whereas the second phase can be thought of as the first order correction (asymmetries in the disk temperature distribution introduce irregularities in the symmetric light curve minima). We find this approach more practical at this time, due to the abovementioned limited computational resources.
| Parameter | Zoła | This |
| (1996) | work | |
| Mass ratio, | 0.16 | 0.19 |
| Inclination, | 87.8 | 88.2 |
| Mass of gainer, [M⊙] | 7.82 | 8.2 |
| Mass of loser, [M⊙] | 1.25 | 1.6 |
| Radius of loser, [R⊙ | 76 | 71 |
| Disc outer radius, [R⊙] | 132 | 124 |
| Disc thickness, [R⊙] | 14.5 | 17 |
| Disc outer temp., [K] | 1500 | 3600 |
5 Binary parameters
As shortly described in Sect. 1, both Zoła (1996) and Daems (1998) have analyzed the light curves of W Cru with a disk model. Zoła used mean light curves constructed from Marino et al. (1988), and Pazzi (1993) photoelectric photometry, respectively. Daems study was based on then unpublished Geneva photometry. Both studies have arrived to a quite consistent set of the parameters. While in our initial calculations we have started with the parameters which have cover very broad range in the parameter space, it was immediately clear that solutions will be in the narrow range around the values specified by Zoła, and Daems, respectively.
Since we are looking for the optimal set of the parameters in a multi-dimensional parameter space it is recommended to fix as many parameters as possible. Therefore, we assigned theoretical values to gravity brightening, limb darkening, and albedo coefficients. The effective temperature of the G supergiant, only visible stellar component, has been derived by Daems (1998) from the spectral energy distribution in the broad wavelength span, from IUE UV to optical and IR photometry obtained at ESO. He has arrived to K.
Since W Cru is a single-lined SB and only the mass-function is known, mass ratio has to be derived from the light curves. In our, as in previous studies, a conservative assumption that mass-loosing component is filling its critical Roche lobe, is assumed. Therefore, its size is determined by mass ratio. This fact makes determination of the mass-ratio more easy through ellipticity effect. Otherwise, mass ratio will be poorly determined.
Whatever initial set of parameters used, the solution has converged to the case with no primary visible at all. The, final search for the optimal set of the parameters was made with the remaining two binary parameters: the mass ratio , inclination of the orbit , and the following three disk parameters; disk outer temperature , angle defining disk semithickness, and disk outer radius .
The optimal solution, as defined by minimization with the Genetic Algorithm (see Sect. 4.3 for details) has given for the mass ratio , and inclination . This should be compared to , and derived by Zoła, and , and derived by Daems depending on cycle.
In combination with the mass-function R⊙ (Woolf 1962) for given mass ratio and inclination one can calculate the masses of the components. We get, M⊙, and M⊙. The sum of the masses, with the period which is known, gives the separation of the components R⊙. Since in the semi-detached configuration a relative size of the Roche-lobe filling component is uniquely determined by the system’s mass ratio the radius of the supergiant in W Cru is R⊙.
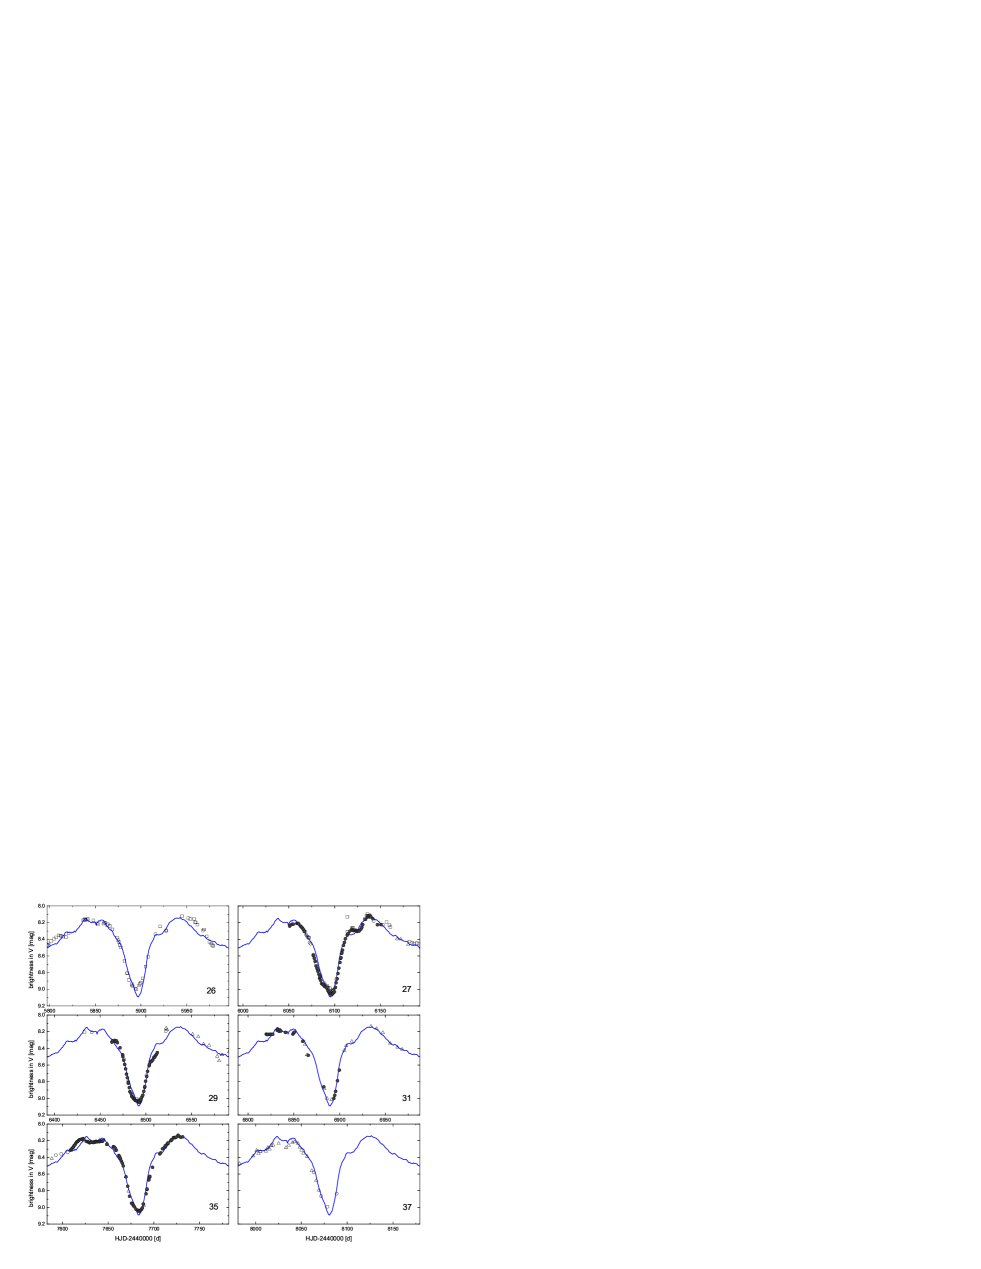
The optimal geometrical disk parameters are: , and which translate to R⊙, and the semithickness at the outer disk edge R⊙. The later parameter also defines an upper limit on the radius of the invisible component R⊙. This supports the hypothesis that the primary component which is completely hidden by a thick accretion disk, is a mid-B MS star. Tabulation of Harmanec (1988) for the B-type MS star of mass about 8 M⊙ gives R⊙, hidden well inside thick disk we have found, in particular for almost edge-on view. Fig. 3 is showing time series plot of all available photoelectric data along synthesized light curve on the basis of our solution from Tab. 2. Intrinsic variations, as discussed in Sect. 3, are clearly seen as due to variations in disk properties, both radiative and geometrical.
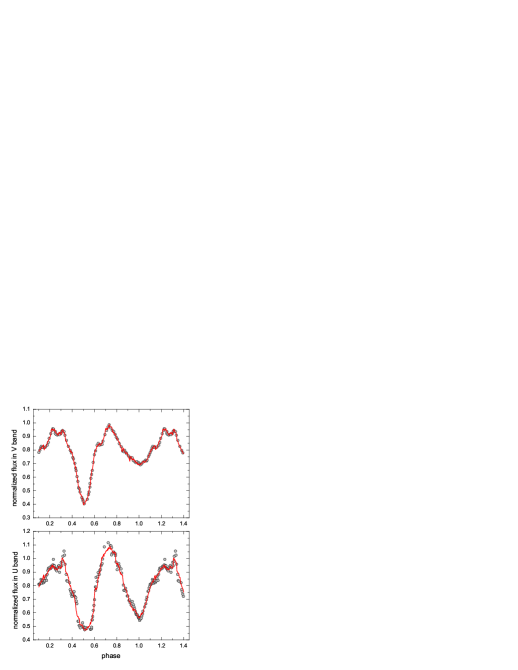
We have attempted to compute solution for the -band light curve. While keeping binary and stellar parameters at the same values as in the -band solution, only disk parameters were allowed to be adjusted. As expected, disk parameters differ for different passbands with the disk more extended both in radial and vertical direction and with a higher disk-rim temperature in the -band ( R⊙, R⊙, and K). This is not surprising since both minima in -band light curve are almost the same depth and slightly more broader than in -band light curve (c.f. Fig. 2).
Zoła (1996) calculated a disk edge temperature using Smak’s (1992) formula. Depending on the light curves used for the photometric solution he obtained K, and 2000 K, respectively. Disk rim temperature derived in our modeling differs from Zoła’s estimates, and in particular for the U-band is considerably larger. Even seen edge-on the disk is an important source of radiation; as is seen in Fig. 2 the minima are almost equal. It is an eclipsing body producing a deep primary eclipse, and quite a long secondary eclipse without visible eclipse-shoulders.
6 An image of disk
An optimal set of the binary and disk parameters give only the first approximation to the light curve. Symmetric model of the binary can by no means give a fit to the light curves which exhibit a complex structure with asymmetric ascending and descending eclipse branches, unequal maxima, and a number of bumps/humps in the light curve (Fig. 3). This was a serious problems faced by previous modelers as already described in Sect. 1. Once an optimal set of the parameters is found we can proceed with the second step in minimization (Sect. 4.3). In this step our minimization procedure has to recover the surface brightness distribution of an accretion disk. The disk is divided in a grid of triangles. In looking for an optimal map of the disk brightness distribution the intensities of triangles could be varied. The optimal map is a reconstructed disk image. The information contained in the complete light curve is used, not only the parts covered in the eclipse (in the case of W Cru this will be the secondary eclipse).
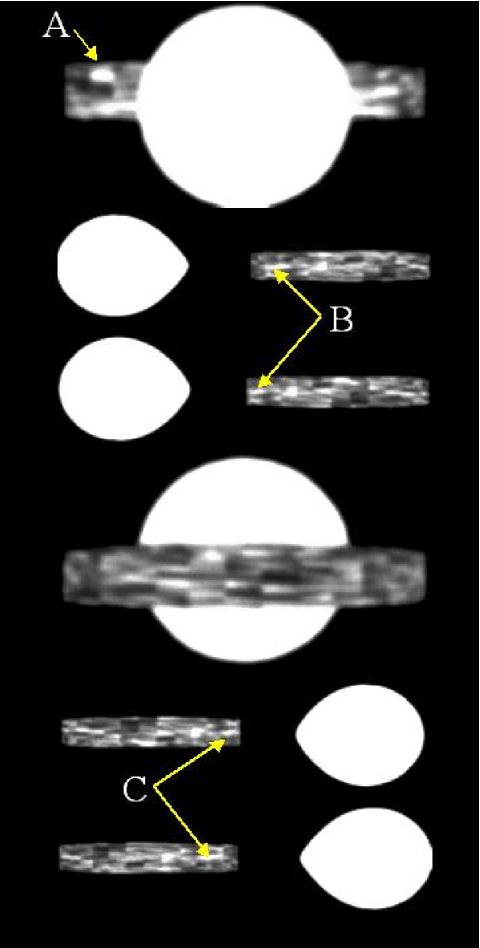
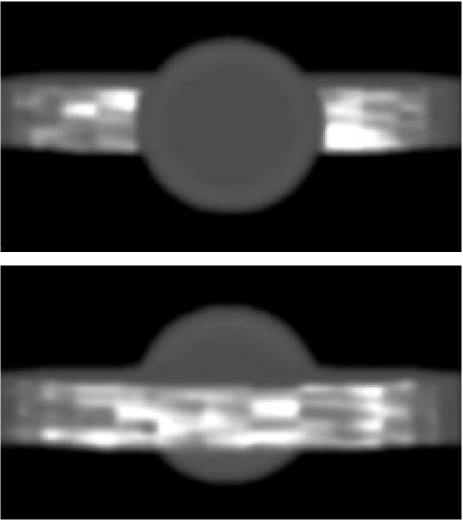
In Fig. 4 reconstructed disk images are shown for several important phases in spectral passband. Since inclination is high we see almost a disk rim. The disk rim appears rather clumpy with nonuniform brightness distribution. It is difficult to speak on some structures but on the image in phase 0.0 when disk rim is visible in full extension some kind of long ’filamentary’ or ’stream’ structures might be recognized. There is an impression that they are slightly tilted to the orbital plane. Similar clumpy structures are revealed from -band light curve modeling (Fig. 5). Initial disk parameters are listed in Tab. 1, and an image reconstruction is obtained in the same procedure as was elaborated for the -band.
Hydrodynamical calculations of the gas flow in the close binaries have been performed focusing mostly on the study of accretion disks in cataclysmic variables. However, Bisikalo et al. (2000) have made calculations for the model which has resembled the long-period interacting binary Lyrae. So far, this is the only hydrodynamical simulations conducted for long-period interacting binaries. Some important conclusions from their work are as follows: 1) the matter of the gas stream from the Roche-lobe filling component is redistributed into two parts, one that forms a quasi-elliptic accretion disk, and the other which forms a circumstellar envelope around the mass-gaining component, 2) the gas stream approaches the disk tangentially and does not lead to the formation of the usually postulated ‘hot spot’, 3) in fact, the interaction between the gas from the circumstellar envelope and the stream results in the formation of an intensive shock wave, and faces the accreting star, and 4) a part of the gas from the circumstellar envelope is deflected away from the orbital plane after interaction with the incoming stream and leaves the system while the other one moves in the orbital plane, encircles the accretor and then collides with the stream. It is evident that hydrodynamical simulations of mass flow in the interacting binaries like Lyrae have shown a variety of the structures like accretion disk, circumstellar envelope, ’hot line’ and cool stream, halo.
Very recent polarimetric study of W Serpentis, a prototype of this isolated class of the strongly interacting binary stars, has been accomplished by Piirola et al. (2005). This system resembles many similarities with W Cru described in the present work (an asymmetric eclipse, large perturbations in the light curve also outside the eclipse, color variations in and outside the eclipse, etc.). Their detail modeling of the polarization measurements has shown complex structure of the circumstellar envelope in which the primary (hot) component is embedded. While photometric and spectroscopic studies have revealed the existence of a geometrically and optically thick accretion disk around the hot component, no disk is seen in polarized light probably because multiple scattering and absorption effects in the optically thick medium reduce the polarization of the light. The authors have localized scattering ’spot’ which is probably associated with the optically thin polar regions. Similar effect in polarization behavior would be produced by a jet emerging perpendicular to the disk plane. It is obvious that Piirola et al. (2005) polarimetric study of W Ser emerged to the model similar to Lyr as proposed by Harmanec et al. (1996) from an interferometric study, and supported by spectropolarimetric investigation by Hoffman et al. (1998).
Our disk image reconstruction is based on a model that includes only an accretion disk and probably suffers from the absence of additional structures, in particular stream of the matter from cool companion in direction of more massive component and/or its, already, formed accretion disk. But pseudophotosphere of this optically thick disk which has completely hidden hot component of the binary system has undertaken its role in the emission of radiation.
7 Conclusion
Systematic photoelectric photometry of the long-period eclipsing binary W Cru in 7-color Geneva system has been carried out at the Swiss Telescope at La Silla from 1984-1989 and is, for the first time, presented in this paper. Several cycles of this almost 200 days long period binary system have been covered. Signatures of the still present activity in this system are obvious: maxima of the light curves are unequal, asymmetry is present in the eclipse branches, humps/bumps are present in the light curve and migrate from cycle-to-cycle, the width of the eclipses are varying. Previous research on this binary is corroborated: modeling of the light curve with an accretion disk model has revealed geometrically and optically thick accretion disk in which a more massive and presumably hotter component of mid-B type is completely hidden.
We have used 3D eclipse-mapping technique to reconstruct an accretion disk image. Since the binary is viewed almost edge-on our map revealed an image of accretion disk rim only. Its nonuniform brightness distribution reveals rather clumpy structure. We shortly discussed reconstructed disk image with hydrodynamical simulations of the matter flow in semi detached binaries which have shown that a number of features and structures might be formed in such processes.
Acknowledgements.
We acknowledge constructive comments from our referee Dr. Petr Harmanec which improved this paper. The observational part of this work has been partly supported by the Swiss National Science Foundation. KP acknowledges financial support from Croatian MZOS through research grant #0119254.References
- (1) Andersen, J., Pavlovski, K., & Piirola, V. 1989, A&A, 215, 272
- (2) Bisikalo, D. V., Harmanec, P., Boyarchuk, A. A., Kuznetsov, O. A., & Hadrava, P. 2000, A&A, 353, 1009
- (3) Bresenham, J. E. 1965, IBM Systems Journal 4, 25
- (4) Burki, G., 2006, Geneva photometric database, http://obswww.unige.ch/gcpd/ph13.html
- (5) Burnet, M., & Rufener, M. 1979, A&A, 74, 54
- (6) Charbonneau, P. 1995, ApJS, 101, 309
- (7) Daems, K. 1998, PhD Thesis, Katholieke Universiteit Leuven
- (8) Golay, M., 1980, Vistas in Astronomy 24, 141
- (9) Harmanec, P. 1998, Bull. astr. Inst. Czechosl. 39, 329
- (10) Harmanec, P. 2002, AN 323, 87
- (11) Harmanec, P., Morand, F., Bonneau, D., et al. 1996, A&A, 312, 879
- (12) Hilditch, R. W. 2001, An Introduction to Close Binary Stars, Cambridge University Press, Cambridge
- (13) Hoffman, J. L., Nordsiek, K. H., & Fox, G. K. 1998, AJ, 115, 1576
- (14) Horne, K. 1985, MNRAS 213, 129
- (15) Huang, S.-S. 1963, ApJ 138, 342
- (16) Kviz, Z., & Rufener, F. 1988, Inf. Bull. Var. Stars No. 3158
- (17) Knee, L. B. G., Scarfe, C. D., Mayor, M., Baldwin, B. W., & Meatheringham, S. J. 1986, A&A 168, 72
- (18) Kohoutek, L. 1988, Inf. Bull. Var. Stars No. 3272
- (19) Linnell, A. P. 2000, MNRAS 319, 255
- (20) Lubow, S. H., & Shu, F. H. 1975, ApJ 198, 383
- (21) Lucy, L. B. 1967 Z. Astrophys. 65, 89
- (22) Manfroid, J., Sterken, C., Bruch, A., et al. 1991, A&AS, 87, 481
- (23) Marino, B. F., Walker, S. G., & Budding, E. 1988, Ap&SS 150, 103
- (24) Marsh, T. R., & Horne, K. 1988, MNRAS 235, 269
- (25) Mimica, P., & Pavlovski, K. 2003, in ASP Conf. Ser. 292, 405
- (26) Pavlovski, K., & Kříž, S. 1985, Bull. astr. Inst. Czechosl. 35, 135
- (27) Pavlovski, K., Burki, G., & Mimica, P. 2005, Ap&SS, 296, 417
- (28) Pavlovski, K., Schneider, H., & Akan, M. C. 1992, A&A, 258, 329
- (29) Pazzi, L., 1993, Inf. Bull. Var. Stars No. 3847
- (30) Piirola, V., Berdyugin, A., Mikkola, S., & Coyne, G. V., S.J. 2005, ApJ, 632, 576
- (31) Plavec, M. J. 1980, in IAU Symp. 88, 251
- (32) Plavec, M. J. 1984, Inf. Bull. Var. Stars No. 2524
- (33) Plavec, M. J., & Koch, R. H. 1978, Inf. Bull. Var. Stars No. 1482
- (34) Plavec, M. J., Weiland, J. L., & Koch, R. H. 1982, ApJ 256, 206
- (35) Rufener, F., 1964, Publ. Obs. Genèv e, A, 664
- (36) Rufener, F., 1985, in IAU Symp. 111, 253
- (37) Rufener, F., 1988, Catalogue of Stars Measured in the Geneva Observatory Photometric System, 4e Edition, Obs. Genève
- (38) Rufener, F., Nicolet, B., 1988, A&A 206, 357
- (39) Rutten, R. G. M. 1998, A&AS 127, 581
- (40) Sterken, C., Manfroid, J., Anton, K., et al. 1993, A&AS, 102, 79
- (41) von Zeipel, H. 1924, MNRAS 84, 665
- (42) Wilson, R. E., & Caldwell, D. L. 1978, ApJ 221, 917
- (43) Woolf, N. J. 1962, MNRAS 123, 399
- (44) Zoła, S. 1991, Acta Astron. 41, 213
- (45) Zoła, S. 1996, A&A 308, 785
- (46) Zoła, S., & Ogłoza, W. 2001, A&A 368, 932
- (47) Zoła, S., Hall, D. S., & Henry, G. W. 1994, A&A 285, 531