11email: nemesio.rodriguez@obs.u-bordeaux1.fr 22institutetext: Université Denis Diderot (Paris VII) & Observatoire de Paris, 61 Av de l’Observatoire, F-75014 Paris, France 33institutetext: LERMA, Observatoire de Paris, 61, Av. de l’Observatoire, 75014, Paris, France
[CII] emission and star formation in the spiral arms of M31 ††thanks: Based on observations with ISO, an ESA project with instruments funded by ESA Member States (especially the PI countries: France, Germany, The Netherlands and the UK) and with the participation of ISAS and NASA.
Abstract
Context. The [Cii] 158 m line is the most important coolant of the interstellar medium in galaxies but substantial variations are seen from object to object. The main source of the emission at a galactic scale is still poorly understood and candidates range from photodissociation regions (PDRs) to the cold neutral or diffuse warm ionized medium. Previous studies of the [Cii] emission in galaxies have a resolution of several kpc or more so the observed emission is an average of different ISM components.
Aims. The aim of this work is to study, for the first time, the [Cii] emission at the scale of a spiral arm. We want to investigate the origin of this line and its use as a tracer of star formation.
Methods. We present [Cii] and [Oi] observations of a segment of a spiral arm of M 31 using the Infrared Space Observatory. The [Cii] emission is compared with tracers of neutral gas (CO, Hi) and star formation (H, Spitzer 24 m).
Results. The similarity of the [Cii] emission with the H and 24 m images is striking when smoothed to the same resolution, whereas the correlation with the neutral gas is much weaker. The [Cii] cooling rate per H atom increases dramatically from ergs s-1 atom-1 in the border of the map to ergs s-1 atom-1 in the regions of star formation. The [Cii]/FIR42-122 ratio is almost constant at 2%, a factor 3 higher than typically quoted. However, we do not believe that M 31 is unusual. Rather, the whole-galaxy fluxes used for the comparisons include the central regions where the [Cii]/FIR ratio is known to be lower and the resolved observations neither isolate a spiral arm nor include data as far out in the galactic disk as the observations presented here. A fit to published PDR models yields a plausible average solution of and for the PDR emission in the regions of star formation in the arm of M31.
Key Words.:
Galaxies: spiral – Galaxies: ISM – Infrared: ISM – stars: formation – ISM: molecules – Galaxies: individual (Messier 31)1 Introduction
The [Cii] 158 m fine structure line is the strongest spectral line in the universe, carrying typically close to 1% of the energy emitted in the Far-IR from galaxies. This line has a critical density for excitation around 1000 cm-3, and is therefore widespread in galaxies. Previous studies of [Cii] emission in spiral galaxies include Madden et al. (1993), Nikola et al. (2001), Kramer et al. (2005), and Braine & Hughes (1999) for respectively NGC 6946, M 51, M 83, and NGC 4414, and Malhotra et al. (2001) for a statistical study. All of these have a resolution of several kpc and thus average a wide variety of environments within the beam. Carbon is ionized more easily than Hydrogen so [Cii] emission, although from an ion, can arise from ionized Hii regions to mainly neutral photo-dissociation regions (PDR; e.g. Tielens & Hollenbach 1985) at the border of molecular clouds, exposed to UV radiation from young massive stars. A significant contribution could also come from the diffuse atomic interstellar gas, as shown by Crawford et al. (1985) and Madden et al. (1993), or the diffuse ionized medium (Heiles 1994). However, the main contributions are not known in detail, especially at high spatial resolution.
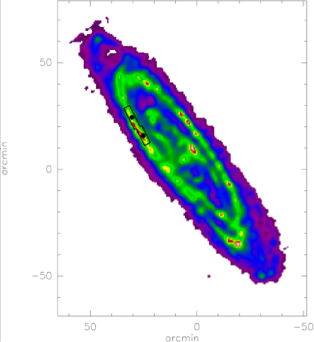
Far from the first study of [Cii] emission, the present work is unique in that we study emission at the scale of a spiral arm, only possible in the very nearby spirals M 31 or M 33. M 31 is the nearest density-wave spiral galaxy, where we can test large-scale dynamics and star formation. It is the only density-wave galaxy where spiral arms are resolved by ISO (M33 being more stochastic), as shown in Fig. 1. The scale of the [Cii] observations presented here is new and allows us to study the spiral arm environment separate from the rest of the galaxy. With a focus on testing the origin of the [Cii] line, we compare the [Cii] emission across an arm in M 31 with the CO and HI, tracing the neutral gas, the H emission tracing ongoing star formation but suffering from extinction, and the Spitzer 24m image tracing the warm dust heated by recent star formation. [Cii] emission as a tracer of star formation has the advantage of not being affected by interstellar extinction.
2 Observational data
We have observed a portion of the northern spiral arm of M31 in the [Cii] 157.7 m and [Oi] 63.8 m lines using the Long Wavelength Spectrometer (LWS) onboard the Infrared Space Observatory (ISO). The observed region, which is shown in Fig. 1 on a 175 m image by Haas et al. (1998), is the most intense region of star formation in M 31 and contains a large concentration of Hii regions (Devereux et al. 1994). The [Cii] line was observed with two raster maps of points centered at RA= and Dec= (J2000) and points centered at RA= and Dec= (J2000). The ISO observation numbers (TDT numbers) of those observations are 58001701 and 58001801, respectively. In addition, we have mapped the [Oi] 63.8 m line in the central positions of the [Cii] maps with two small rasters of points (TDTs 58001703 and 58001903). The raster maps were oriented along the spiral arm at an angle of 63 deg. For all the maps, the observed points are separated by 1’. Tables 1 and 2 give the exact observed positions.
The lines were scanned in the LWS 02 mode at a spectral resolution of 0.29 and 0.6 m for the [Oi] 63 m and the [Cii] 158 m lines, respectively. The effective aperture of the LWS detectors is for the [Oi] line and for the [Cii] line (Gry et al. 2003). The observations were processed through the off-line processing (OLP) software version 10. Further reduction was done with ISAP. The data reduction consists basically in dropping bad data points, shifting the different scans taken with each detector to a common level and averaging all the data for each detector. In addition, with ISAP we have defringed the spectra to get rid of the well-known interference pattern for the long wavelength detectors. We fitted order 1 baselines to the spectra in the vicinity of the lines and Gaussian curves to the lines using ISAP. Tables 1 and 2 give the [Cii] line fluxes and errors as derived from the Gaussian fits. The absolute flux calibration uncertainties for the LWS01 mode are smaller than 20% (Gry et al. 2003).
We also present an archival Spitzer Space Telescope image of the same region taken with the MIPS instrument at 24 m, with a spatial resolution of about . The other data sets used here are H from Devereux et al. (1994), HI from Brinks & Shane (1984), CO(1–0) emission from Nieten et al. (2005), and the combined 60 and 100 m IRAS maps.
| [Cii] | [Cii] | [Cii] | [Cii] | ||||||||
|---|---|---|---|---|---|---|---|---|---|---|---|
| -3.37 | -3.33 | 7.0 0.8 | -2.47 | -3.78 | 10.1 0.7 | -1.59 | -4.23 | 14.5 0.5 | -0.69 | -4.69 | 8.7 0.4 |
| -2.92 | -2.45 | 7.4 0.8 | -2.02 | -2.89 | 10.2 0.4 | -1.13 | -3.35 | 16.1 0.1 | -0.23 | -3.79 | 10.1 0.5 |
| -2.47 | -1.56 | 6.1 0.7 | -1.57 | -2.00 | 13.0 0.8 | -0.68 | -2.46 | 23.1 0.6 | 0.22 | -2.90 | 11.6 0.9 |
| -2.01 | -0.66 | 5.1 0.7 | -1.12 | -1.10 | 12.2 0.3 | -0.23 | -1.57 | 21.0 2.0 | 0.67 | -2.00 | 16.5 0.6 |
| -1.56 | 0.23 | 6.3 0.8 | -0.67 | -0.21 | 10.5 0.5 | 0.22 | -0.68 | 18.3 0.7 | 1.12 | -1.11 | 20.0 1.0 |
| -1.11 | 1.12 | 5.2 0.8 | -0.22 | 0.68 | 9.5 0.7 | 0.67 | 0.22 | 21.7 0.4 | 1.57 | -0.22 | 18.6 1.3 |
| -0.66 | 2.01 | 6.6 0.2 | 0.24 | 1.57 | 7.8 0.3 | 1.12 | 1.11 | 20.0 0.6 | 2.02 | 0.67 | 18.2 0.5 |
| -0.21 | 2.91 | 8.9 0.8 | 0.69 | 2.47 | 9.2 0.5 | 1.57 | 2.00 | 18.8 0.6 | 2.47 | 1.56 | 16.9 0.9 |
| 0.24 | 3.79 | 4.0 2.0 | 1.14 | 3.36 | 8.5 0.1 | 2.03 | 2.89 | 15.9 0.4 | 2.93 | 2.46 | 17.8 0.4 |
| 0.69 | 4.69 | 4.6 0.3 | 1.58 | 4.25 | 8.3 0.7 | 2.48 | 3.79 | 17.7 0.8 | 3.37 | 3.34 | 18.3 1.0 |
| [Cii] | [Cii] | [Cii] | [Cii] | ||||||||
|---|---|---|---|---|---|---|---|---|---|---|---|
| -3.82 | -4.23 | 8.0 0.7 | -2.92 | -4.67 | 18.1 0.5 | -2.04 | -5.13 | 17.3 1.4 | -1.14 | -5.58 | 13.0 1.4 |
| -3.37 | -3.35 | 6.6 0.4 | -2.47 | -3.78 | 16.8 1.1 | -1.59 | -4.25 | 28.1 0.5 | -0.69 | -4.68 | 16.2 0.8 |
| -2.92 | -2.45 | 5.4 0.2 | -2.02 | -2.89 | 11.8 1.4 | -1.13 | -3.35 | 18.4 0.6 | -0.23 | -3.79 | 12.2 0.5 |
| -2.47 | -1.56 | 4.5 0.4 | -1.57 | -2.00 | 7.2 0.6 | -0.68 | -2.46 | 11.6 0.8 | 0.22 | -2.90 | 8.8 0.7 |
| -2.02 | -0.66 | 4.6 0.4 | -1.12 | -1.10 | 5.9 0.7 | -0.23 | -1.57 | 13.7 1.2 | 0.67 | -2.01 | 8.5 0.9 |
| -1.57 | 0.22 | 6.2 0.6 | -0.66 | -0.21 | 7.6 0.7 | 0.22 | -0.68 | 14.5 0.7 | 1.12 | -1.11 | 9.2 0.8 |
| -1.11 | 1.12 | 6.0 0.7 | -0.22 | 0.68 | 11.9 0.6 | 0.67 | 0.22 | 14.9 0.7 | 1.57 | -0.22 | 9.9 0.5 |
| -0.66 | 2.01 | 8.3 0.4 | 0.24 | 1.57 | 17.9 1.0 | 1.12 | 1.11 | 23.0 0.6 | 2.02 | 0.67 | 8.8 0.7 |
| -0.21 | 2.91 | 8.5 0.2 | 0.69 | 2.47 | 13.7 0.9 | 1.57 | 2.00 | 19.2 0.5 | 2.47 | 1.56 | 7.1 1.0 |
| 0.24 | 3.79 | 8.3 0.8 | 1.14 | 3.36 | 10.7 0.3 | 2.03 | 2.89 | 12.5 0.9 | 2.92 | 2.46 | 5.9 0.6 |
| 0.69 | 4.69 | 6.6 0.3 | 1.59 | 4.25 | 10.1 0.7 | 2.48 | 3.79 | 10.8 0.7 | 3.38 | 3.34 | 7.3 0.8 |
| 1.14 | 5.58 | 4.4 0.6 | 2.03 | 5.14 | 7.8 0.5 | 2.93 | 4.68 | 7.5 1.4 | 3.82 | 4.23 | 6.1 0.7 |
3 Origin of the [Cii] emission
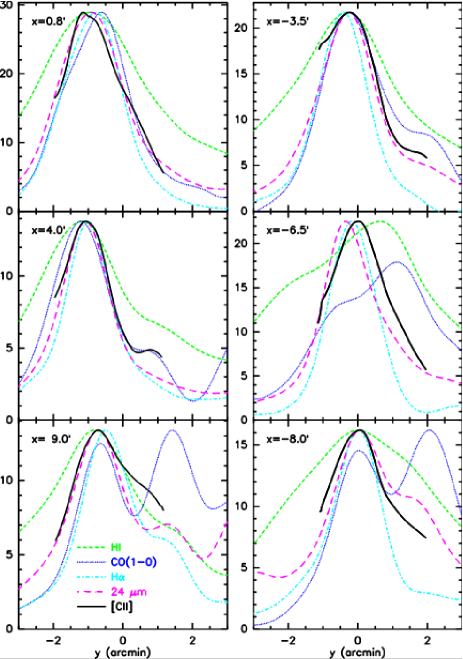
Figure 2 shows the contour map of the [Cii] line integrated intensity overlaid on different images of other tracers of neutral (Hi, CO) and ionized gas (H) and dust continuum emission at 24 m and the combined 60 and 100 m IRAS maps. All the images have been reprojected using an orthographic projection with center in RA= and Dec= (J2000) and rotated by 63 deg. This is the coordinate system that we use in the following. The right panels show the [Cii] map superposed on the same tracers but smoothed to the same resolution as the [Cii] (about ). In addition, since one of the goals of the observations was to study how the [Cii] emission varied across a spiral arm, we have also made a set of cuts perpendicular to the arm in all the tracers smoothed to the same angular resolution (Fig. 3). All the peaks have been normalized to the maximum intensity of the [Cii] line.
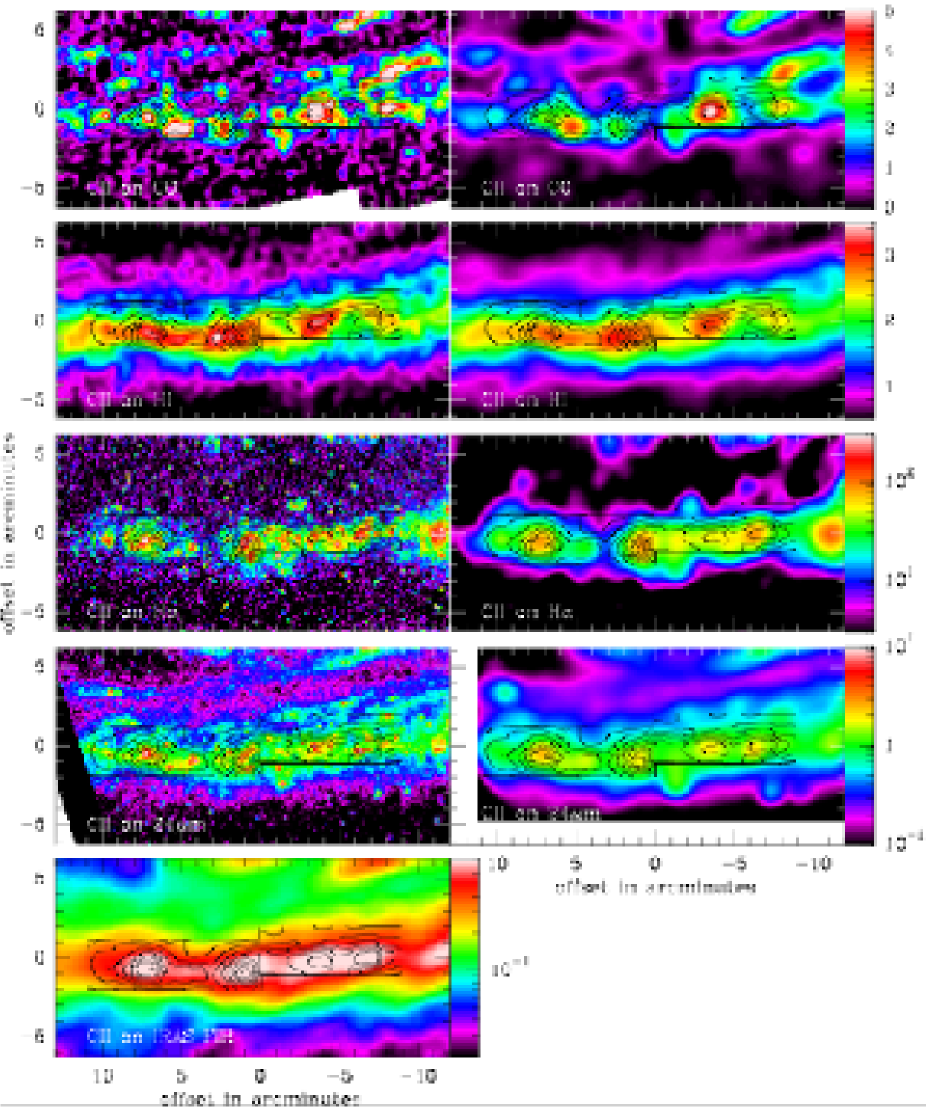
Inspection of the maps in Fig. 2 shows that the [Cii] emission peaks are typically not coincident with the CO maxima, although they generally trace the same part of the spiral arm. The upper right corner of the [Cii] map shows little emission despite a maximum in CO. Interestingly, the molecular gas in that area appears rather quiescent as it is generally weak in the tracers of star formation. This is clear in Fig. 3. Single-peaked CO profiles (for example x=4’, 0.8’, -3.5’) are symmetrical with respect to the arm crest and very similar to the H and 24 m ones, suggesting that the regions with strong CO emission and little star formation are intrinsically different (see for instance x=9’, y=1.5’).
It is immediately clear in Fig. 2 that the [Cii] emission in the arm follows the tracers of star formation (H, 24 m), rather than the neutral gas (CO, Hi), such that little of the emission in a spiral arm environment comes from the cold neutral medium (CNM) as proposed by Bennett et al. (1994) and Wolfire et al. (1995). This can also be seen in the right panels, where there is excellent agreement between the [Cii] contours and the smoothed H and 24 m images. The solution of the inverse problem is not unique but the agreement is so good, in particular with the smoothed 24 m, that a high angular resolution [Cii] image should be very similar to the Spitzer image of the warm dust emission.
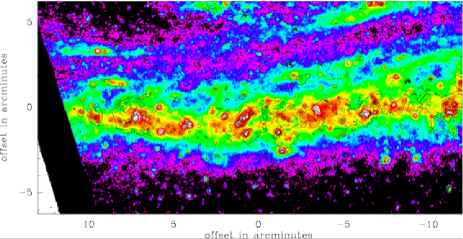
The high angular resolution H and 24 m images show many discrete sources in addition to an extended component. Most of the sources seen in the warm dust emission at 24 m are detected in H as well in spite of the extinction. Figure 4 shows the contours of H flux overlaid on the Spitzer 24 m emission – the similarity is striking. This confirms the result by Devereux et al. (1994) – but at 5′′ resolution rather than the of IRAS – that despite the extinction expected for a spiral arm, the H line flux yields a very similar picture of the star formation as far-infrared (FIR) continuum, showing that even the young regions of star formation are not so dust-enshrouded that they are not bright in the H line.
4 The [Cii]/FIR ratio
We have used the IRAS fluxes to calculate the [Cii]/FIR ratio flux in the same way as earlier works. It should be noted that “FIR” here refers to the 42 – 122 m flux, roughly half the total thermal dust emission. The [Cii]/FIR42-122 ratio in the mapped region is almost constant at 2%, well above the value in the central regions of M 31 (0.6 ; Mochizuki 2000). In the Milky way, the [Cii]/FIR ratio also increases from 0.2 in the center (Rodríguez-Fernández et al. 2004) to 0.6 in the disk (Nakagawa et al. 1995). Regarding other external galaxies, few data of sufficient sensitivity are available. In the case of NGC6946 (Madden et al. 1993), the [Cii]/FIR ratio increases from 0.2 in the center to 0.9 in the northern spiral arm (at a distance of kpc). In the observations of M51 reported by Nikola et al. (2001), the [Cii]/FIR ratio varies from 0.6 in the nucleus to 1.3 in the spirals arms located at kpc from the center. Our data confirm that the [Cii]/FIR ratio increases with radius in galactic disks and the high [Cii]/FIR ratio measured here is found at kpc from the center. The study of the dense molecular gas emission by Brouillet et al. (2005) has already shown that the physical properties of the interstellar medium change with galactocentric distance in M31, as was found by Sodroski et al. (1997) for the Milky Way.
However, it is unclear what physical mechanisms are responsible for this behavior. Statistical studies of different galaxies (Malhotra et al. 2001) have shown a tendency for the [Cii]/FIR ratio to decrease with increasing IRAS 60/100 ratios, i.e. when the dust temperature increases. As discussed by Contursi et al. (2002), this effect is also weakly present along the disks of NGC1313 and NGC6946. A possible explanation is that strong UV fields heat the dust to higher temperatures (high 60/100 ratio) than weaker fields but they can also increase the positive charge of the dust grains and reduce the efficiency of the photoelectric effect, which is the main heating mechanism in the region of the PDRs where the [Cii] dominates the cooling. As a result, the [Cii]/FIR ratio decreases.
We have calculated the 60/100 ratio in the region of the [Cii] map. The values range from 0.2 at the [Cii] minima to 0.5 at the [Cii] (or FIR) peaks (which trace star formation). The sources of Malhotra et al. (2001) and Contursi et al. (2002) with a 60/100 ratio in the range 0.2-0.5 have [Cii]/FIR ratios of 0.4-1 . In contrast, the [Cii]/FIR in the region studied in this paper is constant at 2 . Therefore, no correlation is present between the [Cii]/FIR and the 60/100 ratios and the [Cii]/FIR ratio is higher than in other sources with the same 60/100 ratio (Fig. 4 of Contursi et al. 2002).
5 Physical conditions
In this section we compare significant line-to-line and line-to-continuum ratios with other observations and PDR model calculations in order to derive the physical conditions of the [Cii] emitting gas. The [Cii]/CO(1–0) is particularly interesting, since it varies from about 1300 for galactic disks (Nakagawa et al. 1998; Braine & Hughes 1999), to about 6000 in starbursts (Stacey et al. 1991) and up to 23000 for the Large Magellanic Cloud (Mochizuki et al. 1994). Even in the same galaxy, this ratio can vary in large proportions. In the Milky Way, Fixsen et al. (1999) find that the [Cii]/CO ratio at large scale decreases from about 2000 in the inner galaxy to 1000 in the outer galaxy. Averaged over the [Cii] map, the [Cii]/CO(1–0) ratio in the spiral arm of M31 is 3600, ranging from about 1500 to 6000 near the bright regions of star formation. If the [Cii] were observed at higher resolution still, presumably yielding a brightness distribution similar to the 24m or H, the [Cii]/CO ratio would probably rise further still as the CO maxima are not positioned on the maxima in star formation as traced by the 24m or H.
One can use the [Cii]/FIR and [Cii]/CO ratios to study the physical conditions in the spiral arm of M31. In addition, the [Oi] 63 m line, which comes from the dense neutral surface of PDRs, can be used in conjunction with the [Cii] line to estimate the density of the emitting region – the higher the density, the higher the [Oi] to [Cii] ratio. We have measured [Oi]/[Cii] ratios of in and in . Such ratios are higher than for an average spiral disk ([Oi]/[Cii], Braine & Hughes 1999) and are predicted by the Kaufman et al. (1999) models for densities lower than the critical density of the [Oi] line ( cm-3) and FUV fields at the PDR surface, , of in units of the FUV intensity in the local ISM (1.3 10-4 ergs s-1 cm-2 sr-1 , Habing 1968) or for higher densities and very low incident fields (). However, the comparison of the measured [Cii]/CO(1–0) ratio with the Kaufman et al. (1999) predictions constrain the PDR parameters to and cm-3. The measured ([Oi]+[Cii])/FIR42-122 ratio, close to 0.03, is also in agreement with the model prediction in this region of the parameters space.
However, one should take into account that a fraction of the [Cii] emission can arise from the ionized gas. In this case, one should correct the observed fluxes before comparing to the PDR models. It is difficult to estimate the amount of [Cii] that can arise from the ionized gas but statistical studies of normal galaxies (Malhotra et al. 2001) and the Galactic center clouds (Rodríguez-Fernández et al. 2004) have shown that both contributions can be comparable. Thus we have also estimated the PDR parameters assuming that the [Cii] flux that arise from PDRs is only half of the observed flux. In this case, the comparison of the corrected [Oi]/[Cii] and [Cii]/CO(1–0) ratios with figures 4 and 9 of Kaufman et al. (1999) gives a result of and cm-3. The corrected ([Oi]+[Cii])/FIR42-122 ratio is also consistent with this result. Therefore, taking into account the uncertainties on the [Cii] flux that arises in the PDR, the solution space from the Kaufman et al. (1999) figures 4, 9, and 6 is around and (H cm-3 and fits the ([Cii]+[Oi])/FIR, [Oi]/[Cii], and the [Cii]/CO ratios.
In contrast, the predicted [Cii] intensity in this region of the parameter space is higher than the measured one. For instance, the predicted intensity for and is ergs s-1 cm-2 sr-1, 10 times higher than that observed; the [Cii] intensity at the positions observed in [Oi] is 1.2-1.5 ergs s-1 cm-2 sr-1. This can be accounted for assuming that the [Cii] emission is diluted in the ISO beam by a factor of . Thus, instead of , the angular extent of the [Cii] emitting regions would be , which is similar to the size of the intense sources detected in the (20pc) resolution 24 m image. The [Cii]/FIR ratio varies very little over the region observed in [Cii]. Assuming the FIR emission is also diluted by a factor 10, one gets a corrected FIR42-122 intensity of ergs s-1 cm-2 sr-1. For OB stars the FUV heating represents about half of the total grain heating so the incident field is about .
Finally, one can estimate the column density of atomic hydrogen in the PDR, which can be expressed in analytical form as cm-2 (Sternberg & Dalgarno 1989). For ratios of 0.01 – 0.1, cm-2. Roughly half of the observed Hi along the inner part of the spiral arm would then be the product of photodissociation of molecular gas by the star formation within the arm. PDRs observed in the Galaxy have , implying a greater Hi column density from photodissociation but over a much smaller area.
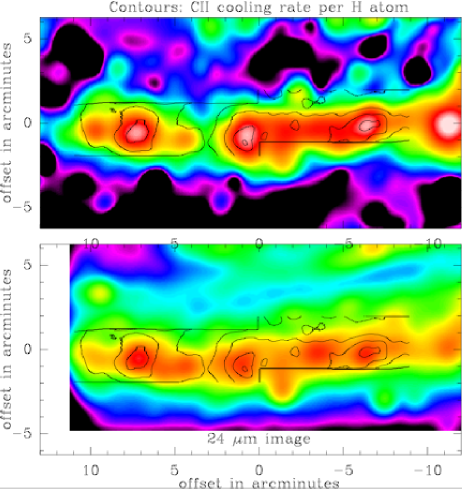
6 [Cii] cooling rate
In order to understand how to place these observations in the general framework, we determine the cooling rate of [Cii] per atom of Hi and per H atom including molecular gas , measured at the resolution of the [Cii] observations. The Hi column density was taken from Brinks & Shane (1984), calculated using the standard formula for optically thin Hi, and we assume a factor of cm-2/(K km s-1). The image of the cooling rate is plotted in Fig. 5 as contours over the H and 24 m smoothed images. varies from ergs s-1 atom-1 in the maxima at and to ergs s-1 atom-1 in the minima located around the upper border of the map. Thus, the [Cii] emission per H atom is much higher near zones of star formation, and varies roughly within the ranges expected for PDR gas (e.g. Wolfire et al. 1995; Boulanger et al. 1996) but higher than expected for the CNM (Wolfire et al. 1995).
There is little difference between and except near the main CO maximum because the Hi column dominates almost everywhere after smoothing to the resolution of the [Cii]. Because the CO maximum is not a [Cii] maximum, the cooling rate is particularly low there. The level of star formation is the important parameter for the [Cii] emission, not the CNM column density.
7 Conclusions
[Cii] emission is an excellent tracer of star formation. The [Cii] cooling rate per proton increases greatly with the level of star formation. Comparison with models indicates that a coherent picture can be obtained assuming the main source of spiral arm [Cii] emission is moderately dense PDRs. We estimate that the characteristic density and FUV radiation field at large scales are roughly 2000 cm-3 and , providing a satisfactory fit to the [Cii], [Oi], CO, and FIR emission.
The [Cii]/FIR ratio in the spiral arm region we observed in M 31 is high, about 2%, well above the typically quoted values of [Cii]/FIR% for galaxies. This is a major result as both the [Cii] and FIR data are well-calibrated. Looking at values and data found in the literature, the increase in the [Cii]/FIR ratio with distance from the center can be seen in earlier observations but little attention was called to the variation as the uncertainties were very high. The part of the arm we observed is much further out than any other [Cii] observations, which may help explain the high ratio. Furthermore, it is clear that in the centers of spiral galaxies the [Cii]/FIR ratio is lower than in the disk so surveys of unresolved galaxies sample a combination of disk and nuclear emission and as such can be expected to yield lower [Cii]/FIR values than the disks alone.
It is also interesting that even at the resolution of the Spitzer 24 m image, the FIR and H views of star formation are extremely similar – very little star formation is hidden, despite the nearly edge-on orientation of M 31.
Acknowledgements.
We would like to thank Nicolas Devereux for the H map of M31, Martin Haas for the ISOPHOT data, Elias Brinks for the Hi observations, and Nikolaus Neininger and Michel Guélin for permission to use the CO data.References
- Bennett et al. (1994) Bennett, C. L., Fixsen, D. J., Hinshaw, G., Mather, J. C., Moseley, S. H., Wright, E. L., Eplee, R. E., Gales, J., Hewagama, T., Isaacman, R. B., Shafer, R. A., & Turpie, K. 1994, ApJ, 434, 587
- Boulanger et al. (1996) Boulanger, F., Abergel, A., Bernard, J.-P., Burton, W. B., Desert, F.-X., Hartmann, D., Lagache, G., & Puget, J.-L. 1996, A&A, 312, 256
- Braine & Hughes (1999) Braine, J. & Hughes, D. H. 1999, A&A, 344, 779
- Brinks & Shane (1984) Brinks, E. & Shane, W. W. 1984, A&AS, 55, 179
- Brouillet et al. (2005) Brouillet, N., Muller, S., Herpin, F., Braine, J., & Jacq, T. 2005, A&A, 429, 153
- Contursi et al. (2002) Contursi, A., Kaufman, M. J., Helou, G., Hollenbach, D. J., Brauher, J., Stacey, G. J., Dale, D. A., Malhotra, S., Rubio, M., Rubin, R. H., & Lord, S. D. 2002, AJ, 124, 751
- Crawford et al. (1985) Crawford, M. K., Genzel, R., Townes, C. H., & Watson, D. M. 1985, ApJ, 291, 755
- Devereux et al. (1994) Devereux, N. A., Price, R., Wells, L. A., & Duric, N. 1994, AJ, 108, 1667
- Fixsen et al. (1999) Fixsen, D. J., Bennett, C. L., & Mather, J. C. 1999, ApJ, 526, 207
- Gry et al. (2003) Gry, C., Swinyard, B., Harwood, A., Trams, N., Leeks, S., Lim, T., Sidher, S., Lloyd, C., Pezzuto, S., Molinari, S., Lorente, R., Caux, E., Polehampton, E., Chan, J., Hutchinson, G., Mueller, T., Burgdorf, M., & Grundy, T., eds. 2003, The ISO Handbook, Volume III - LWS - The Long Wavelength Spectrometer
- Haas et al. (1998) Haas, M., Lemke, D., Stickel, M., Hippelein, H., Kunkel, M., Herbstmeier, U., & Mattila, K. 1998, A&A, 338, L33
- Habing (1968) Habing, H. J. 1968, Bull. Astron. Inst. Netherlands, 19, 421
- Heiles (1994) Heiles, C. 1994, ApJ, 436, 720
- Kaufman et al. (1999) Kaufman, M. J., Wolfire, M. G., Hollenbach, D. J., & Luhman, M. L. 1999, ApJ, 527, 795
- Kramer et al. (2005) Kramer, C., Mookerjea, B., Bayet, E., Garcia-Burillo, S., Gerin, M., Israel, F. P., Stutzki, J., & Wouterloot, J. G. A. 2005, A&A, 441, 961
- Madden et al. (1993) Madden, S. C., Geis, N., Genzel, R., Herrmann, F., Jackson, J., Poglitsch, A., Stacey, G. J., & Townes, C. H. 1993, ApJ, 407, 579
- Malhotra et al. (2001) Malhotra, S., Kaufman, M. J., Hollenbach, D., Helou, G., Rubin, R. H., Brauher, J., Dale, D., Lu, N. Y., Lord, S., Stacey, G., Contursi, A., Hunter, D. A., & Dinerstein, H. 2001, ApJ, 561, 766
- Mochizuki (2000) Mochizuki, K. 2000, A&A, 363, 1123
- Mochizuki et al. (1994) Mochizuki, K., Nakagawa, T., Doi, Y., Yui, Y. Y., Okuda, H., Shibai, H., Yui, M., Nishimura, T., & Low, F. J. 1994, ApJL, 430, L37
- Nakagawa et al. (1995) Nakagawa, T., Doi, Y., Yui, Y. Y., Okuda, H., Mochizuki, K., Shibai, H., Nishimura, T., & Low, F. J. 1995, ApJ, 455, L35+
- Nakagawa et al. (1998) Nakagawa, T., Yui, Y. Y., Doi, Y., Okuda, H., Shibai, H., Mochizuki, K., Nishimura, T., & Low, F. J. 1998, ApJS, 115, 259
- Nieten et al. (2005) Nieten, C., Neininger, N., Guélin, M., Ungerechts, H., Lucas, R., Berkhuijsen, E. M., Beck, R., & Wielebinski, R. 2005, ArXiv Astrophysics e-prints
- Nikola et al. (2001) Nikola, T., Geis, N., Herrmann, F., Madden, S. C., Poglitsch, A., Stacey, G. J., & Townes, C. H. 2001, ApJ, 561, 203
- Rodríguez-Fernández et al. (2004) Rodríguez-Fernández, N. J., Martín-Pintado, J., Fuente, A., & Wilson, T. L. 2004, A&A, 427, 217
- Sodroski et al. (1997) Sodroski, T. J., Odegard, N., Arendt, R. G., Dwek, E., Weiland, J. L., Hauser, M. G., & Kelsall, T. 1997, ApJ, 480, 173+
- Stacey et al. (1991) Stacey, G. J., Geis, N., Genzel, R., Lugten, J. B., Poglitsch, A., Sternberg, A., & Townes, C. H. 1991, ApJ, 373, 423
- Sternberg & Dalgarno (1989) Sternberg, A. & Dalgarno, A. 1989, ApJ, 338, 197
- Tielens & Hollenbach (1985) Tielens, A. G. G. M. & Hollenbach, D. 1985, ApJ, 291, 722
- Wolfire et al. (1995) Wolfire, M. G., Hollenbach, D., McKee, C. F., Tielens, A. G. G. M., & Bakes, E. L. O. 1995, ApJ, 443, 152