[2]\textup#1 \mdseries\textsc#2
The Planetary Nebula population of the Sagittarius Dwarf Spheroidal Galaxy
Abstract
The identification of two new Planetary Nebulae in the Sagittarius Dwarf Spheroidal Galaxy (Sgr) is presented. This brings the total number to four. Both new PNe were previously classified as Galactic objects. The first, StWr 2-21, belongs to the main body of Sgr, from its velocity and location. The second, the halo PN BoBn 1, has a location, distance and velocity in agreement with the leading tidal tail of Sgr. We estimate that 10 per cent of the Galactic halo consists of Sgr debris. The specific frequency of PNe indicates a total luminosity of Sgr, including its tidal tails, of . StWr 2-21 shows a high abundance of [O/H] , which confirms the high-metallicity population in Sgr uncovered by Bonaficio et al. (2004). The steep metallicity–age gradient in Sgr is due to ISM removal during the Galactic plane passages, ISM reformation due to stellar mass loss, and possibly accretion of metal-enriched gas from our Galaxy. The ISM re-formation rate of Sgr, from stellar mass loss, is , amounting to per orbital period.
HST images of three of the PNe reveal well-developed bipolar morphologies, and provide clear detections of the central stars. All three stars with deep spectra show WR-lines, suggesting that the progenitor mass and metallicity determines whether a PN central star develops a WR spectrum. One Sgr PN belongs to the class of IR-[WC] stars. Expansion velocities are determined for three nebulae. Comparison with hydrodynamical models indicates an initial density profile of . This is evidence for increasing mass-loss rates on the AGB. Peak mass-loss rates are indicated of .
The IR-[WC] PN, He 2-436, provides the sole direct detection of dust in a dwarf spheroidal galaxy, to date.
keywords:
Galaxies: individual: Sagittarius dwarf spheroidal; Planetary nebulae: extra-galactic; Stars: mass loss’ Stars: Abundances1 Introduction
Planetary Nebulae (PNe) in Local Group dwarf galaxies provide valuable indicators of the star formation history. They are especially important for the age-metallicity relation, since they allow us to break the age–metallicity degeneracy inherent in colour-magnitude diagrams. Their abundances can provide stellar nucleosynthesis information for metallicities often very different from local, Galactic PNe. They are also important for studying PN evolution itself. Knowing the age and metallicity of the stellar population also allows one to study the formation and evolution of the PNe as function of these properties. In particular, PNe form during the catastrophic mass loss which terminates the Asymptotic Giant Branch (AGB) evolution. The dependence of the mass loss on metallicity is not understood (Zijlstra, 2004; van Loon, 2000; van Loon et al., 2005), and PNe in systems with well-determined stellar populations are crucial for studying this important problem.
The Sagittarius dwarf galaxy (Sgr) is our nearest surviving neighbour, at a distance of 25 kpc, less than half that of the Large Magellanic Cloud. Its location behind the Galactic Bulge contributed to its late discovery (Ibata et al., 1994). The present mass and luminosity are low, within the range of dwarf spheroidals. The abundances range from SMC-like to LMC-like for different star-formation epochs (e.g. Layden & Sarajedini, 2000; Alard, 2001). Sgr is strongly disrupted by its interaction with the Milky Way (Putman et al., 2004; Helmi & White, 2001; Dohm-Palmer et al., 2001), and was initially a substantial galaxy, in accordance with its relatively high metalicity. Some distant carbon stars in the Galactic halo may derive from the tidal streams of Sgr (Mauron et al., 2005). This has also been suggested for distant halo globular clusters (Bellazzini et al., 2003). What fraction of the Galactic halo was strippped from Sgr is not known.
Zijlstra & Walsh (1996) discovered that two previously catalogued (Galactic) planetary nebulae were located in the Sagittarius dwarf galaxy on the basis of their location and radial velocities. They are thus the closest extra-galactic PN. A detailed analysis based on ground-based spectra and radio continuum data (Dudziak et al., 2000) showed that the two nebulae have the same stellar progenitor mass of 1.2M⊙ and almost identical progenitor light element abundances. One of the nebulae, Wray 16-423, underwent PN ejection about 1500 yr previous to its twin He 2-436. A differential abundance analysis revealed the first conclusive evidence for third-dredge-up oxygen enrichment (Péquignot et al., 2000). That the two PN have such closely matching ages and abundances of non-dredged-up elements, pointed very strongly to their belonging to the same, short-lived star-formation episode.
In this paper we present a new member of the Sgr PN population, arising from a recent, higher-metallicity star-formation epoch. One further Galactic halo PN is also found to be a Sgr member, located in the leading tidal arm. This object traces an older, much lower metallicity population.
Section 2 discusses the PNe membership of Sgr. In Section 3 we present new HST images for three PNe, and deep spectroscopy of the new high-metallicity PN. Kinematical models are discussed in Section 5. The central stars and the nebular morphologies are discussed in Section 6. Abundances and implications for the evolution of the Sagittarius dwarf galaxy are discussed in Section 7.
2 Membership
| PN | l | b | RA | DEC | (star) | ) | diameter | star | |
|---|---|---|---|---|---|---|---|---|---|
| (J2000) | (km s-1) | (mag) | (erg cm-2 s-1) | (arcsec) | |||||
| He 2-436 | 4.8 | 22.7 | 19 32 06.70 | 34 12 57.4 | +133 | 11.74 | 0.6 | [WO 4]/[WC 4] | |
| StWr 2-21 | 5.2 | 18.6 | 19 14 23.35 | 32 34 16.6 | +129 | 12.26 | 2.7 | [WO 2] | |
| Wray 16-423 | 6.8 | 19.8 | 19 22 10.63 | 31 30 38.7 | +133 | 11.55 | 1.45 | [WC 4]/wels | |
| BoBn 1 | 108.4 | 76.1 | 00 37 16.03 | 13 42 58.5 | +174 | 12.425 | 2 | ||
2.1 A Sgr-core member: StWr 2-21
The main body of Sgr lies behind the Bulge, at a Galactic latitude of minus 15–20 degrees. The distance is between kpc (Alard, 1996) and kpc (Monaco et al., 2004). Confusion with the Bulge foreground population is important, but there are in fact relatively few Bulge PN more than 15 degrees from the Galactic Centre. The two known members, Wray 16-243 and He 2-436, were identified as located in the main body of Sgr based on their identical radial velocities (Zijlstra & Walsh, 1996). Another object located in the same region (Hb 8) was shown to have a very different velocity and was classified as a foreground object. Further PNe in Sgr, wrongly classified as Galactic Bulge PN, are a distinct possibility: many Bulge PNe have no known velocity, and there are suggestions that the Sagittarius galaxy could have had a total mass 109M⊙ (Jiang & Binney, 2000). We therefore conducted a search through the literature for catalogued PN in the direction of the Sagittarius galaxy, and to test for a radial velocity compatible with Sgr membership.
A little studied PN, StWr 2-21 (PN G005.218.6), was identified situated within 2∘ of Wray 16-423. Its velocity was measured using a newly obtained WHT spectrum (see Section 4.1). The mean measured heliocentric radial velocity of the H and [O III] 4959,5007Å lines was 1291 kms-1 (error on mean). This agrees to within 5 km s-1 with the other two Sgr PNe, leaving little doubt about the association with Sgr.
All three identified members are located within the southern extension of Sgr, in the same area where its globular clusters are found. There is no PN candidate in the core region of Sgr centred on M54 (centre , core radius 234 arcmin: Majewski et al., 2003). The only catalogued PN in this region, He 2-418, has an acceptable velocity of +115 km s-1 but a diameter of 14 arcsec (Ruffle et al., 2004) which is too large for a bright PN at the distance of Sgr. Assuming that this region has been surveyed to uniform depth, the lack of bright PNe towards the assumed bound core region of Sgr is noticable. There is no evidence of high extinction in this direction.
Walsh et al. (1997) suggested that PRMG 1 (PN G006.041.9) was a possible Sagittarius PN. Its abundance is similar to those of the two Sagittarius PNe (Dudziak et al., 2000). We can now rule out this proposed association. Observations with the NTT EMMI spectrometer of this 4-arcsec nebula showed that its heliocentric velocity is 202 kms-1 (LSR velocity 24kms-1). The Sagittarius stream 20 degrees from the main body is thought to have a velocity close to 100 km s-1 (Ibata et al., 2001) which does not favour membership. (Helmi & White (2001) predict velocities at this position closer to 50 km s-1.) Recent mappings show that the tidal plane of Sgr does not pass through this position (Majewski et al., 2003). We conclude that PRMG 1 is a foreground object.
2.2 A possible leading-tail member: BoBn 1
We also searched along the plane of the tidal tails (Majewski et al., 2003; Newberg et al., 2003). This identified BoBn 1, a well-studied halo PN, as a candidate. Its heliocentric velocity of +174 km s-1 (Wright et al., 2005) is opposite to the trailing tail at this location (Majewski et al., 2004). However, the positional agreement is sufficiently close (and halo PNe are sufficiently rare) that the question may be asked whether BoBn 1 could be part of a separate tail.
A dynamical simulation by Law et al. (2005) shows the various streams of debris, separated into trailing and leading tails, and associated with different tidal dislocations events. The streams are always located in the same orbital plane but are moving in different directions and are at different distances. BoBn 1 is located in a direction where the leading and trailing streams cross. At this location the leading stream is moving outwards, along the line of sight. The particular velocity is model dependent, but the velocity of BoBn 1 is within the range of the predictions. The heliocentric distance to the leading stream at this location is around 20 kpc. The distance to BoBn 1 is quoted as 22.5 kpc (Hawley & Miller, 1978) and 16.5 kpc (Henry et al., 2004). (Distances to PNe are difficult to ascertain, and the quoted distance is uncertain by at least 30 per cent.) The agreement in position, velocity and distance makes an association of BoBn 1 and the Sgr leading tail a likely one.
The leading tail is observationally not as well constrained as the trailing tail (Law et al., 2005). The identification of further stars in the Sgr leading tail will be needed to remove the model dependence in the proposed association.The accurate velocity of BoBn 1 may also be useful in constraining the Sgr tidal models.
No other catalogued PNe were identified as potential members. Other newly discovered PNe in the Sgr core region (Parker et al., 2003) are extended and faint and certainly not Sgr members. The list of possible PNe in the ESO-Strasbourg catalogue of Planetary Nebulae (Acker et al., 1992) contains three further objects of interest (K 2-4, Y-C 43, ESO 340-34), but all are nebulae of large radius. They are possibly misclassified galaxies.
The four identified Sgr PNe are listed in Table 1.
3 HST imaging
We obtained SNAPshot WFPC2 images in three different filters of the three PNe in the main body of Sgr. We used a sequence of two cosmic-ray-split H exposures, one V-band exposure and two [O iii] exposures. For He2-436 and Wray 16-423, exposures times are 100 seconds for each H exposure, 60 sec for the V-band and 80 seconds for each [O iii] exposure. The faintest object, StWr 2-21, was observed for 2 times 140 sec in H and [O iii]. The objects were placed on the CCD of the Planetary Camera (PC). The pixel scale is . Pipe-line reduced images were retrieved.
The calibration of the three filters used (F502N, F547M, F656N) is described in O’Dell & Doi (1999). The filter response is taken from the WFPC2 handbook. The F656N filter is centred on H wth a peak transmission above 70%. It has a response at the [N ii] 6548Å line and a few per cent at the 6584Å[N ii] line. The He i line at 6560Å can also contribute but this line is weak in all cases. The F502N filter has a 60% transmission at the [O iii] line without significant pollution from other lines. The F547M is used as the continuum filter, and is best suited to detect the central star, and other possible confusing stars–it is little affected by strong emission lines. Nebular bound-free continuum dominates the nebular flux in this filter.
Photometric calibration was done with the calibration constants (PHOTFLAM and the Vega-based zeropoint) listed in the WFPC2 handbook. The central stars of all three nebulae are detected in the F547M images. The H image was scaled and subtracted from the F547 image, to remove the nebular continuum. The stellar magnitudes, converted to Johnson V, are listed in Table 1. They were measured in a circular apertures of 7-11 pixels radius, using aperture corrections shown in the WFPC2 handbook for the V-band filter and the PC. The accuracy is 0.1–0.2 mag, limited by the faintness of the stars. In addition to the magnitudes, Table 1 also lists the line fluxes measured from the images.
Fig. 1 shows the resulting images. Here the images were rotated to the same orientation, while rebinning to keep the same square pixel size. All images are shown to the same spatial scale. The images reveal bipolar structures in all three PNe. The large difference in size is clear. The peak intensity drops by a factor of roughly 100 between He 2-436 and StWr 2-21 (in the depicted images the fluxes have been scaled to the same peak for the [O III] images). He 2-436 is very compact. The inner radius is only just resolved, as shown by the two peaks separated by a single pixel. It is significantly elongated. Wray 16-423 shows a complicated morphology, with an inner bipolar structure surrounded by a second, fainter structure rotated at an angle relative to the inner countours. The outer contours show elongation. Finally, StWr 2-21 is the largest nebula, and shows an elliptical outer structure and a bipolar inner structure. There is some evidence for a wind-blown bubble towards the East which in [O iii] appears as a closed outer shell. As for Wray 16-423, a rotation between the inner and outer structures is apparent.
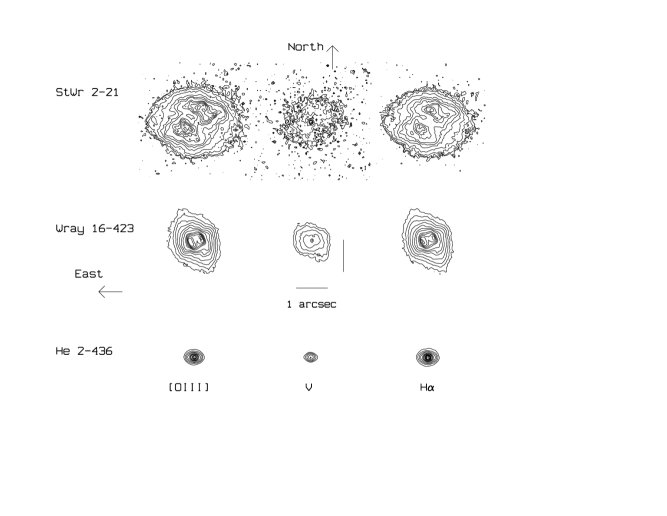

Fig. 2 shows radial intensity profiles along the minor axis and along the major axis (90 degrees rotated). These were obtained by rotating (and rebinning to the original square pixel size) to align the major axis with the image axes, and averaging three adjacent rows or columns through the geometric centroid of the source. The V-band profiles show the central star, although in the case of He2-436 only marginally.
| Rest | Identification | Obs. flux | error | Obs. flux |
|---|---|---|---|---|
| (Å) | (EFOSC2) | (ISIS) | ||
| 3425 | [Ne V] | 1.73 | 0.23 | |
| 3440 | O III | 10.16 | 0.19 | |
| 3705 | H I | 0.59 | 0.08 | |
| 3726 | [O II] | 34.36 | 0.16 | |
| 3753 | O III | 3.90 | 0.07 | |
| 3769 | H I | 3.31 | 0.09 | |
| 3796 | H I | 4.70 | 0.07 | |
| 3814 | He II | 1.51 | 0.06 | |
| 3835 | H I | 6.67 | 0.09 | |
| 3869 | [Ne III] | 70.97 | 0.20 | |
| 3889 | H I +He I | 16.69 | 0.11 | |
| 3922 | He II | 0.40 | 0.11 | |
| 3969 | H I + [Ne III] | 35.89 | 0.15 | |
| 4026 | He I | 2.05 | 0.14 | |
| 4070 | [S II] (blend) | 1.99 | 0.08 | |
| 4101 | H | 24.60 | 0.11 | |
| 4188 | C III | 0.27 | 0.05 | |
| 4200 | He II | 0.61 | 0.04 | |
| 4267 | C II | 0.78 | 0.08 | |
| 4340 | H | 43.710 | 0.11 | |
| 4363 | [O III] | 10.32 | 0.07 | |
| 4387 | He I | 0.39 | 0.10 | |
| 4471 | He I | 3.40 | 0.07 | |
| 4543 | He II | 1.22 | 0.07 | |
| 4648 | C III | 2.75 | 0.57 | |
| 4685.7 | He II | 41.86 | 0.11 | 38.1 |
| 4711.4 | [Ar IV] + He I | 4.05 | 0.06 | 4.0 |
| 4740.2 | [Ar IV] | 3.15 | 0.07 | 3.3 |
| 4861.3 | H | 100.00 | 0.00 | 100.0 |
| 4923 | He I | 1.23 | 0.06 | |
| 4958.9 | [O III] | 355.65 | 0.51 | 359.4 |
| 5006.8 | [O III] | 1062.02 | 189.91 | 1047.2 |
| 5412 | He II | 3.69 | 0.04 | |
| 5518 | [Cl III] | 0.50 | 0.04 | |
| 5539 | [Cl III] | 0.46 | 0.04 | |
| 5755 | [N II] | 0.30 | 0.11 | |
| 5805 | C IV | 0.90 | 0.11 | |
| 5876 | He I | 11.04 | 0.13 | |
| 6300 | [O I] | 1.37 | 0.07 | |
| 6312 | [S III] | 2.12 | 0.04 | |
| 6363 | [O I] | 0.46 | 0.06 | |
| 6408 | He II | 0.19 | 0.04 | |
| 6548 | [N II] | 2.01 | 0.06 | |
| 6563 | H | 279.07 | 49.76 | |
| 6584 | [N II] | 11.53 | 0.07 | |
| 6678 | He I | 2.65 | 0.04 | |
| 6716 | [S II] | 2.00 | 0.04 | |
| 6731 | [S II] | 2.97 | 0.04 | |
| 6891 | He II | 0.35 | 0.04 | |
| 7065 | He I | 2.33 | 0.07 | |
| 7136 | [Ar III] | 9.36 | 0.07 | |
| 7175 | He I | 0.57 | 0.06 | |
| 7211 | 2.98 | 0.09 | ||
| 7322 | [O II] | 2.26 | 0.08 | |
| 7362 | 0.43 | 0.07 |
-
Observed H flux = 1.29 0.01 10-13 (EFOSC2) and 1.06 10-13 (ISIS) ergs cm-2 s-1
4 Spectroscopic observations
4.1 Low resolution spectroscopy of StWr 2-21
We observed StWr 2-21 with the ISIS spectrometer on the 4.2m WHT La Palma telescope on 1999 July 19. The holographic H2400B grating was used, and the EEV12 CCD detector with a pixel scale of 0.11Å and a coverage of 445Å. A slit width of 1.5 arcsec was employed giving a line width of 5 pixels and a resulting spectral resolution of 0.53Å. A single exposure of 900s was obtained with the slit at a parallactic angle; the seeing was measured at about 2 arcsec. The spectrum was centred at 4800Å allowing the He II 4686Å, H and the [O iii]4959,5007Å lines to be studied. A Cu-Ar arc lamp exposure was employed for wavelength calibration and a 5th-order fit to the line positions was employed (r.m.s. on the fit 0.01Å). An exposure of the spectrophotometric standard star BD+33∘2642 (Oke, 1990) was made with a broad (5.0 arcsec) slit and used to establish the absolute flux calibration for the StWr 2-21 spectrum.
A deep, low-resolution spectrum with larger wavelength coverage was obtained with EFOSC2 on the ESO 3.6m telescope (Patat, 1990). An acquisition image was obtained with an [O III] filter (centre 5004Å, width 56Å; ESO Filter #689) and spectra at a parallactic angle with a 1.2 arcsec slit were obtained over the wavelength ranges 3050-6100 (grism #03) and 4090-7520Å (grism #04). The seeing was 1.6 arcsec measured from the acquisition image. The exposure time was 1800s, split into two sub-exposures; separate 300s exposures were also obtained to provide all strong lines unsaturated. The measured spectral resolution was 11Å for the bluer spectrum and 12Å for the redder spectrum. Broad-slit observations of the standard star EG274 (Oke, 1990) were obtained with both gratings for flux calibration.
The spectral images were bias-subtracted and flat-fielded by exposures to a continuum lamp illuminating the inside of the dome. Wavelength calibration was applied using the exposures to a Cu-Ar arc lamp fit by a third order polynomial. The spectrum of the PN was extracted over the extent of the emission, sky subtracted and flux calibration applied from the spectra of EG274. Table 2 presents the observed line fluxes determined by interactively fitting Gaussians to the lines for the longer exposures, with substitution of the fluxes for the saturated lines from the shorter exposures ([O III] doublet and H). Errors on the line fluxes, from propagation of the photon counts on the lines and the error in fitting the underlying continuum, are also listed in the Table.
The extinction is zero within the errors, as derived from the hydrogen line ratios. For comparison, the extinction towards Wray 16-423 is (Walsh et al., 1997), consistent with the forground extinction towards Sgr. He 2-436 has higher extinction due to dust within the nebula.
4.2 Echelle observations
He 2-436 and StWr 2-21 were observed with the ESO NTT telescope during June 2001, as part of a larger survey of PNe towards the Galactic Bulge (Gesicki et al., 2006). The echelle spectra were obtained using the red arm of the combined imager/spectrograph EMMI. Echelle grating 14 was used with cross disperser 3. The wavelength coverage is approximately 4300–8100Å. The slit width was 1″, providing a resolution of 60 000. The slit length is limited to 3 arcsec by the need to avoid order overlap. The seeing (worse than 1 arcsec) did not allow us to use the spatial resolution inherent in the data, and we summed the spectrum over the slit length.
Wavelength calibration was done using a ThAr lamp. The data was flat-fielded and corrected for the response function using a standard star. No absolute flux calibration was attempted. The exposure time of 120 sec aimed at obtaining good line profiles for the strongest lines in the spectrum only. Line profiles used to obtain velocity fields were determined for four lines. For Wray 16-423, similar but much deeper observations were published in Gesicki & Zijlstra (2003). The data reduction used here is as described in that paper.
The line ratios from these data are listed in Table 2. In the following sections we describe models based on these new data. These are combined with existing models for the previously known Sgr PNe. No new data was obtained for BoBn 1, and this object is not included.
5 Expansion velocities
5.1 Description of the models
The internal kinematics of PNe are dominated by expansion. The expansion velocity together with the physical size of the nebula gives a measure of the elapsed time since the ejection of the nebula, the dynamical age. This can be compared to the thermal age, defined by the temperature of the central star and its rate of temperature increase. The latter is a sensitive function of the mass of the central star. The dynamical age together with the stellar temperature can therefore be used to derive the stellar mass.
The internal kinematics are dominated by the expansion of the nebulae. Hydrodyamical models (e.g. Schönberner et al., 2005) predict that the expansion velocity is not uniform, but that different layers (at different radii) expand at different rates. The echelle spectra clearly show the broadened lines due to the expansion, but determination of the internal velocity field is needed to define an overal expansion velocity. The mass-weighted expansion velocity (Gesicki & Zijlstra, 2000) is used for calculating a dynamical age.


We will follow the usual procedure, as outlined in Gesicki & Zijlstra (2003). Here we first use a photoionization model to determine where within the nebula a certain line originates, and use the measured line profiles to fit a velocity field as function of radius. The model assumes a spherical symmetric nebula. The models we use (the Torun models) do not currently implement asymmetric nebulae, and neither do we have sufficient observational constraints to fit such models. (For instance, asymmetric velocity models require knowledge of the angle between the polar axis and the plane of the sky, which would require spatially resolved echelle spectra. Our spectra lack spatial information.) The Torun models also approximate the star with a black body. However, the resulting expansion velocity is found to be relatively robust to these assumptions.
The computer model first solves for the photo-ionization equilibrium, where we attempt to reproduce the observed line intensities and the observed radial surface brightness distribution. (This photo-ionization model is by necessity different from that used in section 6, and is not suitable for abundance determinations.) We compare the models with both major and minor axis cross sections of the nebulae, but do not attempt to fit these individually. The line profiles are calculated, taking into account the slit aperture (which may not cover the full nebula) and the seeing (which scatters light rays from outside the aperture into the slit). The velocity field is adjusted to fit the line profiles of all lines simultaneously. In the present analysis the computer codes are adapted to work with an optimization routine. We applied the publicly available “PIKAIA” computer code which is based on a genetic algorithm (Gesicki et al., 2006). The line profiles include thermal broadening, organized (expansion) velocities, and turbulence. However, for the modelled Sgr PNe we did not find evidence for a turbulent component.
5.2 Kinematical models for three PNe
5.2.1 He 2-436
The spectra are spatially unresolved, as shown by the fact that the lines are unsplit (Fig. 3). Four lines are suitable for the velocity analysis; the weakest of these ([\textS iii] 6312Å) was filtered to smooth the noise. The lines are approximately of Gaussian shape, with [\textO iii] and [\textS iii] slightly narrower than the other two.
In accordance with the HST images we build an appropriate photoionization model assuming the density distribution is concentrated towards the inner radius. The chemical composition and line ratios have been adopted from Dudziak et al. (2000) and Walsh et al. (1997). A parabola-like expansion velocity resulted in acceptable fit to the observed line profiles.
The adopted solution is shown in Fig. 3. Panels on the left present the model structure. Shown are: the assumed radial hydrogen density distribution together with the computed electron density and temperature; the derived velocity distribution; and the radial distributions of emissivities for lines shown in right panels, normalized to unity. The other panels compare models with observations. In the middle the observed HST surface brightness profiles from Fig. 2 are compared to the computed ones. The observations (dots and dashes) are rescaled to the normalized model profiles (draw line). The panels on the right compare the computed (solid lines) with the observed (circles) emission line profiles.
5.2.2 StWr 2-21
The 2-arcsec nebula is expected to be partially spatially resolved by the spectrograph slit. Only four emission lines are strong enough to be considered in our analysis. The \textHe ii and H lines are unsplit, [\textO iii] shows a partial split, and [\textN ii] is split more clearly but is also more asymmetric. For the model fitting we used only the stronger (blue) peaks from the asymmetric couple.
The best-fit model that reproduces both the H flux and the line ratios of Table 2 is a density-bounded one. Such a model reproduces the very similar size of the images in the two different filters (Fig. 1), because in this case the ionization stratification is very weak and the emissivity distribution of [\textO iii] and H follows the same density distribution. (The computed emisivities show for \textHe ii and [\textN ii] a clear stratification, but no images are available to test this.) To reproduce the small size of the central cavity, we needed to apply a density distribution concentrated towards the centre with inner radius close to the central star.
The linearly increasing velocity field reproduces relatively well the four observed emission lines.

5.2.3 Wray 16-423
An analysis of the velocity field of the nebula Wray 16-423 was published in Gesicki & Zijlstra (2003). The high quality spectrum allowed for extraction of nine emission lines which strongly constrained the deduced velocity field. The result indicated a high velocity spike located inside the nebula and also suggested a presence of a low density extended outer region.
The previous modeling was done without the benefit of a high-resolution image. We redid the modeling, searching for a density distribution that reproduces as well as possible the new HST images. The obtained density field is similar to that from Gesicki & Zijlstra (2003), but the maximum is placed somewhat further from the centre and the outer density is higher.
With the improved density structure we returned to the old spectra. The genetic algorithm found a velocity field similar to that from Gesicki & Zijlstra (2003) with a high velocity region inside the nebula. The fit considered eight of the nine lines shown in Gesicki & Zijlstra (2003) (excluding the most noisy one) but in Fig. 5 we present only the most representative four lines. The velocity profile is more complicated than found for the other two PNe, but this is partly caused by the fact that more lines are available and that therefore the velocities as function of emissivities are better constrained. This allowed us to search for a higher-order solution. The low-order behaviour is similar to the other objects.
5.2.4 Results
Table 3 presents the summary of the parameters of Torun models for the three PNe. The important parameter are the mass-weighted expansion velocity, , the dynamical age, and the core mass for which the dynamical and stellar time scales are equal.
| He 2-436 | Wray 16-423 | StWr 2-21 | |
| log F(H) | 11.4 | 11.89 | 12.6 |
| [O/H] | 0.52 | 0.51 | 0.35 |
| 58100 | 82000 | 146000 | |
| 4.76 | 4.92 | 5.16 | |
| 3.89 | 3.6 | 2.95 | |
| model [pc] | 0.03 | 0.095 | 0.16 |
| model [pc] | 0.001 | 0.008 | 0.02 |
| model | 0.084 | 0.40 | 0.25 |
| outer boundary | ioniz | ioniz | density |
| angular diam [arcsec] | 0.5 | 1.6 | 2.6 |
| [km/s] | 19 | 32 | 32 |
| turbulence [km/s] | 0 | 0 | 0 |
| dyn. age [yr] | 1650 | 3100 | 5200 |
| dyn. core mass | 0.62 | 0.61 | 0.61 |
As expected, there is an age progression with He 2-436 being the youngest and StWr 2-21 the oldest nebula. The difference is smaller than the size would imply, as He 2-436 has a small expansion velocity. The derived velocities are within the usual range for Galactic objects (Gesicki & Zijlstra, 2000). Available data suggests that the metallicity has little effect on the PN expansion (Gesicki & Zijlstra, 2003). This is in contrast to AGB outflow velocities which are strongly dependent on metallicity (Marshall et al., 2004). The reason is that the PN expansion is largely dominated by the overpressure within the ionized region, and has accelerated significantly during the post-AGB phase. The kinematic models show that all three stars have comparable core (final) masses. There is a systematic uncertainty, in that some assumptions are made on how the nebula accelerates, and that the radius used for the dynamical age is taken as 0.8 of the outer (model) radius. (The latter because this is approximately the mass-weighted radius.)
All three nebulae show an asymmetry in the line profiles with the blue component stronger. The difference is very minor in He 2-436, larger in Wray 16-423 and strongest in StWr 2-21. In all cases do the ionization levels tracing the outer-most regions (such as [O i] and [N ii]) show the largest effect. The effect of the asymmetry on the line modelling is discussed in Gesicki & Zijlstra (2003): the velocity structures are more regular than the density and/or temperature profile, as shown by the line profiles. The cause for the blue asymmetry is not known, but one can speculate about a relation to the movement of the nebulae through the gas in the Galactic halo.
6 Discussion: Stars and nebulae
6.1 Photo-ionization modelling
Emission lines are sensitive to the local conditions in the nebulae: density, temperature, radiation field, and elemental abundances. This sensitivity allows for accurate models, with improving accuracy when more lines are available. Deep spectroscopic observations of Wray 16-423 and He 2-436 have previously been used to obtain photo-ionization models of both nebulae (Dudziak et al., 2000). Neither object could be well described by a set of unique conditions, but each required two sectors with different covering factors and conditions. Their model parameters are listed in Table 4. The models have filling factor unity and assume constant pressure within each zone. Table 4 also lists the radii and thickness derived from the HST images. The models were derived before the HST images became available: the values predicted by the models are largely confirmed by the new images presented above. The structures observed by HST confirm the need for at least two-zone models. The complexity in the images exceeds what can be reproduced in the models, but the large-scale geometry confirms the predictive capability of the models of Dudziak et al. (2000).
Photoionization modelling of StWr 2-21, again using NEBU, is discussed in detail in Péquignot et al. (2006, hereafter Paper II). Models are based on the fluxes listed in Table 2, but with minor revisions suggested by a spectrum synthesis. The synthesis was used to investigate the contribution of weak, not individually detected, lines on the spectrum. It also allowed us to resolve blends, important at the moderate resolution of the observations, and to detect Wolf-Rayet features (see Section 6.3).
As for the two objects modelled by Dudziak et al. (2000), at least two sectors are necessary to reproduce the observed line flux ratios. With the constraint of the nebular size derived from the HST images, the two-sector models for StWr 2-21 turn out to have a combined covering factor much less than unity. A low-density gas with no specific signature in the spectrum may fill in most of the ’empty’ sector, as confirmed by trial calculations. Given that the overwelmingly dominant sector is strongly matter-bounded, the existence of such a component is not too surprising. Although it may not emit much of the line flux, this sector may encompass a very significant fraction of the ionized mass, which is therefore only a lower limit in the two-sector model.
The question of the uniqueness of the solution is discussed in Paper II. It is difficult to obtain unique models in the case of StWr 2-21. The carbon abundance, which controls the energy output of the nebula and therefore the effective temperature of the central star, is poorly constrained for lack of UV spectra. Most optical recombination lines of carbon have mildly accurate fluxes. Moreover, following a suggestion made for other PNe, these recombination lines may partly trace cool H-poor clumps embedded in the nebula (e.g. Liu et al., 2004; Péquignot et al., 2003). The NEBU model selected in Table 4 is therefore typical but not unique. Nonetheless, the oxygen abundance is relatively well defined. Abundances derived from this model are provided in Table 6 and discussed in Section 6.7.
| He 2-436 | Wray 16-423 | StWr 2-21 | BoBn 1 | (units) | |||||
| K | |||||||||
| L⊙ | |||||||||
| M⊙ | |||||||||
| (HST, observed) | : | – | pc | ||||||
| (HST, observed) | (0.1) | pc | |||||||
| Model sectors | I | II | I | II | I | II | I | II | |
| Ionization/density bounded | ionization | ionization | ionization | density | ionization | density | ionization | density | |
| cm-3 | |||||||||
| (model) | pc | ||||||||
| (model) | pc | ||||||||
| Covering factor | 0.62 | 0.38 | 0.17 | 0.83 | 0.0074 | 0.372 | 0.028 | 0.437 | |
| (13.6 eV) | – | – | – | 6.7 | – | 1.2 | – | 3.1 | |
| Mass fraction | 0.100 | 0.900 | 0.108 | 0.892 | 0.092 | 0.907 | 0.115 | 0.885 | |
We used a Cloudy model as an independent check on the NEBU results. We used version 05.10.06 of Cloudy, last described by Ferland et al. (1998) and modified to include additional stellar atmospheres as described below. The two codes are independent, and use different assumptions regarding the nebular structures. A different stellar atmosphere model was used: whereas in the NEBU code a Clegg & Middlemass (1987) model was adopted, in the Cloudy model we used a He/C (i.e. H-poor) model of Rauch (2003). Cloudy also allows the use of dust within the ionized region: we ran models both with and without dust. The dustless models were marginally better, but in view of the uncertainties in the modelling, it seems doubtful that this is significant. Cloudy confirmed the need for a two-component model to obtain a reasonable fit. In the Cloudy models the microscopic volume filling factor (Osterbrock, 1989) was treated as a free parameter. It converged to unity, tentatively indicating that the nebular material is homogeneous. But this required a much less luminous star than found in the NEBU model. Radii and density of the components are also somewhat different. The oxygen lines are poorly fitted in comparison to the NEBU results. Convergence to a full solution with Cloudy was not attempted. NEBU outputs are presented in Paper II.
6.2 The central stars: HR diagram
The absolute stellar magnitudes, dereddened and converted to Johnson V, are listed in Table 5, for an assumed distance of 25 kpc. The data are corrected for extinction, derived from the H/H ratio. A standard extinction curve with is assumed. B-band value are also given: these are from the long-slit spectroscopy of Walsh et al. (1997) and are of lower accuracy.
| PN | E(BV) | V | B |
|---|---|---|---|
| He 2-436 | 0.28 | : | |
| StWr 2-21 | 0 | ||
| Wray 16-423 | 0.14 | +1.7: |
Fig. 6 shows the location of the stars on the HR diagram, based on the photoionization models. The uncertainty on the distance is upto 10 per cent, leading to a systemic uncertainty in log of 0.1 dex, which is not included in the error bars. The depth of the Sgr main body has not been measured but is likely less than 1 kpc (Majewski et al., 2003).
The dashed lines in Fig. 6 show the models of Blöcker (1995b), labelled by their core mass. The speed of evolution is a strong function of core mass. The ’dynamical core mass’ in Table 3 gives the mass which is consistent with the dynamical age of the nebula. In all three cases, this mass is around 0.61–0.62 M⊙. (The systematic uncertainty in the distance of 10 percent, introduces a per cent error in the core mass, which is much less than the model uncertainties of : Gesicki & Zijlstra, 2000). The photoionization models yield a stellar luminosity which is a little lower than corresponds to these masses. However, the models may underestimate the stellar luminosity if there is little ionized gas in some directions.
The stellar magnitudes can also be used to derive observed locations in the HR diagram. We used the stellar atmosphere models of Clegg & Middlemass (1987) to calculate predicted V-band magnitudes as function of temperature and luminosity. The results are shown in Fig. 6: the squares show the luminosities of Clegg & Middlemass (1987) models at specific temperatures, fitted to the observed V-band magnitudes. The long-dashed lines connect the squares; the stars are expected to fall along these lines. (In fact, if the dynamical mass is assumed, the stars should be located on the corresponding intersection between the long-dashed and the solid lines.) For He 2-436, the bright stellar magnitude indicates a cooler star than given by the photoionization models. The most likely explanation is that for this H-poor [WC] star, the H+He models of Clegg & Middlemass (1987) overpredict the flux at ionizing wavelengths. For Wray 16-423 a similar but smaller effect is seen. The stellar magnitude of StWr 2-21 was used as a constraint in the NEBU model. The relatively bright star rules out the low luminosity of the Torun model, confirming that much of the stellar radiation escapes in directions with low density gas as required in the NEBU model. We note that the results do depend on the atmosphere model, e.g. using the more modern models of Rauch (2003) could yield different results. The composition of the stellar atmospheres, and the existence of a strong wind, introduce a significant additional uncertainty.

6.3 The central stars: WR lines
After subtracting all the nebular emission lines from the spectrum of StWr 2-21 by means of spectrum synthesis, two broad features at 3820Å and 5805Å were revealed. The resulting stellar spectrum is discussed in Paper II. The presence of broad O vi 3811+34Å and C iv 5801+12Å emission points to a very hot WR star of subclass [WO] (Acker & Neiner, 2003). The intensity ratio in the spectrum synthesis (see paper II) is O vi 3822/C iv 5805 . The uncertainties arise from the ill-defined ’half line width’ of the 3822 line (taken as 1300km/s compared to 750km/s for 5805), and the blending of the stellar 5805 line with (weaker) nebular 5805 emission. In a difficult blend, we find C iv 4658/C iv 58051–1.5, and there is an indication for O vi 5290/C iv 5805 (where both lines are assumed to have the same width). These line ratios indicate a [WO 2] star, perhaps midway between subclass 2 and 3, according to Acker & Neiner (2003).
The two PNe previously known also show WR lines (Walsh et al., 1997). We reclassified these stars using the scheme of Acker & Neiner (2003), and the data of Walsh et al. (1997) subject to the reanalysis of Dudziak et al. (2000). The adopted subclasses are listed in Table 1. The main constraint is the absence of some important lines, suggesting they are much weaker than C iv. For He 2-436, the He ii line points at a possible [WO 4] class. Wray 16-423 is more uncertain, but the detected lines are consistent with [WC 4]. The higher temperature of the star of Wray 16-423 is not reflected in its subclass. However, this is not unusual among WR nuclei, where the subclass also traces the strength of the stellar wind (Crowther, 1999). The narrow lines of Wray 16-423 could also be interpreted as indicative of a weak emission-line star (wels).
All three Sgr PN with deep spectra therefore show evidence for WR-type emission lines. Górny (2001) estimates that 6.5 per cent of Galactic PNe show [WR]-type central stars. A higher fraction is found in the Galactic Bulge (Górny et al., 2004), predominantly with late subtypes. To this should be added the weak emission-line stars (wels: Gesicki et al., 2006) which occur with roughly equal frequency as do WR-type central stars. To find all three studied Sgr objects to fit in this category, supports models where the fundamental parameters of the progenitor star (mass, metallicity) determine whether a star develops a WR wind. This is in contrast to models where the occurence is random, caused by the precise timing of the last thermal pulse (for a review see Blöcker, 2001). There is no evidence for WR-central stars to be more massive than non-emission-line stars (Pottasch, 1996), but Gesicki et al. (2006) find that Galactic [WC] stars show a narrower, intermediate range of core masses, compared to non-emission-line stars. The Sgr PNe fit within this mass range.
6.4 The IR-[WC] stars
Among Galactic [WC] stars, there is a subgroup with unusually strong IRAS emission. He 2-436 has similar characteristics: it is associated with an IRAS point source (Zijlstra et al., 1994), and scaling its 12-micron flux (0.22 Jy) to a typical distance of galactic PNe of 2.5 kpc would put it among the brightest such objects. The class of IR-[WC] stars is discussed by Zijlstra (2001).
The Galactic IR-[WC] stars have late subtypes, of 8–11 (Zijlstra, 2001) . He 2-436 shows a much earlier subtype. Three further extragalactic [WC] stars are detected by IRAS: SMP58 and SMP61 in the Large Magellanic Cloud and SMC N6 in the Small Magellanic Cloud (Zijlstra et al., 1994; Pena et al., 1997; Stasińska et al., 2004) (the last object has no 12-m detection). The two LMC objects have subclass [WC5-6], and SMP N6 has [WO 4] on the scale of Acker & Neiner (2003). The extragalactic stars have much earlier subclassses than comparable Galactic stars. The strong IRAS flux densities require a high dust optical depth, and indicate a dense, compact nebula. The cause of the differences between the stars in different galaxies is not clear.
6.5 Nebular structures
6.5.1 Bipolarity
The HST images show a very similar global morphology between the three imaged objects. All show a torus-like structure, with lower-density regions in the polar directions. In the classification of Greig (1971), all three objects are of class B, indicative of enhanced AGB mass loss in the equatorial plane. The images do not show the’butterfly’ morphology of the more extreme bipolar nebulae, suggesting the density contrast between equator and poles is not extreme (in the scheme of Balick & Frank (2002), the objects would be considered as intermediate between elliptical and bipolar). The fact that all three nebulae show similar structures is interesting in view of suggestions that the primary factor determining the nebular morphology is stellar progenitor mass (Corradi & Schwarz, 1995). Reviews on PNe morphologies can be found in Kwok (2000) and Balick & Frank (2002).
The outer structures of the two larger objects are more complicated; relatively bright and showing symmetry axes which are not well aligned with those of the inner torus. The outer regions are sensitive to the mass-loss evolution on the AGB (Monreal-Ibero et al., 2005) and interaction with the ISM (Wareing et al., 2006). There is an indication that the asymmetry in the outer stuctures is along the direction of motion of the galaxy (towards WNW): interaction with the tenuous medium in the Galactic halo surrounding Sgr may be affecting the nebular expansion.
Assuming that the higher-density tori can be associated with the ionization-bounded sectors in the NEBU models (Table 4), the tori of Wray 16-243 and He 2-436 contain roughly 10% of the total mass of the nebulae. This should be taken with care, as the models are imperfect representations. For StWr 2-21, the HST image suggests that the torus does not show a strong ionization front, consistent with the model where this sector has a very low covering factor. For Wray 16-423, the torus has a clear sharp edge as expected from an ionization front. In both cases, the mass fraction may be underestimated. For He 2-436, the dense sector has a very small thickness which suggests that the ionization front has barely penetrated the high density inner shell. The low total mass of the model also suggests that a large fraction of its mass is not yet ionized.
The masses in the nebulae are typical compared to Galactic objects. The bipolar structures are also typical, with half of Galactic PNe showing similar morphology (Corradi & Schwarz, 1995). He 2-436 has perhaps a more extreme structure, with a very pronounced, compact torus and a high density contrast. A number of Galactic post-AGB stars show similar structures, but these have typically cool and unevolved central stars.
Stanghellini et al. (2003) finds similar statistics on morphology between the LMC, SMC and the Galaxy. Our sample agrees with the prevalence of the same basic morphological types, regardless of environment. This is an important result: it provides evidence against models where the (mild) bipolarity is caused by substellar/planetary companions (Livio & Soker, 2002), as this would tend to introduce a metallicity dependence which is not observed. Strongly bipolar nebulae may be the product of a unique evolution for each object (Soker, 2002): for the milder stuctures seen here, a single evolutionary cause may be preferred.
6.5.2 Double shell
The presence or absence of a double-shell structure is an important characteristic of PNe. The evolution of a PN is dominated by a few effects: (i) the expansion and density profile of the progenitor AGB wind; (ii) the fast wind from the central star blowing into the AGB wind; (iii) the ionization of the swept-up nebula and the resultant pressure imbalance (Perinotto et al., 2004; Schönberner et al., 2005). The fast wind sets up a compressed rim at the inner radius: this is the usual PN. The over-pressure in the ionized region sets up a swept-up shell further out. This leads to the ’double shell’ consisting of the bright inner rim and the fainter outer shell. Perinotto et al. (2004) presents and extensive set of hydrodynamical models for spherical PNe, to show how this structure evolves as function of AGB mass loss and central star mass. The double shell appears after the ionization front breaks out from the inner rim, and the nebula becomes density-bounded. In earlier phases where the PN is ionization bounded, only the rim is seen.
A double shell is evident in the radial profiles of Wray 16-423 and StWr 2-21 (Fig. 2). The nebula can be approximated by the hydrodynamical model for a 0.605 M⊙ central star (sequence 6 of Perinotto et al., 2004). Here the nebula becomes density bounded after approximately 3500 yr. The outer radius of the rim of Wray 16-423 (), and the brightness contrast between the rim and shell of a factor of 4–5, are to first order consistent with the corresponding Perinotto model in the early density-bounded phase. (The spherical asymmetry in the nebulae will cause differences in evolution with respect to the symetric models.) This model uses a high AGB mass-loss rate, peaking at (case B2 of Blöcker (1995a) was used). It also has a too high progenitor mass of 3 M⊙. The size of the rim increases with lower mass-loss rate, but it is not a strong function. The models suggests that a uniform can also be accommodated in order to explain the observed structure. A high peak mass-loss rate is however more likely, as AGB mass-loss rates are known to increase with time.
The outer shell of StWr 2-21 is less distinct because of a low contrast: the brightness contrast is a factor of 2–3. The Perinotto models show an increasing contrast with time. As StWr 2-21 is the more evolved nebula, this suggests its evolution has not been identical to that of Wray 16-423. However, the differences are relatively minor. The structure of the nebula changes strongly after the star enters the cooling track, but this has not yet happened even for StWr 2-21 (section 6.2).
He 2-436 shows no indication for such a double shell structure. This is as expected in its early phase of evolution, where the ionization front is still trapped inside the rim. The models of Dudziak et al. (2000) require a central dense inner shell together with a lower-density component. However, comparison with the images suggests this can be interpreted as the torus and the polar flows, rather than a radial double-shell structure.
6.5.3 Dynamics
The models of Perinotto et al. (2004) and Schönberner et al. (2005) also predict velocity fields, which can be compared to those derived here. The flow velocities are sensitive to the wind density structure.
The youngest object, He 2-436, shows a decreasing velocity with radius over the highest density gas. As in all cases, the velocities increase again towards the outer edge (ionization front). The predicted velocities in this phase show the same behaviour as observed, but the predicted velocities are around 10 km s-1 while the observed expansion is faster. For Wray 16-423, a complicated velocity field is found which shows only a vague resemblance to the predicted one (within the highest density gas, the slight decline of expansion velocity with radius is consistent with the models, as is the value of the velocities in this region of around 20 km s-1. The observed sharp increase near the inner edge is not predicted, nor is the increase in the low density outer gas.
For StWr 2-21, the velocities increase linearly with radius, in contrast to the other two modelled nebulae. This is a predicted feature of more evolved nebulae, and is a better indication of its evolutionary state than the density contrast of the rim and shell. The observed velocities (reaching 50 km s-1 near the outer edge) are somewhat large compared to the model values.
The issue of high observed expansion velocities is addressed by Schönberner et al. (2005), who shows that velocities are higher if a steeper initial density distribution, , is assumed. Our expansion velocities, compared to Fig. 12 of Schönberner et al. (2005), indicate values of for He 2-436, and for the other two objects. This density distribution is expected from an AGB wind which increases in time.
We note that both the Torun models and the Schoenberner models are one-dimensional. This is a significant limitation for intrinsically 3-d objects. Observed structure in the velocity field, such as found in Wray 16-423, may result from averaging over different directions. The derived parameters in the Torun models: average expansion velocity, dynamical age and mass, have been shown to be robust against assumptions regarding nebular structure, but effect such as turbulence are not. Three-dimensional kinematic models are being developed (e.g. Morisset et al., 2005) but full hydrodynamical models are still restricted to 1-D.
6.6 Evolution
Both stars and nebulae are consistent with an evolutionary sequence where He-2 436 is the youngest, Wray 16-423 more evolved and StWr 2-21 is the most evolved nebula, but where the initial conditions were very similar. The dynamical ages (Table 3) clearly show this sequence; the nebular radius increases whilst the density drops and the ionization front moves out. For StWr 2-21, very little of the mass is still neutral.
The IRAS detection of He 2-436 (Zijlstra & Walsh, 1996) also shows this object to be young with strong heating of the dust in proximity to the star. The absence of an IRAS detection for the other two objects is consistent with their much cooler expected dust.
The comparison with the hydrodynamical models, especially based on the velocity fields, suggests that the AGB mass-loss rates increased with time, and reached peak values of .
6.7 Abundances
Abundances for the Sgr PNe are listed in Table 6. Values for He 2-436 and Wray 16-423 are from Dudziak et al. (2000). StWr 2-21 abundances are from the models discussed in Section 6.1. The carbon abundance, based on the C II recombination line at 4267Å, is uncertain. The Cloudy model indicated lower abundances for StWr 2-21, by about 0.15 dex. We consider the fully converged NEBU model as more accurate, but either model shows that StWr 2-21 has higher abundances than the other PNe.
We also give abundances for BoBn 1. Unlike for the other Sgr PNe, a relatively good IUE spectrum is available for this PN. Abundances of BoBn 1 have been obtained by Howard et al. (1997) from models. However, for consistency with the other three PNe, the abundances derived from a two-sector NEBU model worked out by Péquignot (unpublished) are quoted in Table 6. The N, O and Ne abundances are in excellent agreement with a recent compilation by Perinotto et al. (2004) (who do not provide S and Ar). The NEBU results on the other hand differ somewhat (but for different reasons) from either Howard et al. (1997) or the re-compilation by the same group (Henry et al., 2004).
Table 6 shows the elemental abundances relative to the solar abundance of Lodders (2003). These abundances have been under discussion, and a downward revision to [O/H] = 8.66 has been proposed (Asplund et al., 2004). This revision has problems reproducing the known depth of the solar convection zone (Basu & Antia, 2004).
| Elem. | Wray 16-423 | He 2-436 | StWr 2-21 | BoBn 1 | Galactic | Solarb | Wray – | He 2 – | St – | BB – | GPNe – |
|---|---|---|---|---|---|---|---|---|---|---|---|
| PNea | |||||||||||
| H | 12.00.00 | 12.00 | 12.00 | 12.00.00 | 12.00.00 | 12.00 | - | - | - | - | - |
| He | 11.03.01 | 11.03.01 | 11.00 | 11.01 | 11.05.03 | 10.99 | +0.04 | +0.04 | +0.01 | +0.02 | +0.06 |
| C | 8.86.06 | 9.06.09 | 9.00: | 8.83 | 8.81.30 | 8.46 | +0.40 | +0.60 | +0.54 | +0.37 | +0.35 |
| N | 7.68.05 | 7.42.06 | 7.88 | 7.84 | 8.14.20 | 7.90 | –0.22 | –0.48 | –0.02 | –0.06 | +0.24 |
| O | 8.33.02 | 8.36.06 | 8.53 | 7.75 | 8.69.15 | 8.76 | –0.43 | –0.40 | –0.23 | –1.01 | –0.07 |
| Ne | 7.55.03 | 7.54.06 | 7.72 | 7.83 | 8.10.15 | 7.95 | –0.40 | –0.41 | –0.23 | –0.12 | +0.15 |
| Mg | 6.98.30 | – | – | – | 7.62 | –0.64: | – | – | – | – | |
| S | 6.67.04 | 6.59.05 | 6.93 | 5.16 | 6.91.30 | 7.26 | –0.59 | –0.67 | –0.33 | –2.10 | –0.35 |
| Cl | 4.89.18 | – | – | – | 5.33 | –0.44: | – | – | – | – | |
| Ar | 5.95.07 | 5.78.08 | 6.10 | 4.46 | 6.38.30 | 6.62 | –0.67 | –0.84 | –0.52 | –2.16 | –0.24 |
| K | 4.65.22 | – | – | – | 5.18 | –0.53: | – | – | – | – |
a Mean composition and scatter for non-Type I Galactic PNe (Kingsburgh & Barlow, 1994)
b Solar system abundances are from Lodders (2003)
The two previously analyzed PNe have identical abundances, which agree well with those of the carbon stars of Sgr. StWr 2-21 has a higher abundance. BoBn 1 has a complicated abundance pattern. This is an extraordinary object in that the neon abundance exceeds that of oxygen. Such an abundance pattern can only be caused by dredge-up of nuclear-burning products. The neon enhancement may indicate that the star has suffered a Very late Thermal Pulse (VLTP), similar to for example Sakurai’s Object (Hajduk et al., 2005). Alternatively, binary coalescence can be considered. C,N,O and Ne cannot be used to constrain its progenitor abundance: their high abundances reflect their formation within the star (Péquignot et al., 2000; Péquignot & Tsamis, 2005). However, both the sulfur and argon abundances of the PN indicate that [Fe/H] and possibly as low as , considering that, for low metallicity stars, [Fe/H] tends to be a few 0.1 dex smaller than [Ar/H] (e.g. Cayrel et al., 2004).
The [S/O] of the three PNe in the core of Sgr is for StWr 2-21, and and for the other two objects. This is close to but perhaps a little lower than the solar value listed in Table 6 (: the revision of Asplund et al. (2004) would give an even higher solar ratio). Caffau et al. (2005) present sulphur abundances for five stars in Terzan 7, a globular cluster in Sgr with a metallicity similar to He 2-436 and Wray 16-423. They find [S/O] , identical to our result. Sulphur and oxygen are both produced in massive supernovae, but the lower ratio in the lower metallicity objects may be due to primary oxygen production in low-metallicity AGB stars (Péquignot et al., 2000).
7 Discussion: The Sgr galaxy
7.1 Sgr Luminosity
We can estimate the luminosity of the Sgr galaxy from its PNe population. The specific frequency of PNe is fairly well determined within the Local Group: Magrini et al. (2003) find , in solar units. This predicts for Sgr a value of , or , provided the PNe population in Sgr is now reasonably complete. The lack of PNe near the centre of Sgr may raise doubt on this, however the centre is also lacking in globular clusters. Majewski et al. (2003) derive for the main body, assuming a King profile. We confirm their suspicion that this underestimates the total luminosity.
Assuming a mass-to-light ratio of 20–50 (Ibata et al., 1997; Majewski et al., 2004), the total mass of Sgr becomes –. This is close to the minimum value required for its survival up to the present (Ibata et al., 1997). The fact that one PN is found in the tail makes it likely that the tails account for a significant fraction of the Sgr mass, but not a dominant fraction.
7.2 The enrichment history of Sgr
StWr 2-21 shows noticeably high abundances compared to He 2-436 and Wray 16-423. The identical abundances of the latter suggest their progenitor stars formed in a single, major star-formation burst which took place in a well-mixed ISM. The burst has been dated at 5 Gyr ago, based on the AGB colour, and breaking the age-metallicity degeneracy with the PN abundances (Dudziak et al., 2000).
Evidence for a more metal-rich population was presented by Bonifacio et al. (2004), based on spectroscopy of 10 red-giant stars. They derive [Fe/H]. This is in agreement with StWr 2-21, for which we find [O/H]. The high metallicity suggests a recent star formation event. The last major burst of star formation in Sgr occured between 0.5 and 3 Gyr ago (e.g. Layden & Sarajedini, 2000); Bonifacio et al. (2004) date it at 1 Gyr or less. (More than one event may have occured.) Assuming 1 and 5 Gyr, progenitor masses for the PNe would be 2.2 and 1.3Ṁ⊙, respectively.
The fact that only one of the PNe shows this high metallicity does not agree with the finding of Bonifacio et al. (2004) that the large majority of their stars shows the higher metallicity. Allowance should be made for the small number of objects in both surveys. The difference could also be related to the location of their stars: Bonifacio et al. (2004) surveyed a region located midway between the core region of Sgr and the three PNe. Bellazzini et al. (2006) find that the large majority of the Sgr population has a metallicity in the range [M/H] = to and an age of Gyr. The more metal-rich, younger population traced by StWr 2-21 may not be uniformly distributed.
All four PNe are strongly carbon rich. The morphology of the Sgr dwarf has been traced extensively with M giants (Majewski et al., 2003; Bellazzini et al., 2006). However, the PNe confirm that even for the most metal-rich and youngest population, 3rd dredge-up causes the AGB stars to evolve into carbon stars.
BoBn 1 derives from a much more metal-poor population. The existence and significance of such a population in Sgr is shown by the metal-poor clusters M54 (which may be the nucleus of Sgr) and Arp2 have metallicity [Fe/H] = (Layden & Sarajedini, 2000), and Ter 8 is reported as [Fe/H] = (Layden & Sarajedini, 1997). The RR Lyrae population also shows a minor but significant population with [Fe/H] (Cseresnjes, 2001). BoBn 1, if its association with Sgr is confirmed, may derive from this earliest population of Sgr.
7.3 Evolution of Sgr
The abundance distributions of Dwarf Spheroidal galaxies, including Sgr, differ from dwarf irregular galaxies of similar luminosities. Both contain old stars of very low abundances (which in dwarf irregulars show a more spheroidal-like distribution: Minniti & Zijlstra, 1996). But whereas younger stars in dIrr galaxies still are at low abundances, with a strong relation between [O/H] and galaxy luminosity (Pilyugin, 2001), for dSph galaxies younger stars are more metal-rich (Grebel et al., 2003). For galaxies of similar mass and luminosities, the dSph galaxies have a dominant population which is much more metal-rich than do dIrr galaxies (e.g. Mateo, 1998). Different reasons have been suggested: more efficient enrichment, less infall of unprocessed gas or a large amount of tidal stripping (Grebel et al., 2003). dIrr galaxies may have low efficiency in enrichment due to blow-out of stellar ejecta by supernovae, or they may benefit from continuous infall of unprocessed extra-galactic HI. dSph galaxies may have lacked any subsequent gas infall (Layden & Sarajedini (2000) argue for a closed-box chemical evolution in Sgr). Present dSph systems may also have had a much higher luminosity/mass in the past with the present galaxy being only a remnant of the original system. It is however likely that the cause is related to the location of the galaxies: dwarf spheroidals are found near large galaxies while dwarf irregulars are more isolated.
The ISM in which the recent star formation of Sgr occured is unlikely to have been original. The orbit of Sgr takes it through the Galactic plane, outside the solar circle, every 1Gyr or so. This is believed to be a possible cause of sudden star formation bursts, but the passage will also strip Sgr of its gas. At present there is no evidence for ISM within the main body of Sgr although stripped HI has been found along its orbit (Putman et al., 2004).
Two sources of ISM renewal can be considered. The first is mass loss from stars, as traced by the planetary nebulae. The three PNe in the main body of Sgr suggest a current stellar death rate of about . For progenitor masses of 1.3–1.5 M⊙, and stellar remnants of 0.6 M⊙, the mass return rate to the ISM becomes . Over 1 Gyr, the approximate orbital period of Sgr, the ISM can reach which may be sufficient to trigger star formation. In the absence of significant rotation in the stellar population, this lost mass will congregate in the potential well. Thus, the next star formation event will occur near the centre of the galaxy, as is observed in Fornax (Saviane et al., 2000). As the original low metallicity ISM has been preferentially removed, the enrichment efficiency will be considerably higher than in the closed-box model. All these points are consistent with the properties of the dSph galaxies, including Sgr.
A second possiblity to be considered is that the dSph captured gas from the Galactic halo. Assuming that the halo contains a reservoir of cooling gas originating from a Galactic Fountain, a galaxy in orbit within the halo can be expected to capture some of this gas. This can explain the very high metallicities, as the halo gas has metallicities appropriate for the host galaxy. In combination with the self-enrichment scenario above, this would give an even faster increase of metallicity with time. It is noticeable that the metallicity of the most recent star formation event in Sgr has a metallicity, as shown by StWr 2-21, not below that of regions of the outer Galactic plane.
We finally note the similarity with the Fornax dwarf, a galaxy with similar mass and properties to Sgr. It also shows evidence for an extended star formation history with increasing metallicity. Both the old and the youngest population (at yr even younger than Sgr) have similar metallicity to their counterparts in Sgr, [Fe/H] , to (Saviane et al., 2000). Fornax has suffered much less ram pressure stripping and tidal stripping from the Galaxy, being in a much more distant orbit. This suggests that the fast chemical evolution is not dominated by gas removal through ram pressure. Instead gas accretion, or lack thereof, may drive the evolution. Enrichment in Fornax and Sgr may have been accelerated by a lack of an external source of metal-poor gas (as compared to isolated dIrr galaxies), or by accretion of enriched gas expelled by our Galaxy.
The origin of the difference in enrichment history between dSph and dIrr galaxies is still an enigma (Grebel et al., 2003). It is worth testing whether the isolated transition galaxies between dIrr and dSph, such as Phoenix, happen to be located in regions of a low density of accretable, non-enriched gas.
7.4 The tidal tails
The tidal tails of Sgr encircle the Milky Way Galaxy in a complicated pattern. The system clearly has had a long history of disruption. The models of Law et al. (2005) show how different parts of the tails trace different distortion events.
The Sgr tidal tails are an important, but not dominant, contribution to the Galactic halo. On statistical grounds, Bellazzini et al. (2003) argue that 4 of the 35 halo globular clusters should be linked with Sgr debris. Since approximately 10 halo PNe are known, our finding that one of these (BoBn 1) is a tidal member of Sgr is in line with the globular cluster fraction.
Bellazzini et al. (2003) do not consider the globular clusters beyond 60 kpc, as falling beyond the apogee of the Sgr orbit. But the tidal streams are found out to 80–100 kpc (Law et al., 2005) and at least one of their discarded distant clusters (NGC 2419) is attributed to Sgr debris (Newberg et al., 2003). No halo PNe are known at anywhere near such distances, possibly because of faintness.
The tidal tails trace the older, metal-poor population of Sgr (Alard, 2001; Bellazzini et al., 2002), as shown by its RR Lyrae stars (Cseresnjes, 2001). (Bellazzini et al. (2006) argue that the dominant metal-rich population should also be distributed around the tidal tails.) The globular clusters indicate that the [Fe/H] of the tidal tails is around to . This population becomes dominant in the tails because of the age-metallicity gradient: the earlier disruptions affected the older, less metal-rich population.
Within the Local Group, populations with [Fe/H] show indications for a deficit of PNe (Zijlstra, 2004; Magrini et al., 2003), related to a lower mass-loss efficiency on the AGB. This would enhance the fraction of peculiar objects (e.g. VLTP nebulae, for which the formation rate does not depend on metallicity), to which category BoBn 1 likely belongs.
8 Conclusions
The main points of our study of the PNe population of the Sagittarius dwarf spheroidal galaxy can be summarized as follows.
1. Two new PNe are discovered in Sgr, bringing the total number to four. One is located in the leading tidal tail, the other three are located in the main body, south of the main centre of Sgr. The PNe population (assuming the sample is complete) indicates an absolute visual magnitude of for Sgr, including its leading and trailing tails. A stellar death rate of per year is derived.
2. HST images of the three PNe in the main body of Sgr show very similar, bipolar morphologies, consisting of a denser equatorial torus and lower density, more extended polar regions. This type of morphology is also common among Galactic PNe, and therefore the origin is unlikely to be dependent on metallicity-dependent effects, as would be expected if planetary companions provide the angular momentum required for the equatorially-enhanced mass loss. Whereas for strongly bipolar PNe it has been argued that every object is the product of a unique evolution (Soker, 2002), for the mildly bipolar nebulae a single cause is preferred.
3. Analysis of the central stars shows that all are on the post-AGB track, prior to entering the cooling track. The effective temperatures are between and K, and masses are close to 0.61 M⊙. Post-AGB ages are between 1000 and 5000 years.
4. All three analyzed PNe show WR emission lines, with early subclasses of [WO 2] to [WC 4]. WR-type central stars of PNe form a minority population among Galactic PNe. Their prominence in the Sgr galaxy suggests that the progenitor star characteristics (mass, metallicity) determine the occurence of such stars. This is in contrast to models where the (random) timing of the last thermal pulse is the crucial factor.
5. Photoionization models for the three PNe with HST images yield abundances of [O/H] for one object and [O/H] for the other two. The first object confirms the reality of the metal-rich population uncovered recently by Bonifacio et al. (2004), and suggests it accounts for a substantial part of the Sgr stellar population, albeit not its majority. The identical abundances of the other two objects argue for a short-lived burst in a well-mixed ISM: this burst has been dated at 5 Gyr ago. The higher metallicity object may date from a burst roughly 1 Gyr ago. The fourth object, BoBn 1, located in the tidal tail, has very unusual abundances and a non-standard history, but a progenitor metallicity of [Fe/H] is indicated. This object may belong to the oldest population of Sgr.
6. The mass-weighted expansion velocities are similar to those of Galactic PNe, and show no indication of a metallicity effect. Kinematic ages and core masses are derived: all three objects have similar core masses of around 0.61 M⊙. The age–velocity relation, compared to hydrodynamical models, suggest a steep initial density distribution, of . This indicates that the preceding AGB stars showed mass-loss rates increasing with time.
7. The ISM reformation rate of Sgr due to stellar mass loss is . This amounts to over one orbit, which may be sufficient to trigger renewed star formation.
8. The steep metallicity-age gradient, and the very high recent abundance, must be due to a combination of stripping of older ISM from Sgr, with enrichment from its own stellar mass loss. The fact that Fornax, which is in a much wider orbit around the Milky Way, shows very similar recent enrichment, may indicate that ram-pressure stripping is not the dominant effect. We suggest that accretion of gas originating from the Milky Way may play a role. This is based on the fact that the most metal-rich population has a metallicity not too different from that of the outer regions of the Milky Way Galaxy.
9. We finally note that He 2-436 provides the sole direct detection of dust in a dwarf spheroidal galaxy, to date.
Acknowledgements
This research was supported by a NATO collaboratve program grant number PST.CLG.979726. KG acknowledges financial support from the Polish State Committee for Scientific Research grant No. 2.P.03D.002.025. PvH acknowledges support from the Belgian Science Policy Office under IAP grant P5/36. DM is partially supported by FONDAP 15010003 and by the John Simon Gugenheim Foundation. ESO supported this research through its visitor program. We gratefully acknowledge discussion with C. Morisset. The HST data was part of observing program 9356.
References
- Acker et al. (1992) Acker A., Marcout J., Ochsenbein F., Stenholm B., Tylenda R., 1992, Strasbourg - ESO catalogue of galactic planetary nebulae.. Garching: European Southern Observatory
- Acker & Neiner (2003) Acker A., Neiner C., 2003, A&A, 403, 659
- Alard (1996) Alard C., 1996, ApJ, 458, L17
- Alard (2001) Alard C., 2001, A&A, 377, 389
- Asplund et al. (2004) Asplund M., Grevesse N., Sauval A. J., Allende Prieto C., Kiselman D., 2004, A&A, 417, 751
- Balick & Frank (2002) Balick B., Frank A., 2002, ARA&A, 40, 439
- Basu & Antia (2004) Basu S., Antia H. M., 2004, ApJ, 606, L85
- Bellazzini et al. (2006) Bellazzini M., Correnti M., Ferraro F. R., Monaco L., P. M., 2006, A&A, 446, L1
- Bellazzini et al. (2002) Bellazzini M., Ferraro F. R., Ibata R., 2002, AJ, 124, 915
- Bellazzini et al. (2003) Bellazzini M., Ferraro F. R., Ibata R., 2003, AJ, 125, 188
- Blöcker (2001) Blöcker T., 2001, Ap&SS, 275, 1
- Blöcker (1995a) Blöcker T., 1995a, A&A, 297, 727
- Blöcker (1995b) Blöcker T., 1995b, A&A, 299, 755
- Bonifacio et al. (2004) Bonifacio P., Sbordone L., Marconi G., Pasquini L., Hill V., 2004, A&A, 414, 503
- Caffau et al. (2005) Caffau E., Bonifacio P., Faraggiana R., Sbordone L., 2005, A&A, 436, L9
- Cayrel et al. (2004) Cayrel R., Depagne E., Spite M., Hill V., Spite F., François P., Plez B., Beers T., Primas F., Andersen J., Barbuy B., Bonifacio P., Molaro P., Nordström B., 2004, A&A, 416, 1117
- Clegg & Middlemass (1987) Clegg R. E. S., Middlemass D., 1987, MNRAS, 228, 759
- Corradi & Schwarz (1995) Corradi R. L. M., Schwarz H. E., 1995, A&A, 293, 871
- Crowther (1999) Crowther P. A., 1999, in IAU Symp. 193: Wolf-Rayet Phenomena in Massive Stars and Starburst Galaxies, p. 116
- Cseresnjes (2001) Cseresnjes P., 2001, A&A, 375, 909
- Dohm-Palmer et al. (2001) Dohm-Palmer R. C., Helmi A., Morrison H., Mateo M., Olszewski E. W., Harding P., Freeman K. C., Norris J., Shectman S. A., 2001, ApJ, 555, L37
- Dudziak et al. (2000) Dudziak G., Péquignot D., Zijlstra A. A., Walsh J. R., 2000, A&A, 363, 717
- Ferland et al. (1998) Ferland G. J., Korista K. T., Verner D. A., Ferguson J. W., Kingdon J. B., Verner E. M., 1998, PASP, 110, 761
- Górny (2001) Górny S. K., 2001, Ap&SS, 275, 67
- Górny et al. (2004) Górny S. K., Stasińska G., Escudero A. V., Costa R. D. D., 2004, A&A, 427, 231
- Gesicki & Zijlstra (2000) Gesicki K., Zijlstra A. A., 2000, A&A, 358, 1058
- Gesicki & Zijlstra (2003) Gesicki K., Zijlstra A. A., 2003, MNRAS, 338, 347
- Gesicki et al. (2006) Gesicki K., Zijlstra A. A., Acker A., Górny S. K., Gozdziewski K., Walsh J. R., 2006, A&A, in press
- Grebel et al. (2003) Grebel E. K., Gallagher J. S., Harbeck D., 2003, AJ, 125, 1926
- Greig (1971) Greig W. E., 1971, A&A, 10, 161
- Hajduk et al. (2005) Hajduk M., Zijlstra A. A., Herwig F., van Hoof P. A. M., Kerber F., Kimeswenger S., Pollacco D. L., Evans A., Lopéz J. A., Bryce M., Eyres S. P. S., Matsuura M., 2005, Science, 308, 231
- Hawley & Miller (1978) Hawley S. A., Miller J. S., 1978, ApJ, 220, 609
- Helmi & White (2001) Helmi A., White S. D. M., 2001, MNRAS, 323, 529
- Henry et al. (2004) Henry R. B. C., Kwitter K. B., Balick B., 2004, AJ, 127, 2284
- Howard et al. (1997) Howard J. W., Henry R. B. C., McCartney S., 1997, MNRAS, 284, 465
- Ibata et al. (2001) Ibata R., Lewis G. F., Irwin M., Totten E., Quinn T., 2001, ApJ, 551, 294
- Ibata et al. (1994) Ibata R. A., Gilmore G., Irwin M. J., 1994, Nature, 370, 194
- Ibata et al. (1997) Ibata R. A., Wyse R. F. G., Gilmore G., Irwin M. J., Suntzeff N. B., 1997, AJ, 113, 634
- Jiang & Binney (2000) Jiang I., Binney J., 2000, MNRAS, 314, 468
- Kingsburgh & Barlow (1994) Kingsburgh R. L., Barlow M. J., 1994, MNRAS, 271, 257
- Kwok (2000) Kwok S., 2000, The origin and evolution of planetary nebulae, Cambridge University Press
- Law et al. (2005) Law D. R., Johnston K. V., Majewski S. R., 2005, ApJ, 619, 807
- Layden & Sarajedini (1997) Layden A. C., Sarajedini A., 1997, ApJ, 486, L107
- Layden & Sarajedini (2000) Layden A. C., Sarajedini A., 2000, AJ, 119, 1760
- Liu et al. (2004) Liu Y., Liu X.-W., Barlow M. J., Luo S.-G., 2004, MNRAS, 353, 1251
- Livio & Soker (2002) Livio M., Soker N., 2002, ApJ, 571, L161
- Lodders (2003) Lodders K., 2003, ApJ, 591, 1220
- Magrini et al. (2003) Magrini L., Corradi R. L. M., Greimel R., Leisy P., Lennon D. J., Mampaso A., Perinotto M., Pollacco D. L., Walsh J. R., Walton N. A., Zijlstra A. A., 2003, A&A, 407, 51
- Majewski et al. (2004) Majewski S. R., Kunkel W. E., Law D. R., Patterson R. J., Polak A. A., Rocha-Pinto H. J., Crane J. D., Frinchaboy P. M., Hummels C. B., Johnston K. V., Rhee J., Skrutskie M. F., Weinberg M., 2004, AJ, 128, 245
- Majewski et al. (2003) Majewski S. R., Skrutskie M. F., Weinberg M. D., Ostheimer J. C., 2003, ApJ, 599, 1082
- Marshall et al. (2004) Marshall J. R., van Loon J. T., Matsuura M., Wood P. R., Zijlstra A. A., Whitelock P. A., 2004, MNRAS, 355, 1348
- Mateo (1998) Mateo M. L., 1998, ARA&A, 36, 435
- Mauron et al. (2005) Mauron N., Kendall T. R., Gigoyan K., 2005, A&A, 438, 867
- Minniti & Zijlstra (1996) Minniti D., Zijlstra A. A., 1996, ApJ, 467, L13
- Monaco et al. (2004) Monaco L., Bellazzini M., Ferraro F. R., Pancino E., 2004, MNRAS, 353, 874
- Monreal-Ibero et al. (2005) Monreal-Ibero A., Roth M. M., Schönberner D., Steffen M., Böhm P., 2005, ApJ, 628, L139
- Morisset et al. (2005) Morisset C., Stasinska G., Pena M., 2005, in Szczerba R., Stasinska G., Gorny S., eds, Planetary Nebulae as Astronomical Tools, AIP Conf. Proc., Vol. 804. p. 44
- Newberg et al. (2003) Newberg H. J., Yanny B., Grebel E. K., Hennessy G., Ivezić Ž., Martinez-Delgado D., Odenkirchen M., Rix H.-W., Brinkmann J., Lamb D. Q., Schneider D. P., York D. G., 2003, ApJ, 596, L191
- O’Dell & Doi (1999) O’Dell C. R., Doi T., 1999, PASP, 111, 1316
- Oke (1990) Oke J. B., 1990, AJ, 99, 1621
- Osterbrock (1989) Osterbrock D. E., 1989, Astrophysics of gaseous nebulae and active galactic nuclei. University of California, University Science Books
- Parker et al. (2003) Parker Q. A., Hartley M., Russeil D., Acker A., Morgan D. H., Beaulieu S., Morris R., Phillips S., Cohen M., 2003, in S. Kwok M. D., Sutherland R., eds, Planetary Nebulae: Their Evolution and Role in the Universe, IAU Symposium, Vol. 209, . Astron. Soc. Pac., p. 25
- Patat (1990) Patat F., 1990, EFOSC2 User’s Manual. ESO, Garching
- Pena et al. (1997) Pena M., Ruiz M. T., Torres-Peimbert S., 1997, A&A, 324, 674
- Péquignot et al. (2003) Péquignot D., Liu X.-W., Barlow M. J., Storey P. J., Morisset C., 2003, in IAU Symposium 209: Planetary Nebulae: Their Evolution and Role in the Universe, Eds. Sun Kwok, Michael Dopita, and Ralph Sutherland. p. 347
- Péquignot et al. (2000) Péquignot D., Walsh J. R., Zijlstra A. A., Dudziak G., 2000, A&A, 361, L1
- Péquignot & Tsamis (2005) Péquignot D., Tsamis Y. G., 2005, A&A, 430, 187
- Perinotto et al. (2004) Perinotto M., Morbidelli L., Scatarzi A., 2004, MNRAS, 349, 793
- Perinotto et al. (2004) Perinotto M., Schönberner D., Steffen M., Calonaci C., 2004, A&A, 414, 993
- Pilyugin (2001) Pilyugin L. S., 2001, A&A, 374, 412
- Pottasch (1996) Pottasch S. R., 1996, Ap&SS, 238, 17
- Putman et al. (2004) Putman M. E., Thom C., Gibson B. K., Staveley-Smith L., 2004, ApJ, 603, L77
- Rauch (2003) Rauch T., 2003, A&A, 403, 709
- Ruffle et al. (2004) Ruffle P. M. E., Zijlstra A. A., Walsh J. R., Gray M. D., Gesicki K., Minniti D., Comeron F., 2004, MNRAS, 353, 796
- Saviane et al. (2000) Saviane I., Held E. V., Bertelli G., 2000, A&A, 355, 56
- Schönberner et al. (2005) Schönberner D., Jacob R., Steffen M., Perinotto M., Corradi R. L. M., Acker A., 2005, A&A, 431, 963
- Soker (2002) Soker N., 2002, MNRAS, 330, 481
- Stanghellini et al. (2003) Stanghellini L., Shaw R. A., Balick B., Mutchler M., Blades J. C., Villaver E., 2003, ApJ, 596, 997
- Stasińska et al. (2004) Stasińska G., Gräfener G., Peña M., Hamann W.-R., Koesterke L., Szczerba R., 2004, A&A, 413, 329
- van Loon (2000) van Loon J. T., 2000, A&A, 354, 125
- van Loon et al. (2005) van Loon J. T., Cioni M.-R. L., Zijlstra A. A., Loup C., 2005, A&A, 438, 273
- Walsh et al. (1997) Walsh J. R., Dudziak G., Minniti D., Zijlstra A. A., 1997, ApJ, 487, 651
- Wareing et al. (2006) Wareing C., O’Brien T. O., Zijlstra A. A., Wright N., Greimel R., Drew J. E., 2006, MNRAS, 366, 387
- Wright et al. (2005) Wright S. A., Corradi R. L. M., Perinotto M., 2005, A&A, 436, 967
- Zijlstra (2001) Zijlstra A. A., 2001, Ap&SS, 275, 79
- Zijlstra (2004) Zijlstra A. A., 2004, MNRAS, 348, L23
- Zijlstra et al. (1994) Zijlstra A. A., van Hoof P. A. M., Chapman J. M., Loup C., 1994, A&A, 290, 228
- Zijlstra & Walsh (1996) Zijlstra A. A., Walsh J. R., 1996, A&A, 312, L21