Infrared Constraints on AGN Tori Models
Abstract
This work focuses on the properties of dusty tori in active galactic nuclei (AGN) derived from the comparison of SDSS type 1 quasars with mid-Infrared (MIR) counterparts and a new, detailed torus model. The infrared data were taken by the Spitzer Wide-area InfraRed Extragalactic (SWIRE) Survey. Basic model parameters are constraint, such as the density law of the graphite and silicate grains, the torus size and its opening angle. A whole variety of optical depths is supported. The favoured models are those with decreasing density with distance from the centre, while there is no clear tendency as to the covering factor, ie small, medium and large covering factors are almost equally distributed. Based on the models that better describe the observed SEDs, properties such as the accretion luminosity, the mass of dust, the inner to outer radius ratio and the hydrogen column density are computed.
(1) Instituto de Astrofisica de Canarias, C/ Via Lactea s/n, 38200 La Laguna, Spain; (2) Dipartimento di Astronomia, Universita di Padova, Vicolo Osservatorio 5, 35122 Padua, Italy; (3) Infrared Processing and Analysis Center, California Institute of Technology, Pasadena, CA 91125, USA; (4) Astronomy Centre, Department of Physics and Astronomy, University of Sussex, Falmer, Brighton BN1 9QJ, UK; (5) Astrophysics Group, Blackett Laboratory, Imperial College London, London SW7 2BW, UK; (6) Center for Astrophysics and Space Sciences, University of California, San Diego, La Jolla, CA 92093-0424, USA; (7) Institute of Astronomy, University of Cambridge, Madingley Road, Cambridge CB3 0HA, UK
1. Torus Model
The torus geometry adopted to describe the shape and the spatial distribution of dust is the so-called flared disk, that is a sphere with the polar cones removed. Its size is defined by its outer radius, Rout, and the opening angle, of the torus itself. The dust components that dominate both the absorption and the emission of radiation are graphite and silicate. The location of the inner radius, Rin, depends both on the sublimation temperature of the dust grains (1500 and 1000 K, for graphite and silicate, respectively) and on the strength of the accretion luminosity. We adopted the absorption and scattering coefficients given by Laor & Drain (1993) for dust grains of different dimensions, weighted with the standard MRN distribution (Mathis et al. 1977). Grains dimensions range from 0.005 to 0.25 micron for graphite, and 0.025 to 0.25 micron for silicate. The gas density within the torus is modeled in such a way to allow a gradient along both the radial and the angular coordinates.
The central source is assumed to be point-like and its emission isotropic. Its spectral energy distribution is defined by means of a composition of power laws with different values for the spectra index in the UV, optical and IR. A numerical approach – the -iteration method – was adopted to solve the radiative transfer equation. A geometrical grid is defined along the three spatial coordinates, and the main physical quantities (dust density and temperatures, electromagnetic emission, optical depth, etc.) are computed with respect to the center of the volume elements defined by the grid. When computing the total incoming energy on a given volume element a very accurate computation of the optical depth, is done. Furthermore, since silicate grains have a lower sublimation temperature with respect to graphite, we account for the fact that the innermost regions of the torus contain only graphite and are silicate free
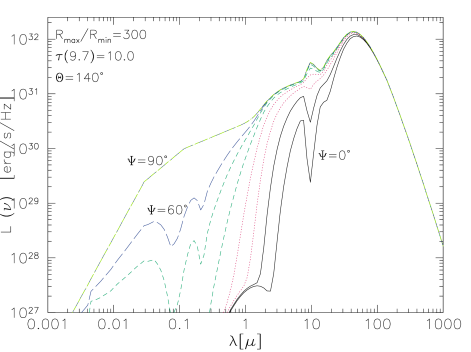
Finally, the global SED is computed at different angles of the line-of-sight with respect to the torus equatorial plane, in order to account for both type 1 and type 2 objects emission and includes three contributions: emission from the AGN, thermal emission and scattering emission by dust in each volume element. For an example of an emitted spectrum see Fig. 1. We refer to Fritz et al. (2006) for a detailed description of the model developed to compute the emission of dust in AGN.
2. Data
The MIR data used here are taken from the SWIRE ELAIS N1 and N2 and the Lockman fields, and were obtained from February 2004 through July 2004, with both IRAC and MIPS. For the purposes of this work only the four IRAC bands and MIPS 24 micron are used. The SWIRE catalogues we use were processed by the SWIRE collaboration. Details about the data can be found in Lonsdale et al. (2004), Surace et al. (2005) and Shupe et al., in prep.
The Sloan Digital Sky Survey has validated and made publicly available its Data Release 4 (DR4), covering the entire Lockman and SWIRE EN2 fields and a part of the SWIRE EN1 field. A total of 280 spectroscopically confirmed quasars lie within the SWIRE fields covered by the SDSS DR4 spectroscopic release. Their -band magnitudes reach 19.1 for objects with redshifts typically less than 2.3 and go up to a magnitude deeper for higher redshifts (Richards et al. 2002). For a detailed analysis of the properties of the sample in EN1 see Hatziminaoglou et al. (2005)
3. First Results
Each observed SED is compared to a total of 720 models, with 10 lines of sight each (from an equatorial to a pole-on view). Examples of best fits are shown in Fig. 2. Here we summarize some of the results of the fitting procedure:
-
Size of Torus: Overall, Rout/Rin and the torus covering factor are equally distributed between the allowed values (30, 100, and 300; 95%, 75% and 50%, respectively). However, both inner and out radii clearly increase with , whereas larger covering factors models tend to fit realtively low redshift ( 1) objects.
-
Density: For 70% of the objects the density (written as ) decreases radially from the centre while for another 25% it remains constant.
-
Optical depth: This work addresses, among other things, the possibility of low optical depth tori. The SED fitting resulted in some 45% of objects with 1.0 and 55% with 1.0. This implies that, for some configurations, type 1 AGN could be seen even when the line of sight intercepts the torus.
The distribution of outer radius of the torus, Rout, and the mass of dust, MDust, with is shown in the left and right panels of Fig. 3, respectively. MDust is computed summing the individual sample elements of the best-fit model. The increase of both Rout and MDust with redshift could indicate larger and more massive tori at higher redshifts, however it could also simply be the manifestation of the Malmquist bias, as both quantities scale with the accretion luminosity, Lacc, an input of our model that is proportional to the bolometric luminosity computed from the data. Note that MDust does not refer to the total mass of the torus, that can be obtained by adding the mass of gas, typically 100 times larger than that of the dust.
Acknowledgments.
This work is based on observations made with the Spitzer Space Telescope. It also makes use of the SDSS Archive. It was supported in part by the Spanish Ministerio de Ciencia y Tecnologia (Grants Nr. PB1998-0409-C02-01 and ESP2002-03716) and by the EC network ”POE” (Grant Nr. HPRN-CT-2000-00138).
References
- Fritz et al. (2006) Fritz J., Franceschini A. & Hatziminaoglou E., 2006, MNRAS, 366, 767
- Hatziminaoglou et al. (2005) Hatziminaoglou E. et al., 2005, AJ, 129, 1198
- Laor & Drain (1993) Laor A. & Drain B.T., 1993, ApJ, 402, 441
- Lonsdale et al. (2004) Lonsdale C. et al., 2004, ApJS, 154, 54
- Mathis et al. (1977) Mathis J.S., Rumpl W. & Nordsieck K.H., 1977, ApJ, 217, 425
- Richards et al. (2002) Richards G.T. et al., 2002, AJ, 123, 2945
- Surace et al. (2005) Surace J. et al., 2005, SWIRE Data Release Document