Large-scale study of the NGC 1399 globular cluster system in Fornax
We present a Washington and Kron–Cousins photometric study of the globular cluster system of NGC 1399, the central galaxy of the Fornax cluster. A large areal coverage of 1 square degree around NGC 1399 is achieved with three adjoining fields of the MOSAIC II Imager at the CTIO 4-m telescope. Working on such a large field, we can perform the first indicative determination of the total size of the NGC 1399 globular cluster system. The estimated angular extent, measured from the NGC 1399 centre and up to a limiting radius where the areal density of blue globular clusters falls to 30 per cent of the background level, is 45 5 arcmin, which corresponds to 220 – 275 kpc at the Fornax distance. The bimodal colour distribution of this globular cluster system, as well as the different radial distribution of blue and red clusters, up to these large distances from the parent galaxy, are confirmed. The azimuthal globular cluster distribution exhibits asymmetries that might be understood in terms of tidal stripping of globulars from NGC 1387, a nearby galaxy. The good agreement between the areal density profile of blue clusters and a projected dark-matter NFW density profile is emphasized.
Key Words.:
Galaxies: individual: NGC 1399 – galaxies: clusters: general – galaxies: elliptical and lenticular, cD – galaxies: star clusters – galaxies: photometry – galaxies: halos1 Introduction
The study of globular cluster systems (GCSs) around giant galaxies within galaxy clusters has proved to be a useful tool for improving our knowledge of the formation and evolution of galaxies in these environments, e.g. M 87 (Hanes et al. 2001; Côté et al. 2001) and M 49 (Rhode & Zepf 2001; Côté et al. 2003) in Virgo, NGC 1399 in Fornax (Ostrov et al. 1998; Dirsch et al. 2003) or NGC 3311 in Hydra (McLaughlin et al. 1995; Brodie et al. 2000). Many of these GCSs are so huge that it has not been possible yet to study most of the system through their full projected spatial distribution even with wide-field mosaics (Rhode & Zepf 2001; Dirsch et al. 2003).
In particular, much work has been devoted to the GCS around NGC 1399, at the centre of the Fornax cluster. The wide-field study by Dirsch et al. (2003, hereafter Paper I) presents a detailed description of the previous investigations of this GCS so we simply refer the reader to it instead of repeating it here. The Washington photometry presented in Paper I is based on images from the CTIO MOSAIC camera ( arcmin) obtained with the Washington photometric system. According to this study the GCS extends farther than 100 kpc from the parent galaxy (NGC 1399). The globular cluster (GC) colour distribution is bimodal, and for r 8 arcmin the (projected) spatial distribution of the red ( metal–rich) GCs is more concentrated than that of the blue (metal–poor) clusters. At larger galactocentric distances, however, the radial density profiles are similar. The total number of GCs is estimated to be about 6500, and the global specific frequency (as defined by Harris & van den Bergh 1981) is found to be . A further discussion of the intrinsic specific frequencies of both cluster populations, as well as of the connection of the colour bimodality with the surface profile brightness of the galaxy, has been presented in Forte et al. (2005).
The dynamical status of the GCS around NGC 1399 has been addressed in recent kinematic studies by Richtler et al. (2004); Dirsch et al. (2004); Schuberth et al. (2004). Another wide-field study of the GCS of NGC 4636, a bright elliptical in the Virgo cluster, has recently been performed by Dirsch et al. (2005) on the basis of the same type of data as used in the present study: wide-field Washington photometry.
Here we present a new study of the NGC 1399 GCS based on an enlarged set of MOSAIC wide-field images. In addition to the ‘central field’ analysed in Paper I, we obtained Washington photometry of two new adjoining fields labelled ‘east’ and ‘northeast’. The larger area now covered enables us to assess the approximate extent of the GCS and to perform a large-scale study of the colour and spatial distribution of the blue and red cluster populations.
This analysis of the NGC 1399 GCS is organised as follows. Section 2 describes the observations and GC candidate selection. The colour and spatial distributions are analysed in Sec. 3. Finally, a summary and a discussion of the results are presented in Sec. 4.
2 Observations and reductions
The images used in this study were obtained during three observing runs with the MOSAIC camera (8 CCDs mosaic imager) mounted at the prime focus of the 4-m Blanco telescope at the Cerro Tololo Inter–American Observatory (CTIO). The images containing NGC 1399 (‘central field’) and the background field located 3.5 deg northeast of this galaxy have already been presented in Paper I which we refer the reader to for details of the observations. Observations of the two fields adjacent to NGC 1399 (‘east’ and ‘northeast’ fields) were carried out during November 17–19, 2001. All fields (except for the background) overlap each other and are shown in Fig. 1. The wide field of the MOSAIC is 36 36 arcmin (200 200 kpc at the Fornax distance) with a pixel scale of 0.27 arcsec. In the following, the adopted distance to NGC 1399 is mag (Paper I) corresponding to 19 Mpc.
All fields were imaged in Kron–Cousins and Washington . We selected the filter instead of the original Washington , as the Kron–Cousins and magnitudes are very similar (only a zero-point difference ) and the filter is more efficient than (Geisler 1996). As in the previously observed fields, to fill in the gaps between the 8 individual MOSAIC chips, the data in the two adjacent fields were dithered taking three images in with exposure times of 600 s each, and five images for the ‘east’ field and four for the ‘northeast’ one, in , with exposures of 1 200 s each.
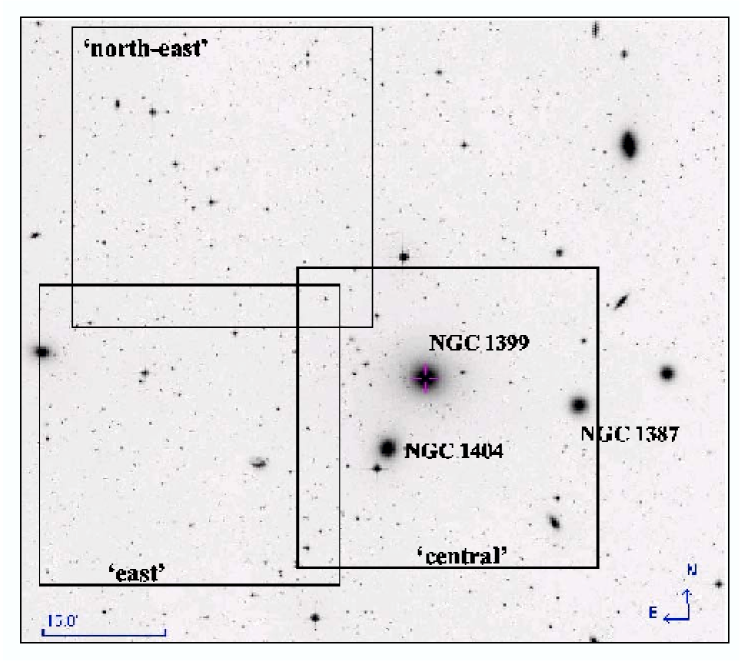
The MOSAIC data in the ‘east’ and ‘northeast’ fields were reduced using the mscred package within IRAF111IRAF is distributed by the National Optical Astronomy Observatories, which is operated by AURA, Inc. under contract to the National Science Foundation., following the same procedure applied to the ‘central’ field in Paper I and to another field obtained in the same run (west of NGC 1399, Bassino et al. 2005). This western field is not included in the present study since it contains several galaxies with their own GCSs, which would severely contaminate any search for NGC 1399 GCs (see Fig. 1). The seeing in the combined images was 1 arcsec on the frame and 1.3 arcsec on the frame.
The halo light of NGC 1399 was subtracted by means of a ring median filter with an inner boundary of 1.3 arcsec and an outer boundary of 10.7 arcsec. This process also helped to correct a remaining flatfield structure present in the images that was not possible to remove even with master-flats. The sensitivity variations in the final combined images is below 0.3 percent.
The photometry was done with DAOPHOT within IRAF; DAOFIND on combined images was used for the first search. In the final and images and for each field, second-order variable PSFs were derived using about 100 evenly distributed stars per frame, which were fit to the sources through the ALLSTAR task. The estimated errors in the aperture corrections between the PSF radius (10 pix) and a 15 pix radius for the ‘east’ and images were and mag, respectively, and for the ‘northeast’ and images were and mag, respectively.
In order to perform the selection of point sources, the parameters and sharpness of the ALLSTAR task were used. Thus, over 5 000 point sources were selected in each of the ‘east’ and ‘northeast’ fields, within the magnitude range .
The photometric calibration needed for the ‘east’ and ‘northeast’ fields has already been performed in Paper I for the same run, so we will use those equations. We will not reproduce them here, so for further details please refer to Paper I. As we intend to combine observations from the ‘central’ field with the two adjoining ones, it is essential to preserve the homogeneity in the photometry. Thanks to the point sources located in the regions where the central field overlaps with the other two, we can compare the magnitudes (after calibration of each field to the standard system) and refer all the magnitudes to the ‘central’ field system, particularly in this case where differences are likely to arise due to the large size of the images involved and remaining sensitivity differences between the eight chips of the MOSAIC fields. In this way, corrections (adjacent minus central field magnitude) and were applied to the ‘east’ field point sources to refer its magnitudes to the ‘central’ one, and and to the ‘northeast’ field, with the same purpose. The number of overlapping objects used to calculate those corrections are: 189 objects in and 489 in between the ‘central’ and ‘east’ fields, and 61 objects in both and between the ‘central’ and ‘northeast’ fields.
We select as GC candidates those point sources with colours and magnitudes . The adopted limiting magnitude is bright enough so that completeness corrections should only be a few percent and will not be necessary for the aim of this study. The separation between blue and red GC candidates will be taken as following Paper I.
The selection of GC candidates should be corrected for contamination by the background. For this purpose, a background field located 35 northeast from NGC 1399 was used, as in Paper I. In this field, the projected density of point sources within the colour and magnitude ranges corresponding to blue GCs is objects arcmin-2 and the one corresponding to red GCs objects arcmin-2. In the rest of this paper, zero reddening has been assumed (Ostrov et al. 1998).
3 Globular cluster colour distribution
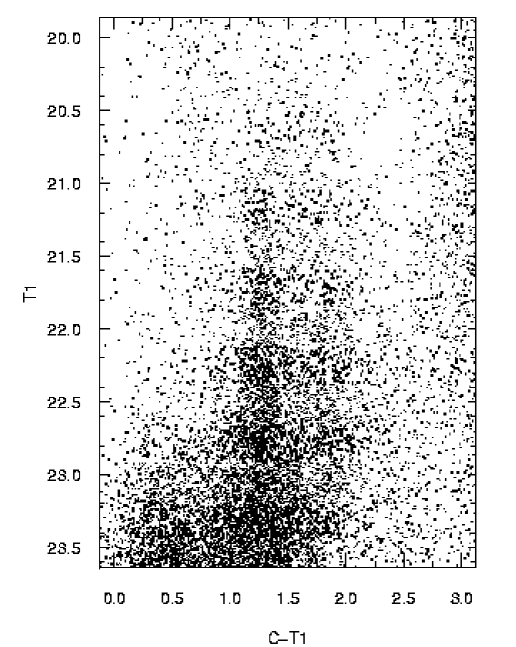
Figure 2 presents the colour-magnitude diagram for point sources in the whole field under study, where we have taken the average for GCs observed on more than one field. The blue and red GC candidates show up within the stated ranges of magnitudes and colours. This diagram looks very similar to the one obtained in Paper I (see their Fig. 3).
With the aim of analysing the colour distribution of the GC candidates at different projected distances from the NGC 1399 centre, we plot the corresponding colour distributions in Fig. 3, smoothed with a Gaussian kernel with a dispersion 0.09 mag (the size of the histograms bins), for four different radial ranges: 1.5–9, 9–20, 20–35, and 35–52 arcmin. We choose an outer limit of 52 arcmin, as this is the largest distance from NGC 1399 we can reach with a reliable areal coverage for estimating densities. These colour distributions were computed after excluding the GC candidates seen in projection close to other galaxies present in the field. In a conservative way we excluded the circles with radii: r = 1000 pix (4.5 arcmin) around NGC 1387, r = 600 pix (2.7 arcmin) around NGC 1404, and r = 2000 pix (9 arcmin) around NGC 1427 (NGC 1427 is on the eastern border of the ‘east’ field, see Fig. 1). The raw colour distributions and the distributions with statistical background subtraction are displayed together with the histograms of the background-corrected data and the corresponding background colour distributions. The results from the fits of the sum of two Gaussians performed on the colour histograms are given in Table 1; the same results are obtained, within the uncertainties, if the fits are performed directly on the smoothed colour distributions instead of the histograms.


| r [arcmin] | ||||
| 1.5 – 9 | ||||
| 9 – 20 | ||||
| 20 – 35 | – | – | ||
| 35 – 52 | – | – |
The innermost colour distribution (1.5 r 9 arcmin) is clearly bimodal with colours for the blue and red peaks in agreement, within the errors, with the values obtained in Paper I for the 1.8–4.5 arcmin range. In the following sample (9 r 20 arcmin) the blue peak is slightly bluer than the inner one while the red GCs show a larger spread in colour, and are also bluer than their inner counterparts. In the third group (20 r 35 arcmin), the mean colour of the blue peak is again bluer, close to the limit of the errors, than the two inner samples, and the red GCs show a distribution that is marginally in excess of the background level; it is not possible to fit a Gaussian to the colour histogram of the red GCs in this case. Finally, even in the outermost sample (35 r 52 arcmin), the blue peak can be clearly identified and its position shows the same tendency; that is, it is bluer than all the previously determined ones, while the red GCs are absent, the colour distribution being indistinguishable from the background in their expected colour range.
From these colour distributions it can be inferred that the mean colour of the blue peak gets bluer with increasing radius through the radial extent considered for computing the colour distributions, that is, from 1.5 up to 52 arcmin. If we assume that the blue peak colours correspond to the centre of each radial bin (Table 1) and transform the colours into metallicities by means of the relation given by Harris & Harris (2002), we obtain a metallicity gradient for the blue GCs of (r in kiloparsecs). The same effect has been found in the GCS around NGC 1427 (Forte et al. 2001, see their Fig. 14) where a colour gradient is present in the blue GC population; it agrees with our value within the (rather large) errors. We also show that the red GCs are present up to a shorter projected distance from the centre of NGC 1399 than the blue ones, which supports the assumption that the blues have a shallower radial-density profile. The red GCs also show a significant gradient from the first to the second radial bins, although the peak in the second bin is harder to detect.

In order to confirm that out results do not rely on the chosen background colour distribution, we re-calculated the colour distribution functions for the GC candidates taking a limiting magnitude , instead of as considered in the rest of this paper. The resulting colour distributions (not displayed) show that taking a limiting magnitude for the raw GC and the background colour distributions does not change the shapes of the final colour distributions (background corrected) in the three inner radial bins. Even the mean colours of the blue and red peaks agree, within the errors, with the ones calculated with limiting magnitude . The only difference appears in the outer bin (35 r 52 arcmin) because there are almost no (blue) GC candidates left adopting a brighter limiting magnitude. In this latter bin, the raw colour distribution looks very similar to that of the background, which can be considered additional evidence that the colour distribution of the chosen background field is robust.
The colour distributions for three different magnitude ranges and without any radial selection are displayed in Fig. 4. It is interesting to note that the GCs belonging to the brightest bin (upper panel) do not seem to present a bimodal distribution, as already suggested by Ostrov et al. (1998) and in Paper I, but a unimodal, very broad distribution with a mean colour . The two fainter brightness bins show bimodal distributions with blue and red peak positions in excellent agreement: for the interval the blue/red peak colours are , while for the range we obtain .
4 Globular-clusters’ spatial distribution
All blue and red GC candidates identified in the three MOSAIC fields are shown in Fig. 5. It can be clearly seen that the red GCs (lower panel) present a more concentrated projected distribution than the blue ones (upper panel), with respect to the galaxies NGC 1399, NGC 1387, and NGC 1404.

4.1 Radial distribution
Figures 6 and 7 show the radial number-density profiles of the blue and red GCs around NGC 1399, respectively. The profiles were measured excluding the GC candidates located in the vicinity of NGC 1387, NGC 1404, and NGC 1427 as already explained in Sec. 3. The profiles were corrected for contamination by the background using the field located 3.5 deg northeast of NGC 1399, and the Poisson’s errors include the errors of the raw counts and of the background. Both figures show power-law fits to these background-corrected density profiles in the upper panels and r1/4 fits in the lower ones. Table 2 shows the background-corrected radial number densities for blue and red GCs and the fraction of the rings sampled in each case.


| r [arcmin] | % sampled ring | ||
|---|---|---|---|
| 1.5 – 2.5 | 100 | ||
| 2.5 – 3.5 | 100 | ||
| 3.5 – 4.5 | 100 | ||
| 4.5 – 6 | 100 | ||
| 6 – 7.5 | 100 | ||
| 7.5 – 9.5 | 93 | ||
| 9.5 – 11.5 | 88 | ||
| 11.5 – 14 | 89 | ||
| 14 – 16.5 | 77 | ||
| 16.5 – 19 | 75 | ||
| 19 – 22 | 72 | ||
| 22 – 25 | 65 | ||
| 25 – 28 | 49 | ||
| 28 – 31 | 38 | ||
| 31 – 34 | 34 | ||
| 34 – 37 | 32 | ||
| 37 – 40 | 32 | ||
| 40 – 43 | 27 | ||
| 43 – 46 | 23 | ||
| 46 – 49 | 16 | ||
| 49 – 52 | 8 |
-
a
The projected densities of point sources in the background field within the colour and magnitude ranges corresponding to blue/red GCs are 0.26 / 0.10 objects arcmin-2, respectively (limiting magnitude ).
The wide field covered in this study allowed us, for the first time, to perform an estimation of the total extent of the GCS around NGC 1399. We adopted the galactocentric radius at which the areal density of blue GCs (corrected by background contamination) falls to 30 per cent of the background level as an indicative value for this extent, as it is the largest radial distance from NGC 1399 at which we could separate the blue GCs from the background with our data. From the blue GC profile (Fig. 6) we obtained an extension of 45 arcmin that, at the Fornax distance, corresponds to a radial distance of 250 kpc. The same limit could not be obtained from the red GCs profile (Fig. 7) as the profile seemed to level out at a shorter radial distance, and there were fewer of them. It is at least worth noting that there are many red GCs lying out at large distances like 25 arcmin, that is, about 140 kpc.
In order to compute the uncertainties involved in this determination due to errors in the background, independently of the pure Poissonian errors, we recalculated the profiles using ‘blue’ and ‘red’ backgrounds 50 per cent above and below the original ones (see Figs. 6 and 7). In this way, the outer limit for the blue GCS around NGC 1399 is set to 45 5 arcmin, that is, a range in radial extension from 220 to 275 kpc. This indicative value should be considered as a lower limit, as we cannot guarantee that it does not extend further out.
The background-corrected density profile for blue GCs was first fit by a power law of the form in the range 5 to 52 arcmin, excluding the outer regions, where there are very few candidates left, and the innermost region (r 5 arcmin) that cannot be fit with the same power law (see Fig. 6, upper panel).
The density profile for red GCs was also fit by a power law but over a shorter range r 35 arcmin, which is the projected angular distance at which the profile levels out (Fig. 7, upper panel); in this case, the innermost region did not show any discrepancy with the power-law fit. The slope obtained for blue GC candidates was (rms = 0.13), while for red candidates (rms = 0.09). Thus, the red GCs around NGC 1399 show a steeper profile than the blues, even at large radial distances.
In Paper I, the blue clusters also showed a shallower density profile than the red clusters within 7 arcmin ( and for blues and reds, respectively), but could not be distinguished outside this radius. The reason for this discrepancy with Paper I is the steeper slope found here for the red clusters.
It is interesting to note that both density profiles, for blue and red clusters, can also be fit reasonably well by r1/4 laws: (Figs. 6 and 7, lower panels). In this case, the blue GCs profile can be fit even in the innermost region, and we obtain (rms = 0.12) for the blue candidates within 52 arcmin. The reds’ density profile was again fit up to r 35 arcmin, as in the power-law fit, for the same reason stated above; a slope (rms = 0.10) is obtained for the red candidates.
4.1.1 Comparison of the radial density profile of blue clusters with a NFW profile
The volumetric density function adopted by Richtler et al. (2004) for their dark matter halo
| (1) |
where and are the characteristic density and radius, respectively, corresponds to the NFW profiles (Navarro et al. 1997) in the case .
The linear least-square regression of the areal density for the blue globular clusters as a function of (depicted in Fig. 6, lower panel) has led to: , with an rms = 0.12 (including all the data points). This fit is practically equivalent to a projected NFW profile with a scale length = 6.25 arcmin () that, as shown in Forte et al. (2005), provides a good approximation of the blue clusters inside a galactocentric radius of 16.7 arcmin. It is interesting to note that such a NFW profile is indistinguishable from the NFW profile (for ) obtained for the dark halo of NGC 1399 in the kinematic and dynamical study of its GCS performed by Richtler et al. (2004). Fig. 8, on the other side, shows that the same regression holds in the vs. plane, implying that a single power would be adequate and that multiple power-law fits do not seem required.

The linear least-square regression of the areal density for the red globular clusters as a function of (shown in Fig. 7, lower panel) yielded: , with rms = 0.10. This solution, as mentioned above, includes only the points within r 35 arcmin (the 15 innermost data points) due to the increase of the profile noise outwards. A slightly better result, in terms of the rms, is obtained with a projected generalized NFW profile and after adopting the same parameters as in Forte et al. (2005), i.e., and a scale length =0.5 arcmin (rms = 0.08). As noted in that paper, this profile, in turn, cannot be distinguished from a Hubble profile with a core radius of about one arcmin (see Forbes et al. 1997b).
4.2 Azimuthal distribution
We analysed the azimuthal distribution of blue GCs around NGC 1399, which is depicted in Fig. 9, to search for any dependence of GC surface density on the position of neighbouring galaxies. The smoothed, projected distribution was obtained through a Gaussian kernel with a dispersion of 54 arcsec. Curves of constant numerical density have been overlaid on the image.
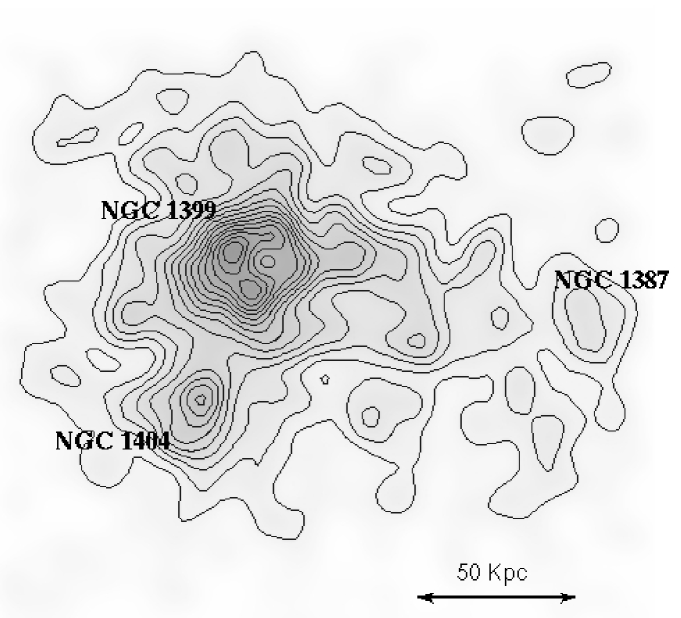
Two tails can be seen in the smoothed blue GC projected distribution, one towards NGC 1404 and another towards NGC 1387. As the angular separation between NGC 1399 and NGC 1404 is just 10 arcmin (a projected distance of 55 kpc at the Fornax distance), it is not clear if the ‘tail’ in that direction is showing some kind of interaction between the two galaxies that can be traced by the GCs or if it is just the superposition of the NGC 1399 and NGC 1404 GCSs.
On the other hand, the angular distance between NGC 1399 and NGC 1387 is about 19 arcmin, while the radial extension of the GCS around NGC 1387 is estimated as 3.1 arcmin (Bassino et al. 2005). In this case, the tail of the smoothed, projected distribution of blue GCs is pointing to an excess of such globulars in that direction, i.e. at a position angle (measured from N to E with respect to NGC 1399). We are then led to assume that some kind of interaction may be under way between both galaxies, and that blue GCs are tracing it. We discuss this point further below.
5 Summary and discussion
This large-scale study of the NGC 1399 GCS allowed us to analyse the colour and spatial-projected distribution up to a projected distance of 52 arcmin (about 290 kpc), i.e. up to a distance that has not been reached before with this kind of work.
The colour distribution at different galactocentric distances shows that the bimodality, present in the inner samples, gradually turns into a single blue population in the outer bins, in agreement with the general idea that red GCs have a steeper radial density profile than the blues, which is confirmed by the projected GC areal density profiles shown in Figs. 6 and 7. Besides, the position of the blue peak moves to bluer colours at larger galactocentric radii, a gradient that has also been detected in the NGC 1427 GCS by Forte et al. (2001).
In addition, the colour distribution at different magnitude ranges shows bimodal distributions for the intermediate and faint samples, but it seems to be unimodal at the brighter bin (), in agreement with Paper I. It is interesting to note that a similar behaviour has also been detected in the GCSs of several brightest cluster galaxies by Harris et al. (2005) and of the Virgo giant ellipticals M 87 and NGC 4649 by Strader et al. (2005). On the other side, the colour distribution at the bright magnitude range of the GCs around NGC 4636 is not unimodal but bimodal with a very similar number of blue and red clusters (Dirsch et al. 2005).
With respect to the radial projected distribution, Figs. 6 and 7 show that the outer regions of NGC 1399 are in fact dominated by an extension of its inner globular cluster populations out to at least 45 arcmin (or 250 kpc) in galactocentric radius, a range comparable to the Fornax cluster core radius (about 40 arcmin, Ferguson 1989). There is remarkable agreement between the blue GC radial density profile and the NFW profile (Navarro et al. 1997) for the dark-matter distribution obtained by Richtler et al. (2004) by means of their kinematical study of the NGC 1399 GCS.
Two tails show up in the (smoothed) azimuthal projected distribution of blue GCs around NGC 1399. One of them, towards NGC 1404, is likely to arise as an overlapping of both GCSs, although some authors point to an interaction process between both galaxies that leads to a stripping of GCs from NGC 1404 (Forbes et al. 1997a; Bekki et al. 2003). However, the tail towards NGC 1387 cannot be explained as just GCSs overlapping due to the larger projected distance between NGC 1399 and this galaxy. This evidence of an excess of blue GCs in that particular direction, as well as the low number of blue GCs present around NGC 1387 as compared to the red ones (Bassino et al. 2005), support the idea that this might be a case of tidal stripping (see, for instance, Forte et al. 1982; Muzzio 1987), a process through which part of the GCs from NGC 1387 might be being captured by the (much more massive) NGC 1399. Or during that process, they just remain within the potential well of the cluster without being bound to any individual galaxy –the intracluster GCs (Bassino et al. 2003). Such scenarios have already been suggested by Forbes et al. (1997a). It is also expected that this process will primarily affect the blue globulars as they represent the more extended GC sub-population. Radial velocities will probably help in confirm this assumption.
Acknowledgements.
We wish to thank the referee for comments that helped to improve the present paper. This work was funded with grants from the Consejo Nacional de Investigaciones Científicas y Técnicas de la República Argentina, Agencia Nacional de Promoción Científica Tecnológica, and Universidad Nacional de La Plata (Argentina). D.G. and T.R. gratefully acknowledge support from the Chilean Centro de Astrofísica FONDAP No. 15010003. LPB is grateful to the Astronomy Group at the Universidad de Concepción for financial support and warm hospitality. Y.S. gratefully acknowledges support from a German Science Foundation Grant (DFG–Projekt HI-855/2).References
- Bassino et al. (2003) Bassino, L.P., Cellone, S.A., Forte, J.C., Dirsch, B. 2003, A&A, 399, 489
- Bassino et al. (2005) Bassino, L.P., Richtler, T., Dirsch, B. 2005, MNRAS, in press
- Bekki et al. (2003) Bekki, K., Forbes, D.A., Beasley M.A., Couch W.J. 2003, MNRAS, 344, 1334
- Brodie et al. (2000) Brodie, J.P., Larsen, S.S., Kissler-Patig, M. 2000, ApJ, 543, L19
- Côté et al. (2001) Côté, P., McLaughlin, D. E., Hanes, D. A. et al. 2001, ApJ, 559, 828
- Côté et al. (2003) Côté, P., McLaughlin, D. E., Cohen, J. G., Blakeslee, J. P. 2003, ApJ, 591, 850
- Dirsch et al. (2003) Dirsch B., Richtler T., Geisler D. et al. 2003, AJ, 125, 1908 (Paper I)
- Dirsch et al. (2004) Dirsch B., Richtler, T., Geisler, D. et al. 2004, AJ, 127,2114
- Dirsch et al. (2005) Dirsch B., Schuberth, Y., Richtler, T. 2005, A&A, 433, 43
- Ferguson (1989) Ferguson, H.C. 1989, AJ, 98, 367
- Forbes et al. (1997a) Forbes, D.A., Brodie, J.P., Grillmair C.J. 1997, AJ, 113, 1652
- Forbes et al. (1997b) Forbes, D.A., Brodie, J.P., Huchra, J. 1997, AJ, 113, 887
- Forte et al. (1982) Forte, J.C., Martinez, R.E., Muzzio, J.C. 1982, AJ, 87, 1465
- Forte et al. (2001) Forte, J.C., Geisler, D., Ostrov, P.G., Piatti, A.E., Gieren, W. 2001, AJ, 121, 1992
- Forte et al. (2005) Forte J. C., Faifer, F., Geisler D. 2005, MNRAS, 357, 56
- Geisler (1996) Geisler, D. 1996, AJ, 111, 480
- Hanes et al. (2001) Hanes, D. A., Côté, P., Bridges, T.J. et al. 2001, ApJ, 559, 812
- Harris & Harris (2002) Harris, W.E., Harris, G.L.H. 2002, AJ, 123, 3108
- Harris & van den Bergh (1981) Harris, W.E., van den Bergh, S. 1981, AJ, 86, 1627
- Harris et al. (2005) Harris, W.E., Whitmore, B.C., Karakla, D. et al. 2005, ApJ, submitted (astro-ph/0508195)
- McLaughlin et al. (1995) McLaughlin, D. E., Secker, J., Harris, W. E., Geisler, D. 1995, AJ, 109, 1033
- Muzzio (1987) Muzzio, J. C. 1987, PASP, 99, 245
- Navarro et al. (1997) Navarro, J. F., Frenk, C. S., White, S. D. M. 1997, ApJ, 490, 493
- Ostrov et al. (1998) Ostrov, P.G., Forte, J.C., Geisler, D. 1998, AJ, 116, 2854
- Richtler et al. (2004) Richtler, T., Dirsch, B., Gebhardt, K. et al. 2004, AJ, 127, 2094
- Rhode & Zepf (2001) Rhode, K. L., Zepf, S. E. 2001, AJ, 121, 210
- Schuberth et al. (2004) Schuberth, Y., Richtler, T., Dirsch, B. et al. 2004, in Dettmar, R., Klein, U., Salucci, P., eds, Proc. “Baryons in Dark Matter Halos”, SISSA, Proceedings of Science, http://pos.sissa.it, p. 65
- Strader et al. (2005) Strader, J., Brodie, J.P., Spitler, L., Beasley, M.A. 2005, AJ, submitted (astro-ph/0508001)