Deep Impact : High Resolution Optical Spectroscopy
with the ESO VLT and the Keck 1 telescope
Abstract
We report on observations of comet 9P/Tempel 1 carried out before, during, and after the NASA DEEP IMPACT event (UT July 4), with the optical spectrometers UVES and HIRES mounted on the telescopes Kueyen of the ESO VLT (Chile) and Keck 1 on Mauna Kea (Hawaii), respectively. A total observing time of about 60 hours, distributed over 15 nights around the impact date, allowed us (i) to find a periodic variation of 1.709 0.009 day in the CN and NH flux, explained by the presence of two major active regions; (ii) to derive a lifetime 5 x 10⁴ s for the parent of the CN radical from a simple modeling of the CN light curve after the impact; (iii) to follow the gas and dust spatial profiles evolution during the 4 hours following the impact and derive the projected velocities (400 m/s and 150 m/s respectively); (iv) to show that the material released by the impact has the same carbon and nitrogen isotopic composition as the surface material (12C/13C = and 14N/15N = ).
1 OBSERVATIONS
High-resolution spectra of comet Tempel 1, the target of the NASA DEEP IMPACT (DI) mission, have been collected with the UV-Visual Echelle Spectrograph (UVES), of the ESO VLT in early June (UT 2, 7 and 8) and during a 10 night run around the DI event (UT July 2-11). The nights were photometric or clear and the seeing excellent to good (0.4”-1.1”). Two long exposures (of 7200s) have been secured each night using two different beam splitters, a combination which allowed us to obtain on each observing date a spectrum covering the full optical range (304-1040nm, except for a few narrow gaps). Both settings were chosen in order to include the CN (0-0) Violet band near 388 nm. The narrow slit of the spectrograph (0.44” x 10” or 288 km x 6540 km on July 4) provides a resolving power 83,000 and was generally put on the center of light of the comet (and in a few cases at about 1.0” from it). The position angle of the slit was along or perpendicular to the Sun-comet vector most of the time and an atmospheric dispersion corrector (ADC) was used to sample the same region during a given exposure.
On July 4, the comet was setting at Paranal Observatory at the exact time of the DI event UT 05:52 (A’Hearn et al., 2005). The acquisition of the last UVES spectrum ended at UT 02:59 which was just a couple of hours before the impact, i.e., before the first spectrum obtained with HIRES, the High Resolution Echelle Spectrometer of the Keck 1 telescope installed on Mauna Kea (Hawaii). The comet was visible again from Paranal 17 hours later. The data sets are complementary: the UVES one nicely describes the pre- and post- impact behaviour of the comet, while HIRES data contain unique information about the direct consequences of the impact (up to 4 hours later).
The spectra have been reduced with special emphasis on the orders showing the CN band at 388 nm. We used the echelle package of the IRAF software (NOAO) to calibrate and extract the spectra. The dust-reflected sunlight underlying the cometary emissions was removed by subtracting a solar reference spectrum (the Moon, in this case) after the appropriate Doppler shift, profile fitting and normalization were applied.
2 CN PERIODIC VARIATIONS
The relative flux in the CN band - between 386.2 and 387.5 nm and integrated over the full slit area - was calculated for the 13 nights of UVES observations.
The goal of the flux measurements was first to evaluate the variations triggered by the impact. But obvious flux variations of up to 30% were visible from night to night. A period search analysis has been performed using Fourier series fits and other methods like the Renson algorithm (Renson, 1978) better suited for anharmonic light curves. It yielded a period of 1.709 0.009 day (40.86 0.05 hrs) in very good agreement with the 1.701 0.014 day rotation period determined from the DI spacecraft nucleus lightcurve (A’Hearn et al., 2005).
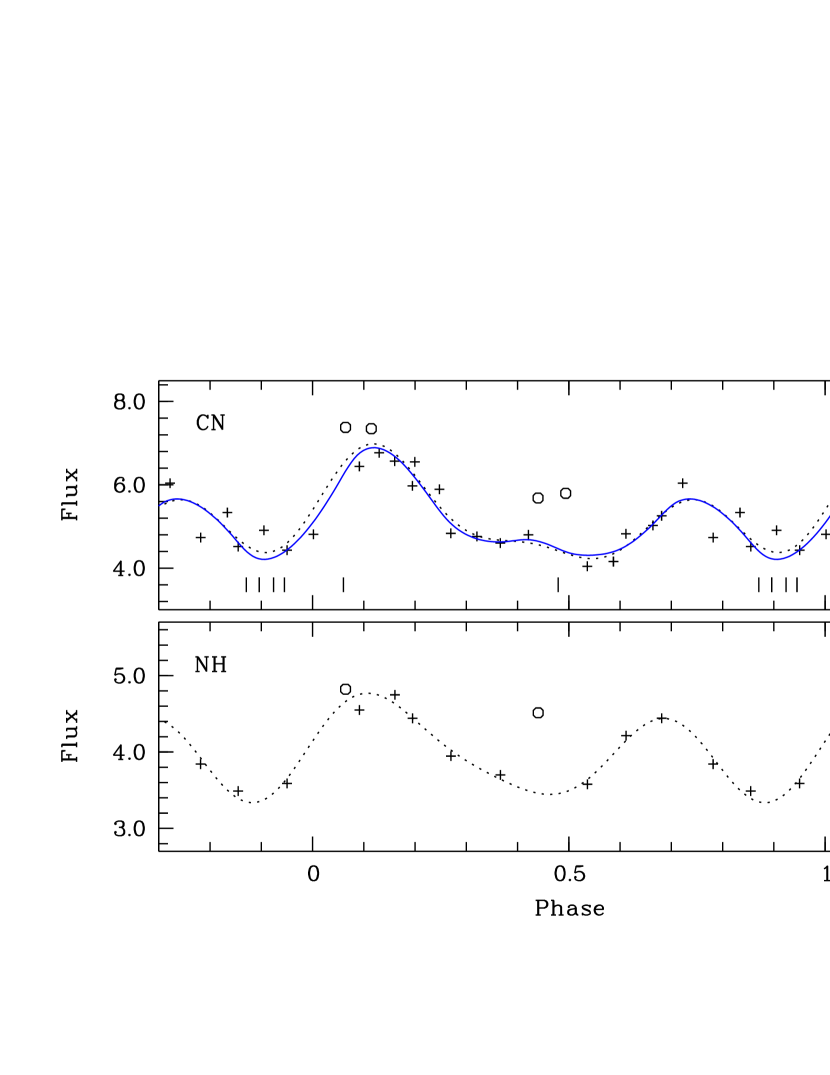
The phase diagram of the CN flux using this period is shown in Fig.1. The flux modulation is obviously synchronized with the rotation period and was stable over more than one month. The only deviating points are those corresponding to the first four post-impact measurements obtained on UT July 04 and 05 (phases around 0.45 and 0.1). There is no evidence of strong sporadic activity in the data. None of the 13 UVES observing dates corresponds to the outbursts detected by the DI spacecraft or the ground based observatories. After removing the periodic background, the light curve shows a net flux excess of about 20% and 7% respectively, 17 and 41 hours after the impact, indicating that the gas released by the ejected material had not yet completely vanished. After July 7.0 (and up to July 12.0), no excess could be detected at all in the region studied.
The shape of the CN phase diagram may be explained by the periodic passage of two major active regions, as well as a weaker one, into sunlight. Such an interpretation was also used to explain the comet Halley photometric observations during its 1985/1986 apparition (Schleicher et al., 1990). The brightest feature starts to produce gas around phase 0.9 (its minimum) and reaches its maximum (when the source stops its production) at phase 0.1. The second region is 20% less active and lasts also for about 8 hours (from phase 0.6 to 0.8). They could both be located at the same latitude (they see the Sun during the same amount of time), the difference in activity resulting from a different size or sunlight illumination of the active regions due for instance to different land morphology. The distance between the two features is a bit more than 1/3 of the rotation. The shoulder at phase 0.4 could be some evidence for the presence of a third and much fainter source.
The impact occurred at the beginning of the strongest periodic brightening (Fig.1). It is then possible that this active region is visible close to the terminator in the images sent by the impactor. As already noted by A’Hearn et al. (2005), a possible candidate is the large and smooth area (labeled “a”) in their Fig.1 and the scarp to the north of this feature would be an excellent candidate for a more localised, fast reacting region (the large smooth area being a kind of reservoir).
It is highly significant to note that almost all outbursts observed by the DI spacecraft (we have a precise knowledge of their onset time (A’Hearn et al., 2005)) correspond to minima in our gas phase diagrams (see Fig.1). Moreover 4 of the 6 outbursts are located just before the strongest brightening (phases from 0.85 to 0.95). Thus, the outbursts seem clearly associated with the active regions we found (they occur at the same phases) and would be occasionally triggered when one of these regions comes into daylight. The outbursts could just be a particularly strong phase of outgassing from the same region.
The flux in the NH 0-0 (A-X) band at 336 nm shows a nice correlation with the CN variations and any phase shift must be small, at most a couple of hours (Fig.1). The first post-impact measurement has an excess of 30%, i.e., significantly more than CN, but, contrary to CN, the second one is not enhanced (or only slightly), which means that NH disapeared sooner after the impact. Many more species are available in our spectra (OH, C3, C2, NH2, etc.) and will be examined in the same way. This may provide interesting information on their respective parent lifetimes. For instance, the NH parent seems to have a similar lifetime to the CN parent lifetime because the phase-shift between the two species is very small. With a lifetime in the range 2-6 104 s (Wyckoff et al., 1988; Fink et al., 1991) for NH2, similar to that of the CN parent (2-5 104 s, Fray et al. (2005) and references therein), this observation is indeed in agreement with NH2 being the main NH parent (Fink et al., 1991).
Data on HCN - a possible parent candidate of CN - have been obtained with the IRAM 30-m radio telescope from May 4.8 to 9.0 and show a 1.670.07 day periodicity (Biver et al., 2005). The beam used sampled similar regions to UVES (10”). The data have been phased with the 1.709 day period and superposed with the UVES CN flux measurements. There are only five HCN measurements, with large errors, so it is not possible to verify if the differences we see in shape and phase with our CN lightcurve are real. If this is the case, this could be some additional evidence that HCN is not the only parent of CN (Fray et al., 2005; Manfroid et al., 2005).
3 CN AND DUST IMPACT LIGHTCURVES
Three pre-impact spectra were obtained on May 30 with the HIRES spectrograph at the Keck 1 telescope and a series of 14 relatively short exposures (10 to 30 minutes), with one right before the impact, were taken on the DI night111Those data are publicly available at http://msc.caltech.edu/deepimpact/. The 0.86” by 7” slit provides a resolving power 48,000 and samples a comparable zone (563 km x 4578 km) to that of UVES. The slit was always centered on the nucleus and aligned along the parallactic angle. The weather was photometric on July 4 and the seeing excellent (0.6”).
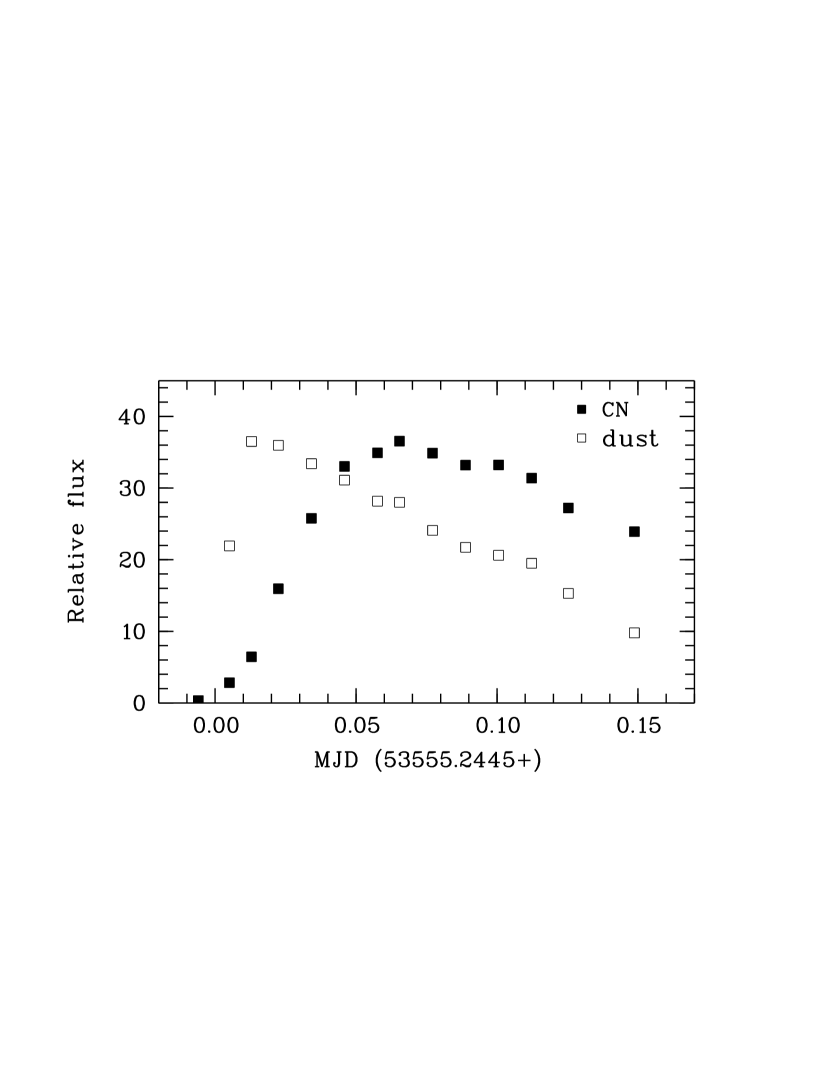
The total CN flux in the slit has been calculated and normalized to the UVES fluxes by comparing the first, pre-impact spectrum of July 4, as well as the three May spectra with our derived lightcurve. The HIRES slit was 2x wider than the UVES one and always centered on the nucleus, leading to better measurement of the dust component. The consequences of the impact are readily seen in Fig.2, both in the dust and CN flux. The CN periodic variation has been removed using the UVES lightcurve and the dust background has been taken out using the pre-impact spectrum.
The total CN flux reaches its maximum at UT 07:28 ( 10min) or 5760 600 seconds after the impact. It is enhanced by a factor of 2.8 compared with the pre-impact situation. The decline is explained (at least partially) by the molecules starting to leave the slit area, mostly through the slit length (the lifetime of the CN parent is indeed long enough (Rauer et al., 2003) to make the escape from the slit width unnoticed). The average projected speed of CN to cross the half slit is then 0.40 0.04 km/s. This is smaller than typical molecular outflow velocities in cometary comae (Combi et al., 2005) but it is only a lower limit due to the projection effect. The CN peak intensity of the spatial profiles is reached well before the total CN flux maximum, at about UT 06:30 ( 10min).
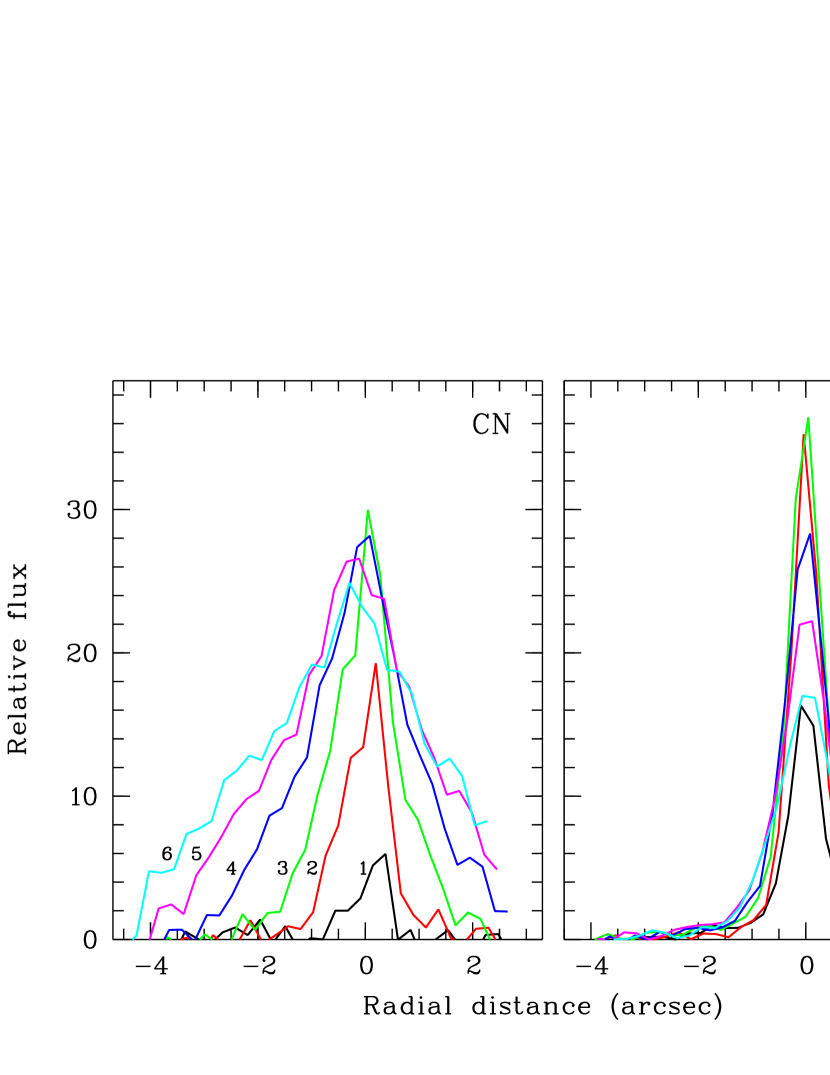
The CN light curve contains valuable information about the dissociation lifetime of its parent molecule but a complete modeling is beyond the scope of this paper. To first approximation, the CN impact light curve may be interpreted by assuming a competition between the CN creation resulting from the dissociation of a parent molecule ( where is the parent lifetime) and the exit from the slit area ( after filling the slit width and after filling the slit length). A precise determination of the parent lifetime from our data would require a good knowledge of the CN velocity distribution. The radial profiles (Fig.3) indicate a range of projected velocities from 250 to 650 m/s, in good agreement with the mean velocity of 400 m/s deduced from the light curve. Adopting 400 m/s, the slow decline of the light curve indicates that CN creation still occurs after filling the slit area, requiring relatively long parent lifetimes in agreement with those determined using the Rosetta spacecraft data ( 50000 s) (Keller et al., 2005).
The excess of the CN flux observed with UVES until two days after the impact indicates that the decline might have occured in two phases, a fast one documented by HIRES, and a slow one lasting over more than a full rotation of the comet. A linear extrapolation of the flux decrease observed by HIRES after the impact shows that the extra CN should have been gone from the studied area about 8 hours after the impact. The excess measured in UVES data could be explained by remnant activity of the crater or the presence of another minor CN parent with a longer lifetime. Unfortunately, data are missing to describe the lightcurve between MJD 53555.4 and 53556.0.
Taking the observed time evolution of the CN excess during the impact as the response of the comet to an elementary event, we tried to model the out-of-impact CN lightcurve as the response to a series of such elementary pulses. The observations can be accurately reproduced with just three bursts (or jets, corresponding to the observed bumps) (see Fig.1). These are simulated by convolving the elementary response with a simple temporal variation representing the instantaneous production of each source. There is no room for a “background” CN flux, i.e., all CN is produced by these periodic jets starting to release gas at phases 0.25, 0.45 and 0.85 (intensity of, respectively, 0.2, 0.7 and 1.0). The full width at half maximum duration of the bursts is 8 hours assuming a quasi-symmetrical triangular shape to the intensity of the jets. This behaviour equally explains NH and presumably all gases.
The variations of the dust after the impact are much faster, with a very steep brightening. The maximum is already reached at about UT 06:18 10 min, the dust being at that time enhanced by a factor 8.5 with respect to the pre-impact spectrum. Contrary to CN, the intensity peak in the dust profiles is reached at about the same time as the spatially integrated flux. The decline of the dust emission may also be interpreted by the escape of dust from the slit. This would give a projected dust velocity of 0.18 0.05 km/s, as, in this case, the escape from the slit width will be the dominant factor. However the slow and quasi linear decline would require a rather broad range of velocities – slower than the gas component (Fig.3) – and/or complex processes like destruction of highly reflective icy grains by sunlight. The radial profiles show that the dust is expanding at a much slower pace than CN, at about 0.13 0.03 km/s during the first 1.5 hour after the impact. This is consistent with the value given above and what others have measured (Keller et al., 2005; Sugita et al., 2005).
There is a slight but clear increasing shift of the position of the CN intensity peak in the radial profiles with respect to the dust (nucleus dominated) peak (Fig.3). The shift of 350 km (at 07:10 UT, and at a mean PA=215∘) is in the direction of the plume ejecta and is most certainly associated with it. It may indicate a preferential ejection direction for the gas with respect to the dust, the gas being emitted towards the Sun.
4 ISOTOPIC RATIOS
Measuring the isotopic ratios in 9P/Tempel 1 before and after the impact was a unique opportunity to check whether the material buried several meters below the surface and released by the impact is different or not from what we usually observe.
It was important to obtain a high quality pre-impact spectrum in order to compare it with post-impact data. This was achieved with UVES thanks to the 10 hours obtained in June and the 8 hours during the two pre-impact nights. The individual CN (0-0) Violet band spectra were combined after extraction with an optimal weighting scheme in order to maximize the overall signal-to-noise ratio. Synthetic spectra of the different CN isotopes were computed for each observing circumstance following the scheme described by Zucconi and Festou (Zucconi & Festou, 1985). The isotope mixture was then adjusted to best fit the observed final spectrum (Arpigny et al., 2003; Jehin et al., 2004). The same was done for the UVES post-impact data, and as no difference was found (which is not too surprising as those spectra were only slightly affected by the impact (Fig.1)), all the spectra were combined to produce a single 50 hours spectrum. The best fit is obtained for an isotopic mixture 12C/13C and 14N/15N.
From the HIRES impact lightcurve (Fig.2) we extracted the spectra showing a brightening of more than a factor two (the 10 spectra from 06:33 to 09:11 UT). Thus in those spectra half the CN flux might come from the fresh material released by the impactor. Despite the shorter exposure time (about 4 hours of total exposure time) and the lower resolving power of the HIRES spectrum compared to the UVES out of impact spectrum, the large collecting area of the Keck 1 telescope and the relative brightening of the comet allowed us to determine the following values 12C/13C and 14N/15N for the carbon and nitrogen isotopic ratios. Those values are compatible with the values determined out of impact. It appears that the 14N/15N ratio of the burried material is still most probably below the solar value (Arpigny et al., 2003).
After comet 88P/Howell, comet 9P/Tempel 1 is the second Jupiter-family comet to have a 14N/15N ratio determination. Both values are in excellent agreement and are similar to the ratios measured in half a dozen Oort-cloud comets (Hutsemékers et al., 2005). The fact that the ejected material - supposed to be pristine as it was never exposed to the solar radiation and cosmic rays - has the same isotopic composition, favors an isotopic homogeneity between the two populations of comets, despite the fact that they are expected to have formed at very different locations in the solar system (Weissman, 1999). This is a strong argument in favor of a primordial origin of the high content of 15N in cometary volatiles. This peculiarity is not the result of some alteration process of the comet’s surface material and was already present in the protosolar nebula before the accretion process, which gave birth to the comets and planets, took place. In case the N isotopic ratio changes within the solar nebula, this is a new argument in favor of the volatile ices in Jupiter-family and Oort-cloud comets originating in a common region of the protoplanetary disk (Mumma et al., 2005).
References
- A’Hearn et al. (2005) A’Hearn, M. F., et al. 2005, Science, 310, 258
- Arpigny et al. (2003) Arpigny, C., Jehin, E., Manfroid, J., Hutsemékers, D., Schulz, R., Stüwe, J.A., Zucconi, J.-M., & Ilyin, I. 2003, Science, 301, 1522
- Combi et al. (2005) Combi, M. R., Harris, W. M., & Smyth, W. H. in Comets II, M. C. Festou, H. U. Keller, H. A. Weaver, Eds. (The University of Arizona Press, Tucson, 2005), pp.523-552.
- Biver et al. (2005) Biver, N., Bockelée-Morvan, D., Colom, P., Crovisier, J., Lecacheux, A., & Paubert, G. 2005, IAUC, 8538
- Fink et al. (1991) Fink, U., Combi, M.R., & DiSanti, M.A. 1991, ApJ, 383, 356
- Fray et al. (2005) Fray, N., Bénilan, Y., Cottin, H., Gazeau, M.-C., & Crovisier, J. 2005, Planet. Sp. Sci., 53, 1243
- Hutsemékers et al. (2005) Hutsemékers, D., Manfroid, J., Jehin, E., Arpigny, C., Cochran, A., Schulz, R., Stüwe, J. A., & Zucconi, J.-M. 2005, A&A, 440, L21
- Jehin et al. (2004) Jehin, E., et al. 2004, ApJ, 613, L161
- Keller et al. (2005) Keller, H., et al. 2005, Science, 310, 281
- Manfroid et al. (2005) Manfroid, J., Jehin, E., Hutsemékers, D., Cochran, A., Zucconi, J.-M., Arpigny, C., Schulz, R., & Stüwe, J. A. 2005, A&A, 432, L5
- Mumma et al. (2005) Mumma, M. J., et al. 2005, Science, 310, 270
- Renson (1978) Renson, P. 1978, A&A, 63, 125
- Schleicher et al. (1990) Schleicher, D. G., et al. 1990, AJ, 100, 896
- Sugita et al. (2005) Sugita, S., et al. 2005, Science, 310, 274
- Rauer et al. (2003) Rauer, H., et al. 2003, A&A, 397, 1109
- Weissman (1999) Weissman, P. R. 1999, Space Sci. Rev., 90, 301
- Wyckoff et al. (1988) Wyckoff, S., Tegler, S., Wehinger, P.A., Spinrad, H., & Belton, M.J.S., 1988, ApJ, 325, 927
- Zucconi & Festou (1985) Zucconi, J.M., & Festou, M.C. 1985, A&A, 150, 180