Nearby AGN and their hosts in the near infrared††thanks: Based on observations with the Very Large Telescope of the European Southern Observatory on Paranal, Chile; proposal number 71.B-0062
We present near infrared ISAAC VLT observations of nine nearby (0.01z0.06) Active Galactic Nuclei selected from the Hamburg/ESO Survey and the Véron-Cetty & Véron catalog. Hydrogen recombination lines Pa and Br are observed in seven of the nine sources of which five show a broad component. In three sources, extended 1-0S(1) rotational-vibrational molecular hydrogen emission is detected. Stellar CO absorption is seen in four sources. In one of these objects, an upper limit of the central mass can be determined from the stellar velocity field. - and -band imaging allow us to determine the morphology class of the host galaxies. Colors (with supplementary -band 2MASS images) show that the four galaxies with detected CO absorption are characterized by an overall strong stellar contribution. One galaxy shows an increased extinction towards the nucleus. After removal of the nuclear point source, the host galaxies show colors typical for non-active spiral galaxies.
Key Words.:
galaxies: active – galaxies: nuclei – galaxies: Seyfert – infrared: galaxies1 Introduction
Measuring physical properties of host galaxies of Active Galactic Nuclei (AGN) is mandatory to understand the extreme activity in AGN. Host galaxy properties are under study for some time now. E.g. Jahnke et al. (2004) analyzed mulitcolor data (, ) of 19 low redshift quasar hosts. They found that the disc dominated host galaxies show colors similar to average colours of inactive galaxies of the same type, whereas bulge dominated host galaxies appear significantly bluer in () than their inactive counterparts and similar blue as the disc dominated hosts, suggesting a connection between galaxy interaction, induced star formation and the triggering of nuclear activity. Reunanen et al. (2002) present NIR-spectroscopy of two Seyfert 1, three Seyfert 2 and one Seyfert 1.5 and show that in Seyfert 2 galaxies Fe II is generally stronger than Br or H2 lines, while apparently in Seyfert 1 galaxies Br is stronger. Rodríguez-Ardila et al. (2004) also studied H2 and Fe II line emission in a sample of 22 (mostly) Seyfert galaxies and concluded that these lines originate in different regions due to systematically different linewidths. They detected molecular Hydrogen in 90% of their sources, with the majority being excited by thermal excitation processes. They also find a correlation between H2/Br and Fe II/Pa which can be useful to distinguish emitting line objects by their level of nuclear activity.
In order to study host galaxy properties of QSOs, we created a sample selected from the Hamburg/ESO Survey (HES: e.g. Reimers et al. 1996; Wisotzki et al. 1996, 2000) and the Véron-Cetty & Véron Catalog (Véron-Cetty & Véron 2001) with a redshift of z0.060. This limit grants an observability of the prominent CO(2-0) stellar absorption feature in the -band. The sample based on these criteria contains 63 sources and represents some of the closest known QSOs for which detailed astrophysical studies (i.e. spatially resolved imaging and spectroscopy) of the host galaxies’ physical properties are still possible111In the following we call this sample the Cologne Nearby QSO Sample.. We already have successfully performed observations of most of the sources in the Cologne Nearby QSO Sample at mm and radio wavelengths with telescopes such as BIMA, SEST and the Plateau de Bure interferometer (Bertram et al. in prep., Krips et al. in prep.).
In this paper, we present the first near infrared (NIR) observations on 9 Seyfert 1 galaxies selected from this sample. A major advantage of observations in the NIR is that in this wavelength regime extinction is much smaller than in the visible (AAV, Rieke & Lebofsky (1985)). Low resolution (R=500) spectroscopy in the -band (2.2m) yields analysis of several diagnostic lines such as hydrogen recombination lines (Pa & Br) and rotational-vibrational molecular hydrogen lines. The stellar CO absorption bands (12CO(20)) allow analysis of dominating stellar spectral classes and of stellar dynamics. Moreover, - (1.25m) - (1.65m) and -band imaging provides information on extinction in the galaxy and on whether the nuclear or the stellar component dominates the galaxy’s radiation.
Section 2 of this paper describes the details of the performed NIR observations as well as the data reduction and calibration procedures for imaging and spectroscopy. In Sect. 3, general spectroscopic results and in Sect. 4 results of the photometry are presented. Sect. 5 gives a short discussion on the individual sources and is followed by a general summary and conclusion in Sect. 6.
2 Observation, reduction and calibration
9 AGN drawn from the Cologne Nearby QSO sample were observed in seeing limited mode with the Infrared Spectrometer and Array Camera (ISAAC) mounted to ANTU (UT1) at ESO’s Very Large Telescope (VLT) in Chile during April the 18th-20th 2003. ISAAC’s 10241024 pixel detector provides a pixel scale of 0.1484″/pixel with a field of view (FOV) of 152 152 arcsec2. Our data consist of - and -band imaging and -band low resolution long slit spectroscopy with a 1″ slit, resulting in a resolution of R==500.
The 9 observed sources are selected from the Cologne Nearby QSO Sample to comply to observational constraints; all targets are classified as Seyfert 1/narrow line Seyfert 1 galaxies.
Data reduction was carried out with IRAF & IDL using standard procedures. Throughout this paper we use =75 km sMpc-1 and a flat universe with =0.3, =0.
2.1 Imaging
| Source | Imaging | Spectroscopy | |||||
|---|---|---|---|---|---|---|---|
| -band | -band | -band | |||||
| Seeing | Seeing | Seeing | PA | ||||
| HE 0853-0126 | 7.2s | 1.0″ | 7.2s | 0.9″ | 3900s | 1.8″ | 34∘ |
| HE 1013-1947 | 7.2s | 1.0″ | 7.2s | 0.8″ | 2700s | 1.6″ | 2∘ |
| HE 1017-0305 | 8s | 1.0″ | 8s | 0.8″ | 2700s | 0.7″ | 108∘ |
| HE 1029-1831 | 8s | 0.9″ | 8s | 0.7″ | 2700s | 1.8″ | -1∘ |
| HE 1248-1356 | 12s | 1.7″ | 8s | 0.6″ | 2880s | 1.7″ | 103∘ |
| HE 1328-2508 | 8s | 0.6″ | 8s | 0.5″ | 2880s | 2.7″ | 40∘ |
| HE 1338-1423 | 8s | 0.5″ | 8s | 0.4″ | 2880s | 0.8″ | 162∘ (96∘) |
| HE 2211-3903 | 8s | 0.6″ | 8s | 0.6″ | 3840s | 0.8″ | 52∘ |
| VCV J204409.7… | 8s | 0.6″ | 8s | 0.7″ | 1440s | 2.6″ | 165.45∘ |
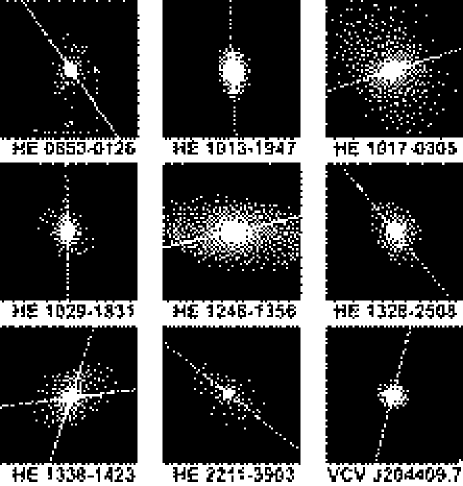
The main objective of the observing run was to obtain spectroscopic data, therefore only a small fraction of the observation time was assigned to imaging. The images of each object were taken using position jittering in an ABBA source pattern, integration times are shown in Tab. 1. The background was substracted from the individual frames by subtracting consecutive frames from each other. After shifting the resulting frames with respect to one reference frame, a median image was created. Since visual inspection of the flat fields showed that the ISAAC detector pixels do not add significant multiplicative signal variations to the images, no flat field was applied. The resulting images are shown in Fig. 1.
The images were flux calibrated using the data from the 2 Micron All Sky Survey (2MASS). With - and -band 2MASS-flux values for apertures with a diameter of 14″(see Tab. 2) zero points (ZP) were calculated for each object. The H-band 2MASS and ISAAC filter match perfectly. Compared to the ISAAC Ks-band filter, the 2MASS filter is slightly broader on the blue side. If the sources show a flat spectrum, the transfer into the 2MASS system does not result in any error. By the means of the slope of our K-band spectra, we estimate that the relative flux error through calibration does not exceed 3%. From the background noise, the fluxcalibration and taking into account that the images were not flatfielded, a conservative error-estimation for H- and K-band fluxes is 10%. In addition to our own ISAAC data we relied on -Band 2MASS images to generate a 2-color diagram. Due to high noise in these images, the error is estimated to 15%. Hence the errors for the extracted colors are and .
| Source | -band | -band | -band |
|---|---|---|---|
| HE 0853-0126 | 14.02 | 13.36 | 12.82 |
| HE 1013-1947 | 13.53 | 12.86 | 12.30 |
| HE 1017-0305 | 13.29 | 12.52 | 12.03 |
| HE 1029-1831 | 12.30 | 12.21 | 11.70 |
| HE 1248-1356 | 12.24 | 11.49 | 11.15 |
| HE 1328-2508 | 12.17 | 11.41 | 11.02 |
| HE 1338-1423 | 12.65 | 11.80 | 11.06 |
| HE 2211-3903 | 12.69 | 11.80 | 10.96 |
| VCV J204409.7… | 11.74 | 10.95 | 10.11 |
2.2 Spectroscopy
If the host galaxies showed prominent structures already in the acquisition images, an alignment of the slit along this structure was preferred. The slit angles are indicated in Fig. 1 and presented in Tab. 1, together with the integration times and the seeing conditions for the spectroscopy.
Similar to the imaging, the sky-subtraction was achieved with a nodding technique and no flatfielding was applied. The individual spectra were corrected for slit-curvature, shifting and creating a median then resulted in the final spectrum. Telluric correction was performed with B-type stars of which observations directly followed or preceded the observations of the targets. Hydrogen absorption lines in the telluric star’s spectrum were removed by fitting a Lorentz-profile to the line prior to the telluric correction. After division by the spectrum of the telluric standard, the galaxy’s spectrum was multiplied by a blackbody of temperature equal to the effective temperature of the star.
The spectra were wavelength calibrated using OH-lines from the sky. Flux-calibration was applied with the zero points calculated from the imaging.
In most of the observations, the seeing was much larger than the used slit width of 1″(see table 1). Hence, the contribution of the AGN to the spectra is diluted and overall the observed spectra will be more influenced by their host-galaxy properties. Any flux measurements along the slit depend on the seeing.
3 Spectroscopy
With the integration times given in Tab. 1, we achieved signal-to-noise ratios (S/N) on the continuum of 15-40 (the values represent the central spectrum with the highest signal).
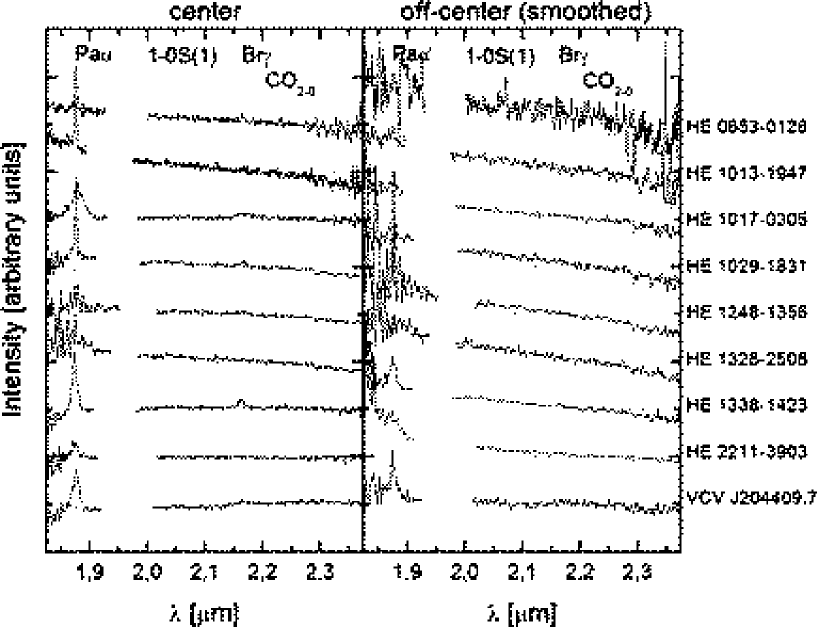
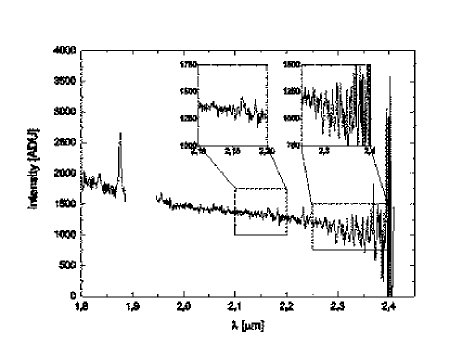
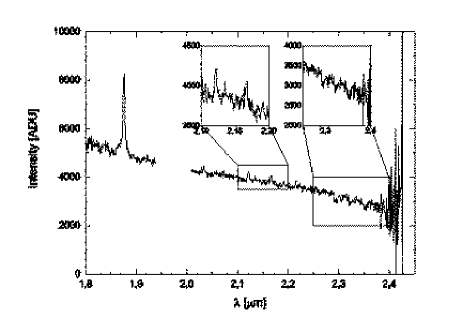
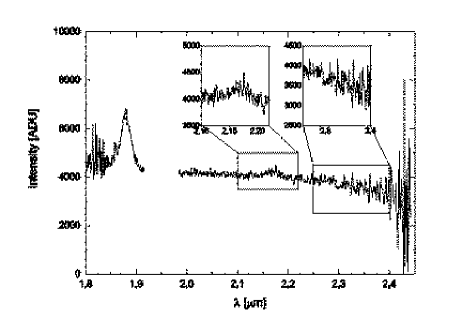
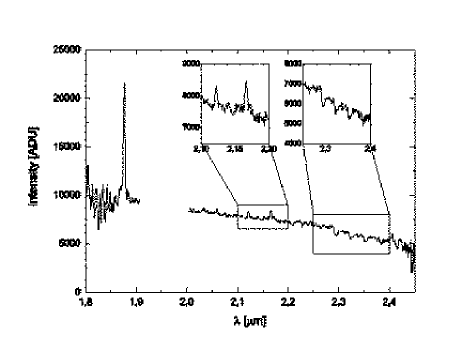
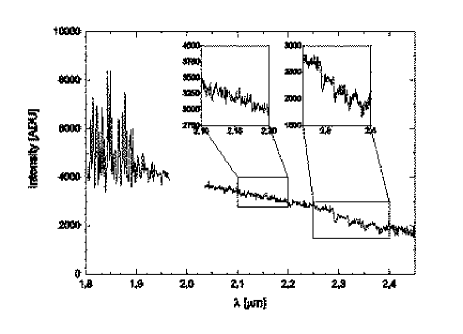
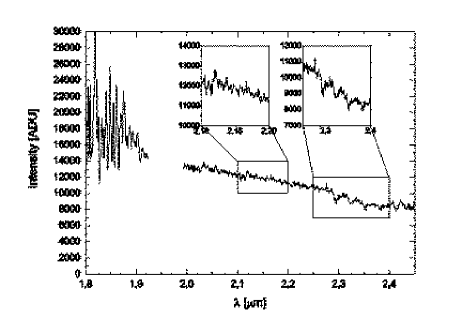
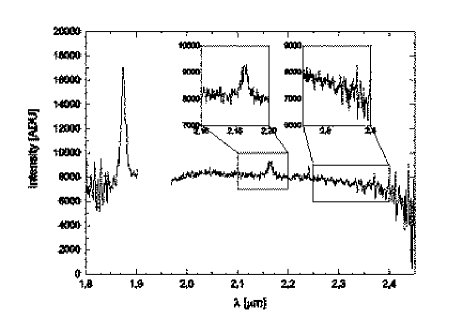
For a comparison between central and off-nuclear spectra, see Fig. 2. The spectra are integrated over apertures matching the FWHM of the seeing (see Tab. 1), centered on the nucleus (left) or at a distance of 1.5 times the seeing-FWHM (right). Because of low signal to noise in the off-nuclear regions, these spectra are smoothed with a 3-pixel boxcar. With respect to the continuum slope, most of the central spectra in Fig. 2 show a reddened continuum. The CO-detected galaxies appear bluer than the other galaxies (see section 3.3). However, this effect cannot clearly be seperated from the influences of the seeing (see section 2.2).
For details on the analyses of the individual galaxies, as well as spectra integrated over the whole galaxy (i.e. 3 times seeing-FWHM), see section 5.
3.1 Hydrogen recombination lines
| Source | Pa | FWHMbroad | FWHMnarrow | Br | AV |
|---|---|---|---|---|---|
| W m | km s | km s | W m | mag | |
| HE 0853-0126 | 3.3(3.6%) | 523(20%) | (4.0(16.3%)) | (0) | |
| HE 1013-1947 | 13.3(2.5%) | 3190(20%) | 437(20%) | 7.6(14.6%) | |
| HE 1017-0305 | 28.9(3.3%) | 3736(20%) | 42.7(5.1%) | ||
| HE 1029-1831 | 56.9(7.1%) | 2081(20%) | 92(40%) | 49.1(5.3%) | 3 |
| HE 1248-1356 | |||||
| HE 1328-2508 | |||||
| HE 1338-1423 | 63.6(3.5%) | 2249(20%) | 288(30%) | 82.7(5.0%) | |
| HE 2211-3903 | 54.0(8.0%) | (21.3(18.3%)) | |||
| VCV J204409.7… | 101.6(3.1%) | 2353(20%) | 101.3(5.0%) |
Prominent gaseous diagnostic lines are the hydrogen recombination lines Br (m) and Pa (m). Assuming case B recombination, typical electron densities of 10 and temperatures of 10000K (Osterbrock 1989), line ratios of Pa/Br are calculated to 12/1. We calculated the extinction with an extinction law that follows (Draine 1989) and using the screen model (e.g. Thronson et al. 1990), values are shown in Tab. 3.
Pa and Br both are detected in seven of the observed galaxies (see Tab. 3). The shape of these lines varies strongly, though. The strong Pa emission allows (with the exception of HE 0853-0126 and HE 2211-3903) a separation into a broad and a narrow component. However, the broad components of HE 1013-1947 and HE 1029-1831 could be influenced by an unresolved He line (1.868m), since the broad component is rather asymmetric towards the blue.
The broad components of HE 1013-1947 with a FWHM of 3190 km s 20% and HE 1017-0305 with a FWHM of 3740 km s20% show widths characteristic of ordinary Seyfert 1 galaxies. In the cases of HE 1029-1831, HE 1338-1423 and VCV(2001) J204409.7-104324, the broad components show widths around 2000 km s-1, typical for a narrow line Seyfert 1 galaxy (e.g. Rodríguez-Ardila et al. 2000b).
Only the integrated spectra supplied sufficient S/N to calculate extinction in the galaxies within reasonable errors. Case B approximation is only valid for the NLR, but in our Br lines, no separation between NLR and BLR is possible. Although Pa and Br are detected in most of the sources, only in HE 0853-0126 and HE 1029-1831, where the line emission is clearly dominated by the NLR, case B is a valid approximation and conclusions on the extinction can be drawn.
In the latter one, visual extinction is smaller than 3mag.
Because of their redshift, the Pa line in HE 1248-1356 and HE 1328-2508 is shifted into a region of low atmospheric transmission and high variability. This could explain why we did not detect this line in these sources.
3.2 Molecular hydrogen
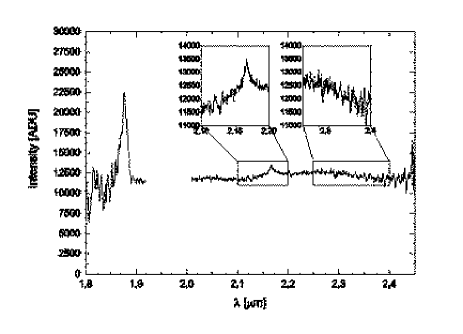
In three sources, HE 1013-1947, HE 1029-1831 and HE 1328-2508, extended molecular hydrogen is detected in the rotational-vibrational H2 emission line 1-0S(1) at 2.1218m (see Figs. 8,12,16). It is thought that molecular Hydrogen can be found in 70-80% of all Seyfert 1 galaxies, Rodríguez-Ardila et al. (2004) detected H2 in 90% of a sample of 22 AGN (19 Seyfert 1). Comparingly, with expected H2 (1-0)S(1)/Br line ratios between 0.6 and 2, our molecular Hydrogen detection rate appears lower. But due to the fact that only two of the five galaxies with Br show also a H2-line, the small sample-size has to be taken into account. With the mere detection of the 1-0S(1) emission line, we cannot distinguish between any excitation-mechanisms.
3.3 Stellar CO absorption
The 12 (m) absorption feature of red, evolved stars is by far the strongest absorption feature in the range of 1-3m (Gaffney, Lester & Doppmann 1995). The absorption is depending on the effective temperature of the star, but also on its luminosity class (Kleinmann & Hall 1986). Absorption rises towards lower temperatures and from dwarfs to supergiants.
After Doyon et al. (1994) and Goldader et al. (1995), the spectroscopic CO index, corresponding to the equivalent width (Origlia & Oliva 2000), can be used to determine the continuum-dominating stellar luminosity class. However, due to the possible contamination of the stellar light by non-thermal radiation, the calculated CO equivalent widths for the AGN in this paper are lower limit estimates for the intrinsic CO band strength. In our sample, CO absorption is detected in five AGN at a 2 level with respect to the continuum222The RMS is determined in the region from (2.00-2.29) m (restframe). (HE 1013-1947, HE 1017-0305, HE 1029-1831, HE 1248-1356 and HE 1328-2508). The EWs of the CO absorption are presented in table 4, together with additional upper limits for the remaining sources. With the exception of HE 1328-2508, all sources show the described effect that the equivalent width decreases towards the center (but to different extents). Therefore, it is difficult to draw conclusions on the underlying stellar composition (Origlia & Oliva 1993) since it is not clear whether the change in the CO absorption is caused by a rising non-stellar continuum and/or a change in spectral class. Assuming that the values deduced in the outer regions of the galaxy are rather free from non-stellar continuum, a depth of (6 3) Å as it can be found in HE 1029-1831 and HE 1328-2508 corresponds to the value expected for that of K0-3 giants (Kleinmann & Hall 1986). The comparatively deep CO-absorption in HE 1248-1356 with a width of (11 2) Å points to late K or early M giants. In starburst galaxies, deep CO absorption is linked to young red supergiants. A typical starburst galaxy such as M82 shows an equivalent width of (15 1) Å (Tamura et al. 1991) which is significantly deeper than found in HE 1013-1947, HE 1029-1831 and 1328-2508. Their values are consistent with those found in ordinary elliptical and spiral galaxies (Frogel et al. 1978). Therefore, the absorption in HE 1248-1356 can most likely be attributed to ongoing starformation in its host galaxy. A narrow EW of 3 Å as it can be found in the host of HE 1017-0305 is typical for G/K dwarfs (Kleinmann & Hall 1986). In HE 0853-0126, the absorption at wavelengths 2.25 m is probably caused by atmospheric noise. The line-shape does not resemble that of stellar CO-absorption.
| Source | Central EWCO | Off-nuclear CO EWCO |
|---|---|---|
| HE 0853-0126 | (7) | (3 1) |
| HE 1013-1947 | 4 2 | 7 4 |
| HE 1017-0305 | 1.2 0.2 | 3 1 |
| HE 1029-1831 | 5 2 | 6 3 |
| HE 1248-1356 | 4 1 | 11 2 |
| HE 1328-2508 | 6 2 | 6 3 |
| HE 1338-1423 | 1.3 | 4.9 |
| HE 2211-3903 | 1.2 | 1.5 |
| VCV J204409.7… | 2.8 | 1.8 |
The CO(2-0) bandhead is also a useful feature for investigations of the underlying stellar dynamics. The observed CO absorption in the galaxy is (in a rough approximation) the convolution of the star that dominates the CO absorption with the line-of-sight velocity profile (LOSVP), so the LOSVP can either be determined by basic deconvolution processes, or via comparison to a convolved spectrum of a star or a stellar population. For best results with our galaxy spectra of low resolution and S/N ratios, we fitted a stellar template spectrum, convolved with a Gaussian distribution (representing the LOSVP), to the galaxy spectrum (Gaffney, Lester & Doppmann 1995) with the Nelder-Mead downhill simplex algorithm. Note that in this procedure, the selection of the correct stellar template is essential since template-mismatch produces significantly too high velocity dispersions. The characteristic for the selection of the stellar spectrum is an according equivalent width of the CO(2-0) absorption bandhead to the galaxy’s spectrum (Gaffney, Lester & Telesco 1993). Hence our deduced velocity dispersion is an upper limit to the intrinsic velocity dispersion of the galaxy. For the analysis in this sample, we relied on spectra of K- and M- giants and supergiants in the -band from Hinkle & Wallace (2001) (native resolution of R=3000)333These sources can be found online in the SIMBAD database, which is operated at CDS, Strasbourg, France; url: http://simbad.u-strasbg.fr/Simbad.. Convolution with a Gaussian distribution result in K-band stellar template spectra at a resolution of R=500.
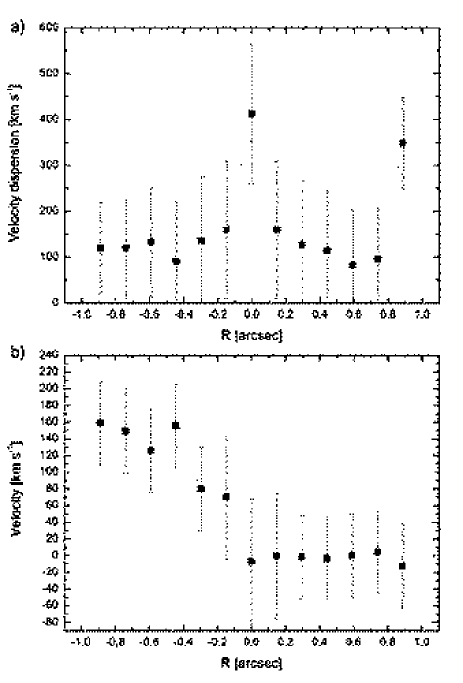
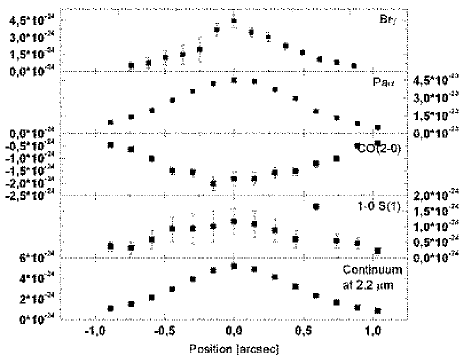
Among the sources with detected CO absorption, HE 1248-1356 is the only object in our sample where the stellar velocity field is resolved. Fig. 3a) and 3b) show the resulting velocity dispersion and stellar rotational curve of HE 1248-1356. The seeing during the observations of HE 1248-1356 was 1.7″ (see Tab. 1). The deduced velocity dispersion of =400 yields an enclosed virialmass of 2 M⊙ in the seeing disc (= 0.5 kpc), a typical value for Seyfert galaxies. However, this mass estimate has to be taken with caution because the seeing during observations was large and the shown data-points are strongly correlated. Depending on the exact shape of the rotation curve and the distribution of the velocity dispersion, is likely to increase under better seeing conditions (i.e. smaller R). Here clearly investigations under higher angular (and spectral) resolution are required.
4 Photometry
| Source | morphological | redshift | references |
|---|---|---|---|
| classification | |||
| HE 0853-0126 | SBb/c | 0.059903 | |
| HE 1013-1947 | SB | 0.055 | |
| HE 1017-0305 | interacting (S) | 0.0468 | |
| HE 1029-1831 | SBc | 0.040134 | |
| HE 1248-1356 | Sa/SBa | 0.014557 | |
| HE 1328-2508 | interacting (S) | 0.026485 | |
| HE 1338-1423 | SB | 0.041752 | |
| HE 2211-3903 | SB | 0.038473 | |
| VCV J204409.7… | E3 | 0.034373 |
ISAAC -band images of each source are presented in Fig. 1. The images clearly resolve structures of the underlying host galaxy like bars and spiral arms, even without a subtraction of the nucleus; for a morphologic classification of the individual host galaxies, see Tab. 5. The sample is mostly dominated by spiral galaxies. Since all our galaxies are lower luminosity AGN, this supports the theory that the propability to find disc dominated host galaxies increases towards lower luminosity nuclei (e.g. Jahnke et al. 2004, and references therein). For more details on the morphology, see Sect. 5.
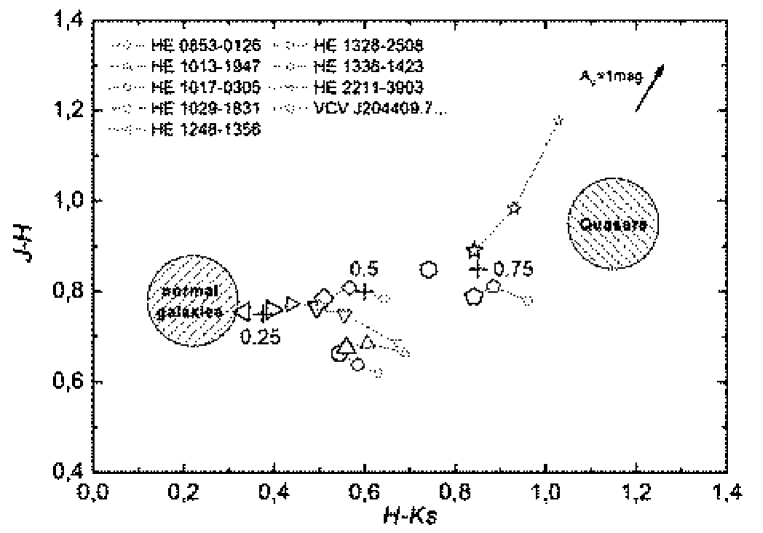
In combination with the J-band data from 2MASS we derived colors for each of the 9 AGN in apertures centered on the nucleus. In the NIR, colors of an active galaxy consist of several components: A stellar component, a Quasar-like component, an extinction-component and a component associated to hot dust. Hyland & Allen (1982) calculated mean colors of Quasars to and (corrected for redshift), while ordinary galaxies have colors of , (Glass 1984). Wavelength dependent extinction is expressed by a shift along the direction of a vector representing a visual extinction of (following (Rieke & Lebofsky 1985; Binney & Merrifield 1998)). Re-radiation of hot dust at temperatures of 300 K in the surroundings of the nucleus results in an increased flux especially in the K-band, so in the 2-color diagram this effect manifests itself in a horizontal shift in - (Glass 1984).
We measured the flux of each galaxy in apertures of three different sizes, always centered on the nucleus: One aperture size basically encloses the whole object (14″ diameter), one encloses only the nucleus (3″) and one intermediate size (8″) was chosen. A K-correction was not applied because at the reshifts of the sample its effect is contained in the photometric errorbars. To compare the ISAAC seeing limited images (resolution: (0.6-1)″) to the 2MASS -band images (resolution: (2.3-2.8)″) the ISAAC images were smoothed with a Gaussian distribution such that the - and -band images show resolutions corresponding to their respective -band images. The smallest used aperture measures 3″, according to the resolution limit of the 2MASS data. The resulting 2-color diagram is shown in Fig. 4. For HE 1338-1423 and HE 1248-1356444Due to unfortunate shifting in the observations of HE 1248-1356, no H-band image could be generated. Here we additionally relied on a 2MASS H-band image. only the color value extracted from the largest aperture is shown because the -band colors in smaller apertures do not provide physical results.
| Source | -band | -band | -band | |
|---|---|---|---|---|
| HE 0853-0126 | 14.451 | 13.813 | 13.228 | 0.31 |
| 15.721 | 15.102 | 14.470 | ||
| HE 1013-1947 | 13.838 | 13.153 | 12.547 | 0.51 |
| 15.005 | 14.342 | 13.653 | ||
| HE 1017-0305 | 13.690 | 12.941 | 12.386 | 0.55 |
| 15.002 | 14.315 | 13.646 | ||
| HE 1029-18311 | 13.232 | 12.422 | 11.856 | 0.31 |
| 14.337 | 13.551 | 12.909 | ||
| HE 1248-1356 | (12.765) | (12.853) | (11.601) | - |
| (14.132) | (14.588) | (12.856) | ||
| HE 1328-2508 | 12.551 | 11.778 | 11.341 | 0.28 |
| 13.865 | 13.094 | 12.591 | ||
| HE 1338-1423 | (12.950) | (12.189) | (11.364) | 0.48 |
| (14.120) | (13.588) | (12.671) | ||
| HE 2211-3903 | 12.998 | 12.016 | 11.086 | 0.34 |
| 14.220 | 13.041 | 12.012 | ||
| VCV J204409.7… | 11.908 | 11.097 | 10.212 | 1.20 |
| 12.934 | 12.154 | 11.193 |
As expected for Seyfert 1 galaxies (cf. Ward et al. 1982) the global colors of the 9 sources are located in between the regions of Quasar colors and colors of ordinary galaxies. They all are distributed along the line connecting the two extreme cases, thus indicating a varying importance of the Quasar component in each object. The colors of HE 2211-3903 and VCV(2001) J204409.7-104324 show that these galaxies are dominated by their non-stellar nucleus. A dominating stellar component in HE 1248-1356, HE 1328-2508, HE 1013-1947 and HE 1029-1831 could be connected with the detection of stellar CO absorption in the spectra of exactly these sources, because the strong contribution of the non-stellar nuclei in the other sources can prevent such detection. The continuum slopes of the K-band spectra demonstrate similar tendencies.
Rising influences of the nucleus are expressed in a shift of the color towards the region of Quasars with decreasing aperture size. This effect is superposed onto the effect of hot dust. All targets show increased nuclear radiation (in comparison to the stellar radiation) or reradiation of hot dust but no sigificant amounts of extinction towards the nucleus, with the exception of HE 2211-3903 with a visual extinction of . Especially, HE 1017-0305 does not stand out with extraordinary amounts of extinction as the spectroscopically determined AV would imply, but the photometric colors are averaged over larger apertures.
We also estimated H-K colors of the host galaxies by subtracting the contribution of the nucleus. Here we used the fact that the nucleus is unresolved, i.e. star like in extent. Hence the subtraction was performed by taking a star in the vicinity of the galaxy, shifting it to the center of the nucleus within sub-pixel accuracy and subtracting it scaled to the flux of the nucleus such that just no ”hole” is produced in the galaxy. Ideally, this results in a smooth brightness distribution representing the contribution of the host galaxy. The flux of the host was determined in a 14″aperture, values are shown in the last column of Tab. 6. The spiral galaxies show host-colors similar to or slightly redder than the colors of non-active spirals. The color of the elliptical galaxy VCV(2001) J204409.7-104324 is probably influenced by difficulties in removing the nucleus in the K-band. For HE 1248-1356 no host colors were calculated due to the lack of a high-resolution H-band image.
5 Notes on individual objects
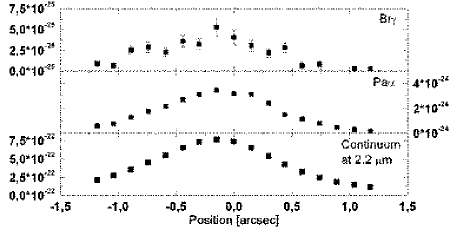
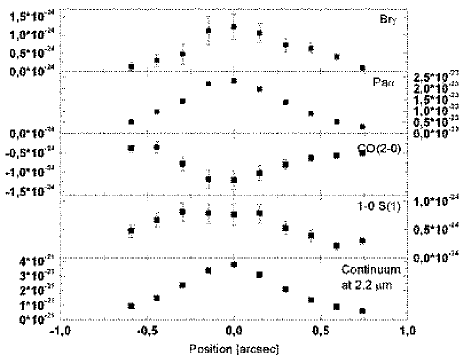
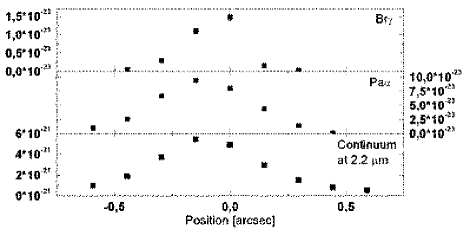
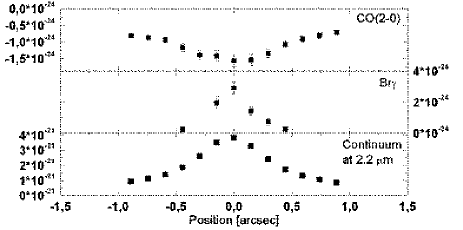
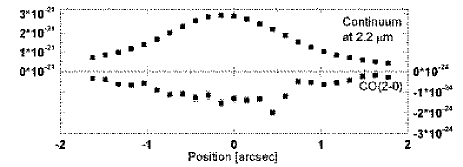
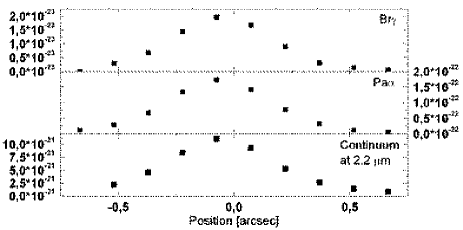
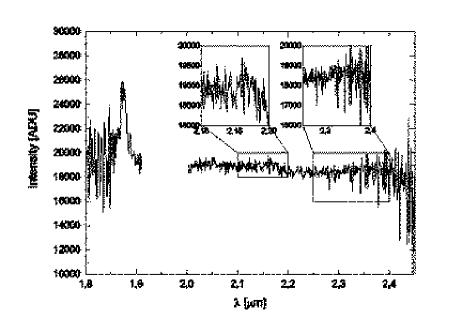
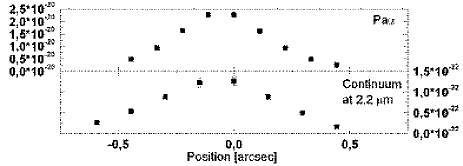
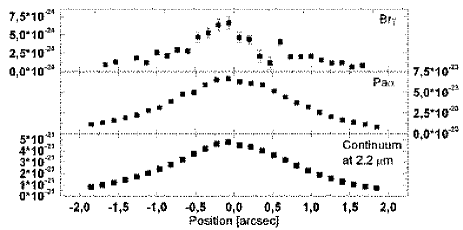
The spectra, integrated over 3 times the seeing-FWHM, the line fluxes and the flux of the continuum of the objects, extracted along the slit, are presented in Fig. 5-22. In addition, a short discussion of each galaxy is given. Note that in most cases, the seeing during the spectroscopic observations was larger than the slitwidth (c.f. section 2.2).
5.1 HE 0853-0126
HE 0853-0126 shows a prominent bar structure (the slit was not placed along this bar because the structure was too faint to be resolved during acquisition). Two spiral arms can be seen reaching symmetrically out to the east and the west. The view on the galaxy is rather face-on. The region of the CO absorption is redshifted to the long wavelength cutoff of the K-band. In the resulting high noise, no CO absorption can be detected. Hydrogen recombination is seen in Pa and Br, a broad component in the Pa line is not detected, the galaxy is classified as Seyfert 1 in Wisotzki et al. (2000). A weak broad component could either be hidden in the noise of the spectrum, or the AGN is variable. In the region of (2.0-2.2)m, the spectrum shows a S/N of 21 on the continuum. This causes high errors in the Br flux measurements and in the calculated visual extinction.
5.2 HE 1013-1947
The galaxy is a barred spiral galaxy and shows a very bright nucleus. Nagao et al. (2001) as well as Rodríguez-Ardila et al. (2000b) find HE 1013-1947 to be a narrow line Seyfert 1 galaxy with a broad component in H and H of about 1900 km s-1, which is narrower than the line width we extracted using Pa.s The difference between the optical and NIR-linewidths could be explained by extinction effects. The slight blueshift of the center of the broad component versus the center of the narrow component could indicate that an unresolved He line (1.838m) influences our measurement.
The integrated spectrum in Fig. 7 also shows CO absorption at wavelengths 2.29 m. In the central spectrum, the equivalent width of the absorption is (3.7 2.4) Å, rising to an equivalent width of (7.5 4) Å in the outer regions of the galaxy (see Tab. 4). The equivalent width at the center of the galaxy is diminished due to a larger contribution of the non-thermal continuum at the nucleus (the overall absorption in the transition rises towards the nucleus, as can be seen in Fig. 8). An equivalent width of 7 Å corresponds to the value found for that of K0-3 giants (Kleinmann & Hall 1986).
The galaxy also shows extended H2 emission in the (1-0)S(1) transition with a total flux of (7.4 1) W m-2, the line ratio to the Br line is calculated to 1.0 0.2. According to Rodríguez-Ardila et al. (2004), this ratio is a typical value for a Seyfert galaxy. Since this is the only detected molecular hydrogen line, excitation processes cannot be discussed.
5.3 HE 1017-0305
The radio quiet (Wadadekar 2004) galaxy shows a very prominent bar extending from east to west. Spiral arms are also resolved, but their shape is rather unsymmetric which implies a disturbance possibly caused by a recent merger event. At a distance of 42″ to the NW of the object, the galaxy LEDA 1072782 with a redshift of z=0.04925 (Falco et al. 1999) can be found which supports the idea of an ongoing merger event. In Fig. 2, the continuum slopes at the center and away from the nucleus change significantly, with the spectrum beeing much bluer towards larger distances from the nucleus. This is also represented by the calculated extinction of (16 19)mag, but the high noise on the broad Br line (see Fig. 9) produces large errors in the measurement of its flux. In the region between 2 m and 2.2 m, the S/N on the continuum is 40. The two broad hydrogen recombination lines make HE 1017-0305 a typical representative for a Seyfert 1 galaxy. In the 2-color diagram (Fig. 4), the galaxy shows no strong amounts of reddening (note that due to the 2MASS-limited resolution, the extinction is derived from a larger area).
The upper limits for the IRAS fluxes (IRAS Vol. II catalog) yield an upper limit for the far-infrared luminosity of LFIR=6.10, similar to the values found in starburst galaxies (Deutsch & Willner 1987).
There is an absorption feature detected at 2.3 m, but its shape does not resemble a CO absorption band. Moreover the CO(3-1) and CO(4-2) absorption features are missing. Probably high noise in this region hides the absorption.
5.4 HE 1029-1831
The spiral arms and the bar structure are prominent features in the images, implying a face on view onto the galaxy. The flux ratios NII/H and OIII/H indicate that HE 1029-1831 is an AGN. Using flux ratios of SII6717.31/H and OIII5007/H, the galaxy is classified as HII/borderline galaxy, while the flux ratios of OI6300/H OIII5007/H lead to a classification as AGN/borderline galaxy Kewley et al. (2001). In our spectrum, the Pa line can be separated into a broad and a narrow component with the broad component showing a width of 2081 km s-1 which is typical for a narrow line Seyfert 1 galaxy. This is consistent with the findings of Nagao et al. (2001) and Rodríguez-Ardila et al. (2000b) who determined the FWHM of H to be 1870 km s-1 and classified the object as a narrow line Seyfert 1 galaxy, too. As in HE 1013-1947, the broad component’s shape looks slightly asymmetric what could be caused by an unresolved helium-line. The Pa/Br line ratio implies no significant reddening, which is consistent with the appearance of the continuum in Fig. 2 as well as with the results of the photometry (see Fig. 4).
The equivalent width of the CO absorption feature decreases from (6 3) Å at distances of 1″ away from the nucleus to (4 2) Å at the center. The small variations of the eqivalent width also substantiate only minor amounts of reddening. An equivalent width of 6 corresponds to equivalent widths found in early K0-3 giants (Kleinmann & Hall 1986).
HE 1029-1831 also shows extended emission in the H2 1-0S(1) transition with a total flux of (13.9 1.4) W m-2 (see Fig. 12). The H2 1-0(S(1)/Br line ratio is calculated as 0.29 0.03. After Rodríguez-Ardila et al. (2004), a line ratio of 0.3 marks the transition from starburst galaxies to Seyferts, hence HE 1029-1831 shows only a comparatively small amount of activity for a Seyfert galaxy. In the 2-color diagram, the galaxy is located close to that of ordinary galaxies, revealing only small influences of the nucleus, too.
HE 1029-1831 is also an IRAS source with F12μm = (139 39) mJy, F25μm = (411 40) mJy, F60μm = (2545 15) mJy and F100μm= (3704 333) mJy. This results in a far-infrared luminosity of LFIR=1.9 .1011L⊙.
In summary, HE 1029-1831 probably is a luminous infrared galaxy with a weak narrow line AGN.
5.5 HE 1248-1356
This galaxy is the closest one of the observed sources. It shows very prominent spiral arms at the west and east, the galaxy is inclined (i=636) and the velocity curve calculated from the bandhead (Fig. 3b ) implies that the eastern arm is moving towards the observer. Rodríguez-Ardila et al. (2000b) as well as Maia et al. (2003) classified the object as a broad line Seyfert 1 galaxy. We do only detect a very faint but broad Br line (Fig. 14), though a weak Pa line could be hidden in the noise produced by atmospheric absorption (see Fig. 13). The CO absorption bands are very prominent features. The value of the CO-equivalent width at a distance of 1″ to the center is close to values typical for ongoing starformation. The depth decreases strongly towards the center, what indicates rising non-stellar continuum emission (Fig. 14). However, the slope of the continuum remains rather unaffected by this trend, the nuclear spectrum is already rather blue compared to the other observed sources.
5.6 HE 1328-2508
The galaxy shows strong signs of interaction, an indication of a tidal tail can be seen, extending towards NE. The bright nucleus is not located at the center of the galaxy, the source at a distance of 3″SE of the nucleus is either a foreground star or a second nucleus. We tried to subtract a point like source from this possible second nucleus with the same process as for the other nuclei. The contribution could not completely be removed here, which supports the theory of a real second nucleus (or at least an extended object along the line of sight). At 7″in the same direction, an additional source is located. This could be attributed to either a possible companion galaxy or a foreground star (cf. Jahnke et al. 2003). No Hydrogen recombination lines are observed and the spectrum shows stellar CO absorption. In HE 1328-2508, however, the equivalent width of the CO(2-0) bandhead does not change with distance to the center as dramatically as it is observed in the other sources. In addition, the continuum slope shows no strong dependency on distance to the center. This could indicate only a small non-stellar contribution and is consistent with the location in the 2-color diagram near to the location of ordinary galaxies. The spectrum also shows molecular Hydrogen in emission at 2.122m. Absorption makes the X-ray emission rather hard, its ROSAT hardness ratio (HR1) is determined to 0.63 0.03 (Fischer et al. 1998).
5.7 HE 1338-1423
The ISAAC images resolve a clear bar structure and the host galaxy hence is classified as SB0 galaxy. Bade et al. (1995) derived a spectral power-law index from the RASS of 1.410.29. In comparison to the continuum, HE 1338-1423 shows very strong recombination lines. The equivalent widths are (2184.4)Å for Pa and (18.10.1)Å for Br. The non-detection of CO-absorption, the strong change in continuum slope towards the center and the location in the 2-color diagram close to quasars all indicate to a strong non-stellar component. Our detected host galaxy colors are well in agreement with the results of Jahnke et al. (2004), who derived optical magnitudes of =15.1, =14.5, =14.0 and =13.4.
5.8 HE 2211-3903
The galaxy shows a bar extending from NE to SW and very faint indications of two spiral arms.
Despite a high S/N ratio of 45, the only feature resolved in the spectra is the Pa line which shows a highly non-gaussian shape, implying complicated kinematics in this galaxy. Continuum slope changes are similar as in HE 1338-1423. Maia et al. (2003) classified HE 2211-3903 as a Seyfert 1 galaxy via a broad H line.
The upper limits for the IRAS fluxes in the IRAS Vol. II catalog (F60 is 0.77 Jy, F100 is an upper limit of 1.08 Jy) yield an upper limit for the far infrared luminosity of LFIR=5.2.10, similar to HE 1017-0305 and to the values found in starburst galaxies (Deutsch & Willner 1987).
5.9 VCV(2001) J204409.7-104324
The host is an elliptical galaxy with a very bright nucleus. J204409.7-104324 is better known as Mrk 509. It is an IRAS source with fluxes F12=0.34 Jy, F25=0.74 Jy, F60=1.42 Jy and F100=1.43 Jy resulting in a LFIR=0.9.10.
Our colors are consistent with the results of Glass (2004), who classified Mrk 509 as Sy 1.5 galaxy and found average, de-reddened NIR colors of =0.91, =0.88 and =1.35, significantly redder than colors of an ordinary in-active galaxy and consistent to our findings of a very strong non-stellar contribution. In their long term monitoring of the object, strong variations of =0.65mag and =0.62mag were detected. Collins et al. (2004) find strong absorption in O and column densities of multiple ionization stages of silicon (Si, , and ) and Carbon (, , and ) which are interpreted as a multiphase medium containing both collisionally ionized and photoionized gas in the bulge.
Broad Pa and Br lines can be seen in the spectra. The broad component of the Pa line shows a width of 2353 km s20%, the width of the Br line is estimated to a similar value of 2009 km s30%, both being typical for a narrow line Seyfert 1 galaxy. The continuum slope indicates rather strong nuclear influences even at a distance of 2.4kpc from the nucleus, but the seeing during the observations was not very good with 2.6″.
6 Summary and conclusions
The Cologne Nearby QSO sample is well suited for spatially resolved studies of AGN. The close distance of the objects allows for a photometric detection of the host galaxy even with only very short observation times. Low resolution spectroscopy of the stellar CO absorption band can give an upper limit to the central enclosed mass and first limited information on the dominating stellar population. The results of our observations can be summarized in the following points:
-
1.
The dominating morphological class in this sample are disc dominated galaxies. Four of the nine hosts show a bar structure and spiral arms. Only one galaxy is found to be an elliptical galaxy. An underrepresentation of ellipticals is consistent with the results of other samples (e.g. Smith et al. 1986; McLeod & Rieke 1995; Taylor et al. 1996; Schade et al. 2000; Jahnke et al. 2004), since most of the observed sources are lower luminosity AGN and the probability to find an underlying disc-dominated host galaxy increases with lower luminosity nuclei.
-
2.
In at least two galaxies, the appearance suggests that these objects are interacting galaxies, in one galaxy a possible second nucleus is found. This supports the theory that nuclear activity may be triggered by merger events.
-
3.
Seven of the nine galaxies show hydrogen recombination lines in either Pa, Br or both. In three cases, the Pa line shows a composition of a broad and a narrow component, while in two cases only a broad component and in HE 0853-0126 only a narrow component is observed. For HE 2211-3903, the shape of the Pa line points to more complicated kinematics.
-
4.
Three galaxies show extended molecular hydrogen emission in the 1-0S(1) transition. This appears to be a lower detection rate of Seyfert 1 galaxies with molecular hydrogen emission lines in comparison to the findings of other surveys (e.g. Rodríguez-Ardila et al. 2004). For significant conclusions, though, a larger sample size is needed.
-
5.
In five galaxies, stellar CO absorption is detected. With the exception of HE 1328-2508, all sources show a strong increase of the CO-equivalent width with growing distance to the center. In HE 1328-2508, HE 1029-1831 and HE 1013-1947, the CO(2-0)-equivalent width resembles the value found in ordinary elliptical or spiral galaxies. In HE 1248-1356, the value can be associated to ongoing star formation. Only in the case of HE 1248-1356, the CO absorption allowed a determination of an upper limit to the central enclosed mass.
-
6.
The continuum slopes show a correlation to the detectability of the CO-absorption. In galaxies with significant reddening, the CO-absorption is diminished by the strong non-stellar continuum.
-
7.
In the / 2-color diagram, the Seyfert galaxies are broadly distributed over the region between normal galaxies and Quasars.
-
8.
The colors of the spiral hosts are typical for their non-active counterparts or slightly redder.
Acknowledgements.
We thank the anonymous referee for his valuable comments which helped improving the paper. This work was supported in part by the Deutsche Forschungsgesellschaft (DFG) via SFB494.References
- Bade et al. (1995) Bade, N. and Fink, H. H. and Engels, D. and Voges, W. and Hagen, H.-J. and Wisotzki, L. and Reimers, D. A&AS 110, 469
- Binney & Merrifield (1998) Binney, J. & Merrifield, M 1998 Galactic Astronomy (Galactic Astronomy / James Binney and Michael Merrifield Princeton, NJ: Princeton University Press)
- Collins et al. (2004) Collins, J. A. and Shull, J. M. and Giroux, M. L. 2004 ApJ 605, 216
- Deutsch & Willner (1987) Deutsch,L. K. & Willner, S. P. 1987 ApJ 63,803
- Doyon et al. (1994) Doyon, R. and Joseph, R. D. & Wright, G. S. 1994 ApJ 421, 101
- Draine (1989) Draine. B. T. 1989 in 22d Eslab Symp., Infrared Spectroscopy in Astronomy ed. B. H. Kaldeich, 93
- Falco et al. (1999) Falco, E. E. and Kurtz M. J. and Geller M. J. and Huchra J. P. and Peters J. and Berlind P. and Mink D. J. and Tokarz S. P. and Elwell B. 1999 PASP 111, 438F
- Fischer et al. (1998) Fischer, J. U. and Hasinger, G. and Schwope, A. D. et al. 1998 Astron. Nachr. 6, 347
- Frogel et al. (1978) Frogel, J. A. Persson, and S. E. Aaronson, M. and Matthews, K. 1978 ApJ 220, 75
- Gaffney, Lester & Telesco (1993) Gaffney, N. I. and Lester, D. F. and Telesco, C. M. 1993 in Bulletin of the American Astronomical Society
- Gaffney, Lester & Doppmann (1995) Gaffney, N. I. and Lester, D. F. and Doppmann, G. 1995 PASP 107, 68
- Glass (1984) Glass, I. S. 1984 MNRAS 211, 461
- Glass (2004) Glass, I. S. 2004 MNRAS 350, 1049
- Goldader et al. (1995) Goldader, J. D. and Joseph, R. D. and Doyon, R. &Sanders, D. B. 1995 ApJ 444, 97
- Hinkle & Wallace (2001) Hinkle, K. and Wallace, L. 2001 in Astronomical Society of the Pacific Conference Series
- Hollenbach & Shull (1977) Hollenbach, D. J. and Shull, J. M. 1977 ApJ 216, 419
- Hyland & Allen (1982) Hyland, A. R. & Allen, D. A. 1982 MNRAS 199, 943
- Jahnke et al. (2004) Jahnke, K. and Kuhlbrodt, B. and Wisotzki, L. 2004 MNRAS 352, 399
- Jahnke et al. (2003) Jahnke, K. and Wisotzki, L. 2003 MNRAS 346, 304
- Kewley et al. (2001) Kewley, L. J. and Heisler, C. A. and Dopita, M. A. and Lumsden, S. 2001 ApJS 132, 37
- Kleinmann & Hall (1986) Kleinmann, S.G. & Hall, D. N. B. 1986 ApJS 62, 501
- Maia et al. (2003) Maia, M. A. G. and Machado, R. S. and Willmer, C. N. A. 2003 AJ 126, 1750
- McLeod & Rieke (1995) McLeod, K. K. & Rieke, G. H. 1995 ApJ 454, L77
- Nagao et al. (2001) Nagao, T. and Murakayama, Takashi and Taniguchi, Yoshiaki 2001 ApJ 546, 744
- Origlia & Oliva (1993) Origlia, L. & Oliva, E. 1993 A&A 280, 536-550
- Origlia & Oliva (2000) Origlia, L. & Oliva, E. 2000 A&A 357, 61
- Osterbrock (1989) Osterbrock, D. E. 1989 Astrophysics of gaseous nebulae and active galactic nuclei (University Science Books)
- Reunanen et al. (2002) Reunanen, J. and Kotilainen, J. K. and Prieto M. A. 2002 MNRAS 331, 154
- Reimers et al. (1996) Reimers, D. and Koehler, T. and Wisotzki, L. 1996 A&AS 115, 235
- Rieke & Lebofsky (1985) Rieke, G. H. and Lebofsky, M. J. 1985 ApJ 288, 618
- Rodríguez-Ardila et al. (2000a) Rodríguez-Ardila and Pastoriza, M. G. and Donzelli, C. J. 2000a ApJS 126, 63
- Rodríguez-Ardila et al. (2000b) Rodríguez-Ardila, A. and Binette, L. and Pastoriza, M. G. and Donzelli, C. J. 2000b ApJ 538, 581
- Rodríguez-Ardila et al. (2004) Rodríguez-Ardila, A. and Pastoriza, M. G. and Viegas, S. and Sigut, T. A. A. and Pradhan, A. K. 2004 A&A 425, 457
- Schade et al. (2000) Schade, D. and Boyle, B. J. and Letawsky M. 2000 MNRAS 315, 498
- Scoville et al. (2003) Scoville, N. Z. and Stolovy, S. R. and Rieke, M. and Christopher, M. and Yusef-Zadeh, F. 2003 ApJ 594, 294
- Smith et al. (1986) Smith, E. P. and Heckman, T. M. and Bothun, G. D. and Romanishin, W. and Balick, B. 1986 ApJ 306, 64
- Tamura et al. (1991) Tamura, M. and Kleinmann, S. G. and Scoville, N. Z. and Joyce, R. R. 1991 ApJ 371, 131
- Taylor et al. (1996) Taylor, G. L. and Dunlop, J. S. and Hughes, D. H. and Robson, E. I. 1996 MNRAS 283, 930
- Thronson et al. (1990) Thronson, H. A. and Majewski, S. and Descartes, L. & Hereld, M. 1990 ApJ 364, 456
- Tremaine et al (2002) Tremaine, S. and Gebhardt, K. and Bender, R. et al. 2002 ApJ 574, 740
- Véron-Cetty & Véron (2001) Véron-Cetty, M.-P. and Véron, P. 2001, A&A 374, 92
- Wadadekar (2004) Wadekar, Y. 2004 A&A 416,35
- Ward et al. (1982) Ward, M. and Allen, D. A. and Wilson, A. S. and Smith, M.G. & Wright, A.E. 1982 MNRAS 199, 953
- Wisotzki et al. (1996) Wisotzki, L. and Koehler, T. and Groote, D. and Reimers, D. 1996 A&AS 115, 227
- Wisotzki et al. (2000) Wisotzki, L. and Christlieb, N. and Bade, N. and Beckmann, V. and Köhler, T. and Vanelle, C. and Reimers, D. A&A 358, 77