First Detection of Na i D lines in High-Redshift Damped Lyman- Systems 111Based on data collected at Subaru Telescope, which is operated by the National Astronomical Observatory of Japan.
Abstract
A Near-infrared high-resolution spectrum of the gravitationally-lensed QSO APM 08279+5255 was obtained with the InfraRed Camera and Spectrograph mounted on the Subaru Telescope using the adaptive optics system. We detected strong Na i D doublet absorption in high-redshift damped Ly systems (DLAs) at , confirming the presence of Na i, which was first reported for the rest-frame UV Na i doublet by Petitjean et al. This is the first detection of Na i D absorption in a high-redshift DLA. In addition, we detected a new Na i component in the DLA and four new components in the DLA. Using an empirical relationship between Na i and H i column density, we found that all components have large H i column density , so that each component is classified as DLA absorption. We also detected strong Na i D absorption associated with a Mg ii system at . Because no other metal absorption lines were detected in this system at the velocity of the Na i absorption in previously reported optical spectra (observed 3.6 years ago), we interpret this Na i absorption cloud probably appeared in the line of sight toward the QSO after the optical observation. This newly found cloud is likely to be a DLA based upon its large estimated H i column density. We found that the ratios in these DLAs are systematically smaller than those observed in the Galaxy; they are more consistent with the ratios seen in the Large Magellanic Cloud. This is consistent with dust depletion generally being smaller in lower metallicity environments. However, all five clouds of the system have a high ratio, which is characteristic of cold dense gas. We tentatively suggest that the host galaxy of this system may be the most significant contributor to the gravitational-lens toward APM 08279+5255.
1 Introduction
Damped Ly systems (DLAs) comprise a class of the QSO absorption line systems characterized by high H i column density greater than (Wolfe et al., 1986). DLAs are one of the strongest probes to examine the evolution of metallicity and dust depletion in gaseous components of high redshift galaxies (e.g., Pettini, 2004). Since there is a well-established correlation between and (Ferlet et al., 1985; Bowen et al., 1995), Na i absorption, which has been observed extensively in the Galaxy, holds the potential to estimate for individual clouds in DLAs, which usually cannot be precisely measured because of heavy blending of H i absorption. Moreover, the column density ratio of Na i to Ca ii provides a useful indicator of the degree of dust depletion of ISM clouds (e.g., Welsh et al., 1990; Crawford, 1992; Bertin et al., 1993; Sembach et al., 1994; Price et al., 2001; Crawford et al., 2002) because sodium is hardly depleted from gas onto dust, while calcium can be heavily depleted (Savage & Sembach, 1996).
The main absorption lines of Na i are the optical D doublet and the ultraviolet doublet. Observations exploiting the Na i D doublet hold the greater promise for comprehensive studies using Na i due to two important advantages: (1) the oscillator strength of the Na i D transitions are times greater than the Na i UV transitions (Morton, 2003), and (2) Na i D absorption rarely overlaps with other metal absorption lines because the wavelengths of the Na i D doublet are significantly redder than most of other metal lines. Thus, Na i UV doublets can be detected only in the highest column density systems toward the brightest QSO. Weak Na i absorption systems are more likely to be detected with the Na i D doublet. However, observations of Na i D in high-redshift DLAs require near-infrared high resolution spectroscopy because the rest-frame optical wavelengths are redshifted into the near-infrared. The advent of high sensitivity and high resolution spectroscopy in the near-infrared with 8-meter class telescopes has enabled us to undertake such observations (e.g., Kobayashi et al., 2002, 2003, 2005).
As a first trial for detecting Na i D absorption lines at high redshift (), we observed the extremely bright gravitationally-lensed QSO ”APM 08279+5255” (Irwin et al., 1998). There are two dominant gravitationally-lensed images, ”A” and ”B,” with a separation of and flux ratio of (Ibata et al., 1999). A third faint image, ”C”, was also reported by Ibata et al. between A and B, with a separation of A - C = and flux ratio . Petitjean et al. (2000) reported probable faint Na i UV doublet absorption associated with the and 1.181 DLAs in optical HIRES (Vogt et al., 1994) spectra obtained by Ellison et al. (1999a, b). For both systems, Petitjean et al. concluded (1) , (2) metallicity , (3) dust-to-metal ratio about half that of the Galaxy, and (4) a temperature of few hundred Kelvin.
In this paper, we present near-infrared 1.18 -1.35 m spectra of APM 08279+5255 with a resolution of about 50 . The spectra were obtained with the InfraRed Camera and Spectrograph (IRCS) using the adaptive optics (AO) system at the Japanese Subaru Telescope. The AO improved the FWHM of both images A and B such that the spectra of A and B were marginally separated. However, we combined the spectra of images A and B in order to maximize the signal-to-noise ratio and to compare our results with those by Petitjean et al. (2000). We will publish A-B separated spectra elsewhere. This paper is structured as follows: In §2, we describe the IRCS observations and data reduction of APM 08279+5255. In §3, we present the Na i D absorption lines and the fitting results for the systems. We discuss our results and conclusions in §4.
2 Observation & Data Reduction
Near-infrared 1.18-1.35 spectra of APM 08279+5255 were obtained on 2001 December 25 UT, during the scientific commissioning run of the IRCS instrument. IRCS is a cassegrain mounted 0.9-5.5 near-infrared camera and spectrograph (Tokunaga et al., 1998; Kobayashi et al., 2000) with an AO system (Takami et al., 2004) on the 8.2m Subaru Telescope (Iye et al., 2004) located on Mauna Kea, Hawaii.
The Subaru AO system uses a curvature wave front sensor with 36 control elements to compensate for a disturbed wavefront due to the earth’s atmosphere. For an wavefront reference star under excellent observing conditions, the AO provides a stellar image with a Strehl ratio of and a FWHM of in the -band . The performance degrades with fainter reference stars. For these observations, we used APM 08279+5255 itself () as the wavefront reference star. We achieved a FWHM of 02 in the -band, which is much narrower than (0506) for typical seeing conditions at the Subaru Telescope.
We used the cross-dispersed Echelle mode of the IRCS, which provides a spectral resolution of 15 km with a 015 slit. The pixel scale is 0075 per pixel across the slit and 0060 per pixel along the slilt. The entire -band was covered simultaneously in one IRCS exposure, with the cross-disperser in order 5 and the echelle in orders 42-48. Although the FWHM of the images were good throughout the observing time (about 02-05 in the -band), we used a wider slit (06) to maximize throughput. Thus, the spectral resolution was determined by the average image size 05, and the resulting spectral resolution was in the observed wavelength range.
The slit length was , and the position angle was set to 32° so that both the lensed images A and B are in the slit. The telescope pointing was nodded along the slit by about 2″ for each 600s exposure for sky-background and dark subtraction. Because of the fine pixel scale needed for AO images and the high spectral resolution, it is impossible to reach the background limit in 600s exposures, which are required to be less than the time variation of the sky OH emission. Eight sets of data were obtained, resulting in a total exposure time of 9600s. Spectra of bright telluric standard stars (HD 92728: A0Vs) at similar air mass were obtained in a similar fashion.
All the data were reduced following standard procedures using the IRAF222IRAF is distributed by the National Optical Astronomy Observatories, which are operated by the Association of Universities for Research in Astronomy, Inc., under cooperative agreement with the National Science Foundation. noao.imred.echelle package, including sky subtraction (subtraction of two frames), flat-fielding (halogen lamp with an integrating sphere), and aperture extraction. Argon lamp spectra that were taken at the end of the observing night were used for vacuum wavelength calibration. A Heliocentric correction of was applied to the vacuum wavelength calibrated spectra.
3 Results
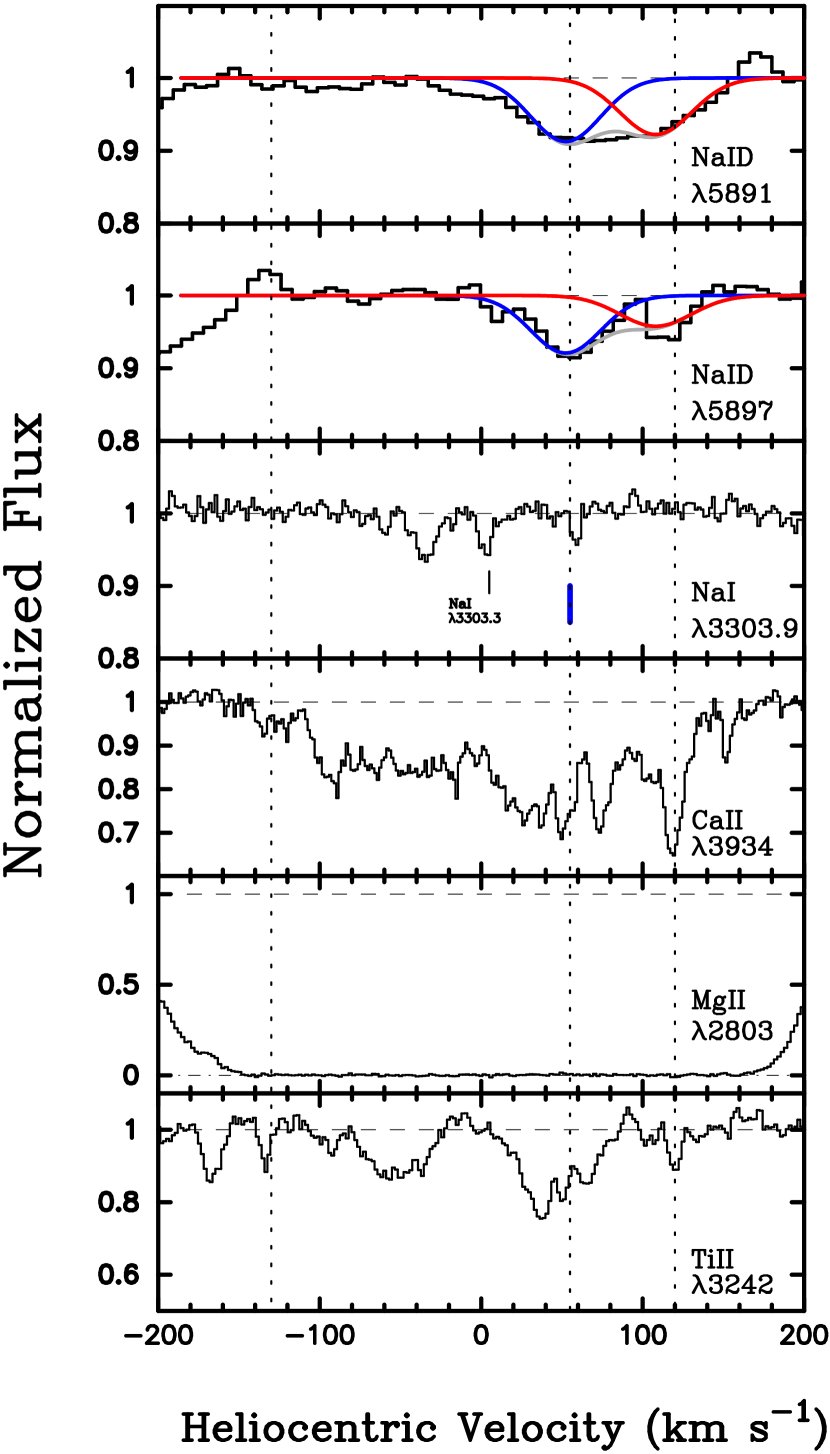
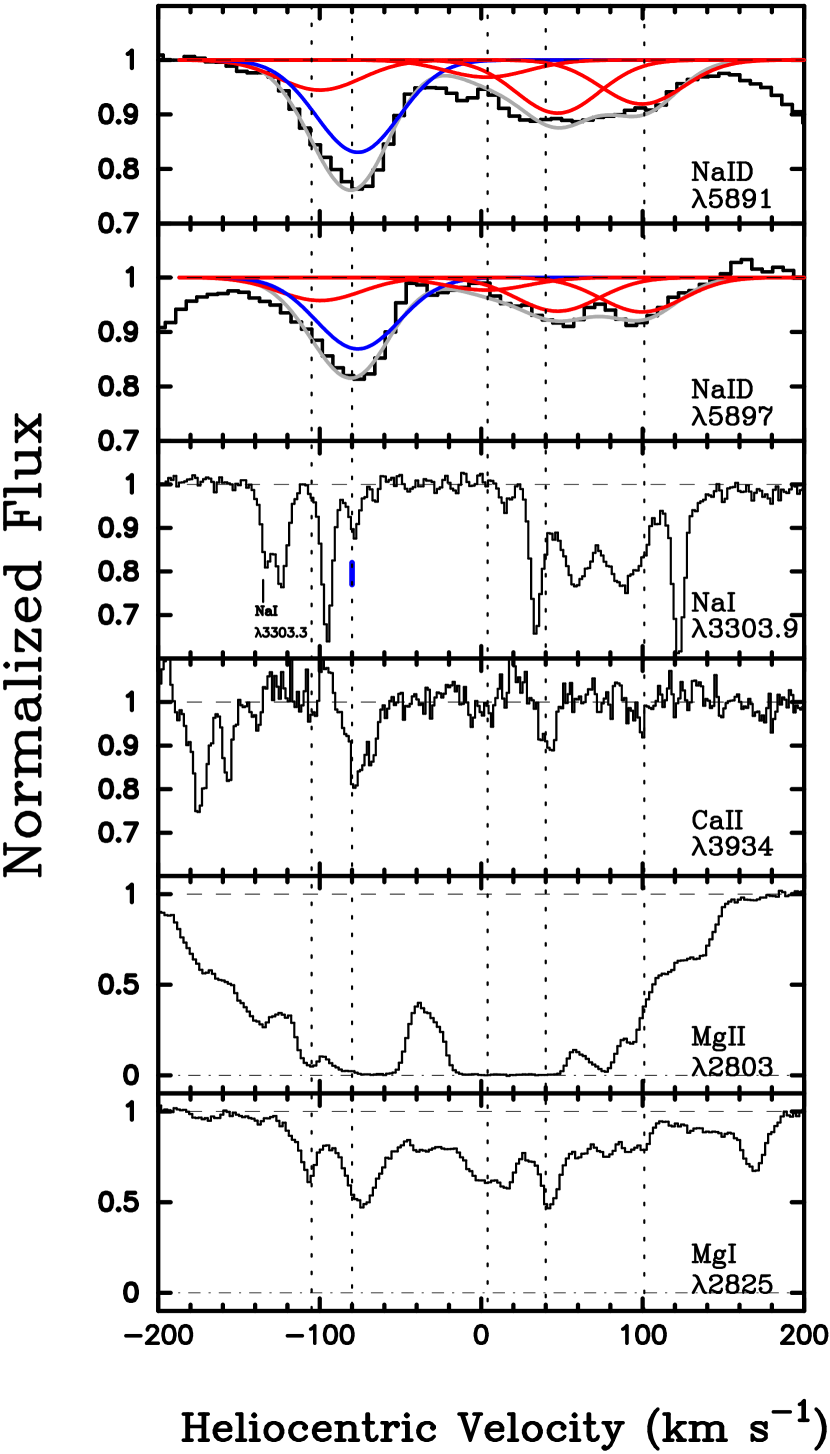
In Figure 1, we present the spectrum of APM 08279+5255. The raw spectrum was smoothed with a 3 pixel boxcar function for presentation. Na i D absorption lines from the and 1.181 DLAs are clearly seen. Several velocity components can be seen in the Na i D absorption lines from the DLA. Additionally Na i D absorption lines associated with the Mg ii system (Petitjean et al., 2000) are detected. This doublet absorption line was identified as Na i D lines because other metal lines of other absorption systems listed in Ellison et al. (1999a,b) cannot account for these two absorption features.
We fit Voigt profiles to the Na i D absorption features assuming the component velocities identified by Petitjean et al. (2000) from metal absorption lines in the optical spectra by Ellison et al. (1999a, b). The column density, Doppler width, and redshift of each component were evaluated using VPGUESS333VPGUESS is a graphical interface to VPFIT written by Jochen Liske, http://www.eso.org/$~{ }$jliske/vpguess/ and VPFIT444VPFIT is a Voigt profile fitting package provided by Robert F. Carswell, http://www.ast.cam.ac.uk/$~{ }$rfc/vpfit.html (Carswell et al., 1987). We fit two components for the system and five for the system. The absorption profiles are dominated by the instrument profile, which is almost identical to the Gaussian width FWHM.
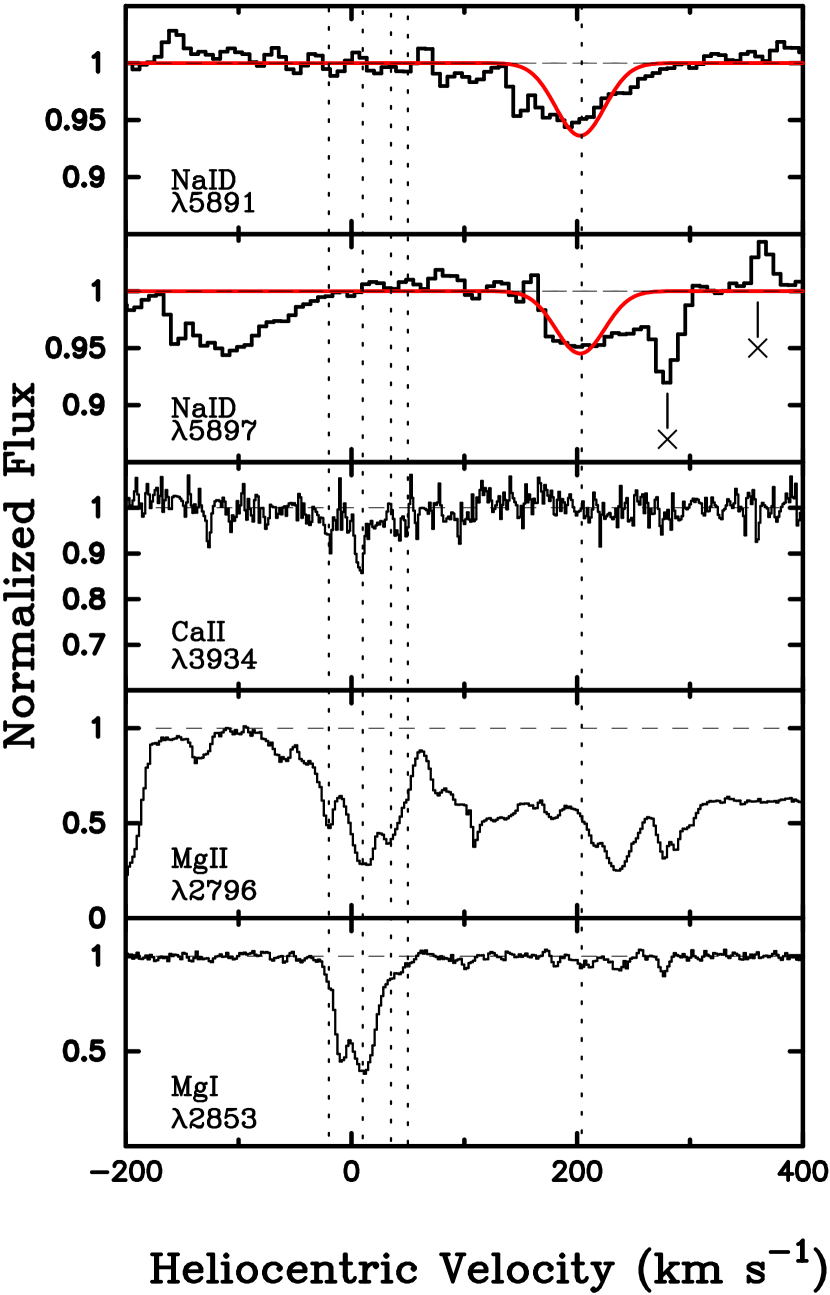
For the system, there is no a priori information on velocity components unlike the other systems. Also, there are several adjacent hot pixels on the right side of the Na i 5897 absorption line, which makes the fitting with multi velocity components difficult. Those hot pixels were difficult to remove because of their proximity to the Na i absorption line (see the feature labeled with mark in Figure 4). Because of the above reasons, we performed only one component VPFIT (almost equivalent to a simple Gaussian fitting) for this system. The hot pixel regions were ignored for the fitting. In view of the statistical noise that can be estimated by point-to-point fluctuations on the continuum, the single component fitting is almost satisfactory.
The fitting results are summarized in Table 1. Figures 2,3,4 show the velocity profiles and fitting results for the Na i D lines. Using atmospheric absorption lines in the object and standard spectra, we confirmed that the pixel shift along the dispersion direction was less than 1 pixel throughout the observing time. Therefore the systematic uncertainty of the velocity is less than . Although the column densities and the Doppler widths could not be directly determined because of insufficient instrumental spectral resolution, they can also be constrained by the doublet ratio [i.e., equivalent width ratio ]. As the doublet ratio approaches unity, uncertainty in column density increases because the column density and Doppler width become degenerate for a fixed equivalent width.
Because the physical distance ( 1 kpc) between A and B at is much larger than the typical spatial scale of Na i clouds in our Galaxy (a few tens to several thousands AU e.g., Price et al., 2001), the images A and B are most likely covered unequally. This introduces an additional systematic uncertainty in the inferred properties of the Na i clouds. An estimation of the systematic uncertainty depends on the saturation level of the Na i absorption lines in the A+B combined spectrum. It can range from 0.3 dex for a moderately saturated case to 1 dex for a heavily saturated case. The estimated systematic uncertainty for each component is shown in Table 1.
Because the resolution of the optical spectrum is higher than our near-infrared spectrum, the estimated redshift of each component by Petitjean et al. (2000) should be more accurate than ours. Hereafter, we use the velocities reported by Petitjean et al. (2000) for our discussion of each component, except for the newly identified components from our spectrum.
3.1 DLA at
In this system, we found two Na i components at and , which we identify as the components at and by Petitjean et al. (2000). While Petitjean et al. found Na i component only at the +55 , we newly identified Na i component at the +120 . The estimated column densities are and , respectively. These are consistent with Petitjean et al., who detected the former component with the similar column density, but not the latter component to an upper-limit of .
3.2 DLA at
In this system, we found five Na i components. We identified the three components at , , and as the components at , , and reported by Petitjean et al. (2000). While Petitjean et al. found Na i component only at the , we newly identified Na i components at the , and . We identified further two new Na i components at , and , which were not identified in Petitjean et al probably due to contamination by other absorption lines. The estimated column density of the component is , which is not consistent with Petitjean et al. However, our evaluation of the column density of component is not so robust because Mg i absorption associated with an Mg ii absorption system at (Kondo et al. in preparation) overlaps with the Na i D . The estimated column density of the component is , which is consistent with the upper-limit of found by Petitjean et al.
3.3 Mg ii system at
In this system, we found a Na i component at . Petitjean et al. (2000) did not find any metal absorption lines at this velocity. The detected Na i absorption line probably arises in a cloud that was previously not in front of the quasar at this velocity. We discuss the detail of this newly identified component in §4.2. We could not detect Na i absorption lines associated with the four components around reported by Petitjean et al., probably because of their low Na i column density.
4 Discussion
4.1 H i Column Densities of Each Velocity Component
Following Petitjean et al. (2000), we estimated for all components using the empirical relationship, (Sembach et al., 1993; Diplas & Savage, 1994; Bowen et al., 1995) established for the Galactic interstellar absorption clouds. In Table 2, we summarize our results for . While this empirical relationship does not hold for (Welty et al., 1994; Wakker & Mathis, 2000; Wakker, 2001) nor for (Ferlet et al., 1985), the column densities of all the detected components are within the appropriate range of this relationship. The estimated in various components, however, is subject to systematic uncertainties related to the following issues:
-
1.
Low metallicity
It is likely that the column density ratio is in proportion to the metallicity. Vladilo et al. (1993) found that the column density ratio in the Large Magellanic Cloud (LMC) decreases in proportion to the metallicity (, Peimbert et al., 1974; Pagel et al., 1977). Because the metallicities of the and DLAs are estimated to be in the range of (Petitjean et al., 2000), it is appropriate to interpret the estimated in these systems as lower-limits.
-
2.
Contamination from a metal absorption line of other redshift
We could not evaluate the reliable column density of the component in the system because Mg i absorption associated with a strong Mg ii system at (Kondo et al. in preparation) is blended with the Na i D absorption. Assuming the correlation, (Churchill et al., 2003b) and the same Doppler width as the Mg ii absorption lines, we estimated the equivalent width of the Mg i absorption. The H i column density of this component was estimated after removing this contamination from Mg i, and this introduced systematic uncertainty. Even after removing the contamination, there still is another large uncertainty, because the resultant doublet ratio of the Na i absorption lines is close to unity.
-
3.
Coverage of gravitationally-lensed images A and B
As stated above, it is likely that the Na i clouds do not equally cover the gravitationally-lensed images A and B. Thus, the estimated Na i column density is uncertain as described in §3. The estimated varies accordingly.
While Petitjean et al. (2000) suggested that there are 40 and 20 small clouds in the , and 1.181 systems, respectively, our results show that there are at least 2 and 5 high column density clouds in each system. Most interestingly, we find that each cloud in the system has a H i column density that is classified as a DLA. This is the first indication of an absorber in which the individual clouds are each of such high column density. This is in contrast to the findings of Churchill et al. (2003a), who constrained the size of DLA clouds be less than 25 pc in the lensed QSO 0957+561A,B and inferred that only one of the clouds gave rise to the DLA H i column density. This would suggest that the DLA, having , may be probing a very massive and large underlying structure (see, for example, Turnshek et al., 2004).
4.2 Detection of a New DLAs at : Proper Motion of a cloud of a few 100 AU?
We detected a new component at associated with the Mg ii absorption system. Based upon scaling from the high Na i column density, this system is probably a DLA rather than a Lyman-limit Mg ii system (Petitjean et al., 2000). Therefore, this system might contribute to the gravitational-lensing of the QSO, together with the other three DLAs, at , as suggested by Petitjean et al. Despite the large Na i column density, Petitjean et al. did not identify any metal lines for this velocity component in the optical Keck spectrum. Similarly, in a subsequent search, we also could not identify any Mg ii, Mg i, and Ca ii absorption lines for this component in the HIRES spectrum555ftp://ftp.ast.cam.ac.uk/pub/papers/APM08279 (see Figure 4).
Because there is a time-span of 3.6 years between our observation and the optical observation in the local-frame, or 1.7 years in the rest-frame considering the effect of cosmological time dilation by a factor of , it is probable that the newly identified cloud appeared in the line of sight toward the QSO within that time-span. If the cloud is moving in a tangential direction in the sky with a velocity of , the travel distance is AU in 1.7 years in the rest-frame. The assumed velocity is comparable to the combined velocity of the motion of cloud in high-redshift galaxies (, Erb et al., 2003) and the proper motion of field galaxies which should be smaller than the typical velocity dispersion of the cluster of galaxies (e.g., , Gal & Lubin, 2004). This sets the upper-limit of the cloud size and it is consistent with the size of the Na i clouds in the Galaxy, which ranges from a few to several thousands AU (e.g., Meyer et al., 1996; Meyer & Lauroesch, 1999; Welty & Fitzpatrick, 2001; Andrews et al., 2001; Lauroesch et. al., 2000, 2003). Our result shows that we can catch the very small-scale structures of the cold neutral gas component in high-z QSO absorption systems with time variation of Na i absorption features. The observable spatial scale with this technique is much smaller than that with the observation of gravitationally-lensed QSOs (see discussion in Ellison et al., 2004).
4.3 Dust Depletion and Chemical Uniformity in DLAs
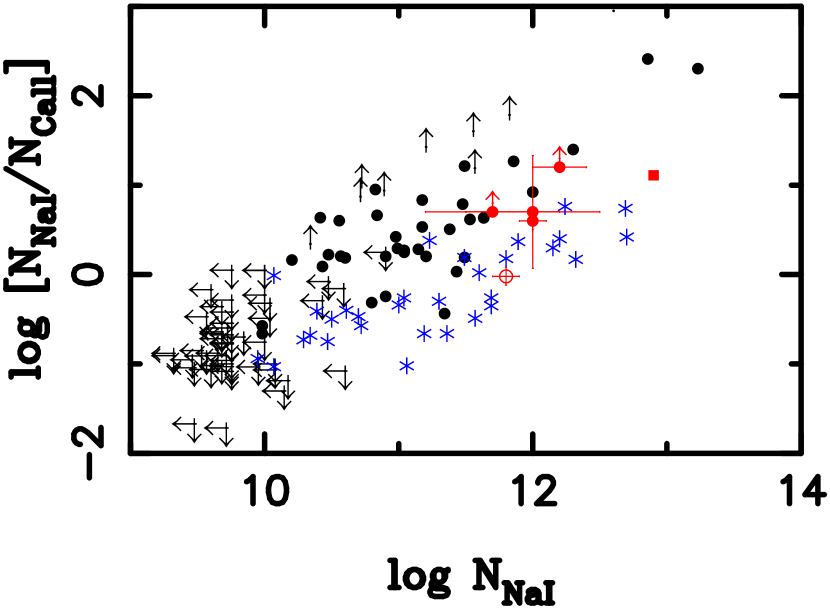
The column density ratio has often been used as a good indicator of the degree of dust depletion because sodium is hardly depleted from gas onto dust grains while calcium can be heavily depleted (Savage & Sembach, 1996). In Table 3, we list the ratio of each component. for the component at and for the and components at are taken from Petitjean et al. (2000), while those for the , , and components at were evaluated666We evaluated Ca ii column density for those systems using VPFIT. We evaluated Ca ii column densities also for the component at and the , and components at and confirmed that our fitting results are consistent with those estimated by Petitjean et al. (2000). using archived optical spectra (Ellison et al., 1999a, b).
We estimated the 3 upper-limit of for the , and components at , because no Ca ii absorption line was detected in the optical spectra. In Figure 4, we show a – plot for the DLAs as well as Na i clouds in the Galaxy (Vallerga et al., 1993) and in the LMC (Vladilo et al., 1993).
We found that in these DLAs is systematically smaller than those in the Galaxy but similar to those in the LMC (Welty et al., 1999), suggesting that dust depletion is generally smaller in a lower metallicity environment. Our results are consistent with the results of Vladilo (1998), who shown that dust-to-metal ratios of DLAs are similar to that of the LMC but smaller than that of the Galaxy, using the column density ratio of zinc to chromium.
It is also interesting to consider the uniformity in the ratio across the km s-1 velocity spread of the DLA. As presented in Table 3, it would appear that the ratios are consistent with being uniform with component velocity, though there is large uncertainty in this statement. If so, this is consistent with the findings of Prochaska (2003a) and Churchill et al. (2003a), who reported uniform column density ratios as a function of velocity in DLAs. It is also found by Churchill et al. that the uniformity is spatial, at least on the scale of 200 pc. If the ratio is more–or–less constant across the profiles in the DLA, it would suggest that the chemical, ionization, and dust depletion levels are uniform across the clouds.
4.4 The System: Cold Dense Gas Clouds near the Center of a Galaxy ?
All five components of the system have , which is a characteristic of cold dense gas in the Galaxy (known as the “the Routly-Spitzer effect”, e.g., Routly & Spitzer, 1952; Vallerga et al., 1993; Sembach et al., 1994). Because there are five cold dense and very high column density clouds for the system, we suggest that the line of sight may be passing near the center of the host galaxy. The relatively high metallicity of this system (, Petitjean et al., 2000) compared to that typical of z1 DLAs (, Prochaska et al., 2003b) also supports the above idea, because the metallicity of DLA absorption is higher in the inner region galaxies because of a metallicity gradient (Chen et al., 2005). Therefore, the host galaxy of this system might be the most significant contributor to the gravitational-lens among four DLAs toward APM 08279+5255. Note that some DLAs were observed to have an impact parameter larger than 65 kpc (Churchill et al., 2005) and above argument should be taken with caution.
References
- Andrews et al. (2001) Andrews, S. M., Meyer, D. M., & Lauroesch, J. T. 2001, ApJ, 552, L73
- Bowen et al. (1995) Bowen, D. V., Blades, J. C., & Pettini, M. 1995, ApJ, 448, 634
- Bertin et al. (1993) Bertin, P., Lallement, R., Ferlet, R., & Vidal-Madjar, A. 1993, A&A, 278, 549
- Carswell et al. (1987) Carswell, R. F., Webb, J. K., Baldwin, J. A., & Atwood, B. 1987, ApJ, 319, 709
- Crawford (1992) Crawford, I. A. 1992, MNRAS, 259, 47
- Crawford et al. (2002) Crawford, I. A., Lallement, R., Price, R. J., Sfeir, D. M., Wakker, B. P., & Welsh. B. Y. 2002, MNRAS, 337, 720
- Chen et al. (2005) Chen, H.-W., Kennicutt, R. C., Jr., & Rauch, M. 2005, ApJ, 620, 703
- Churchill et al. (2003a) Churchill, C. W., Mellon, R. R., Charlton, J. C., & Vogt, S. S. 2003a, ApJ, 593, 203
- Churchill et al. (2003b) Churchill, C. W., Vogt, S. S., & Charlton, J. C. 2003b, AJ, 125, 98
- Churchill et al. (2005) Churchill, C. W., Kacprzak, G. G., & Steidel, C. C. 2005, IAU Colloq. 199: Probing Galaxies through Quasar Absorption Lines, 24
- Diplas & Savage (1994) Diplas, A., & Savage, B. D. 1994, ApJS, 93, 211
- Ellison et al. (1999a) Ellison, S. L., Lewis, G. F., Pettini, M., Chaffee, F. H., & Irwin, M. J. 1999a, ApJ, 520, 456
- Ellison et al. (1999b) Ellison, S. L., et al. 1999b, PASP, 111, 946
- Ellison et al. (2004) Ellison, S. L., Ibata, R., Pettini, M., Aracil, B., Petitjean, P., Srianand, R. 2004, A&A, 441, 79
- Erb et al. (2003) Erb, D. K., Shapley, A. E., Steidel, C. C., Pettini, M., Adelberger, K. L., Hunt, M. P., Moorwood, A. F. M., & Cuby, J. 2003, ApJ, 591, 101
- Ferlet et al. (1985) Ferlet, R., Vidal-Madjar, A., & Gry, C. 1985, ApJ, 298, 838
- Gal & Lubin (2004) Gal, R. R., & Lubin, L. M. 2004, ApJ, 607, L1
- Ibata et al. (1999) Ibata, R. A., Lewis, G. F., Irwin, M. J., Leha’r, J., & Totten, E. J. 1999, AJ, 118, 1922
- Irwin et al. (1998) Irwin, M. J., Ibata, R. A., Lewis, G. F., & Totten, E. J. 1998, ApJ, 505, 529
- Iye et al. (2004) Iye, M., et al. 2004, PASJ, 56, 381.
- Kobayashi et al. (2000) Kobayashi, N., et al. 2000, Proc. SPIE, 4008, 1056
- Kobayashi et al. (2002) Kobayashi, N., Terada, H., Goto, M., & Tokunaga, A. 2002, ApJ, 569, 676
- Kobayashi et al. (2003) Kobayashi, N. 2003, in ”The IGM/Galaxy Connection”, J.L. Rosenberg and M.E. Putman (eds.), Kluwer Academic Publishers., 249
- Kobayashi et al. (2005) Kobayashi, N., Tsujimoto, T. & Minowa, Y. 2005, in ”Science with Adaptive Optics”, W. Brandner & M. Kasper (eds.), Springer, 352
- Lauroesch et. al. (2000) Lauroesch, J. T., Meyer, D. M., & Blades, J. C. 2000, ApJ, 543, L43
- Lauroesch et. al. (2003) Lauroesch, J. T., & Meyer, D. M. 2003, ApJ, 591, L123
- Lord (1992) Lord, S. D. 1992, NASA Technical Memo (Washington: NASA), 103957
- Meyer et al. (1996) Meyer, D. M., & Blades, J. C. 1996, ApJ, 464, L179
- Meyer & Lauroesch (1999) Meyer, D. M., & Lauroesch, J. T. 1999, ApJ, 520, L103
- Morton (2003) Morton, D. C. 2003, ApJS, 149, 205
- Pagel et al. (1977) Pagel, B. E. J, Edmunds, M. G., Fosbury, R. A. E., & Webster, B. L. 1978, MNRAS, 184, 569
- Peimbert et al. (1974) Peimbert, M., & Torres-Peimbert, S. 1974, ApJ, 193, 327
- Petitjean et al. (2000) Petitjean, P., Aracil, B., Srianand, R., & Ibata, R. 2000, A&A, 359, 457
- Pettini (2004) Pettini, M. 2004, in Cosmochemistry: The Melting Pot of the Elements, ed. C. Esteban et al. (Cambridge: Cambridge Univ. Press), 257
- Price et al. (2001) Price, R. J., Crawford, I. A., Barlow, M. J., & Howarth, I. D. 2001, MNRAS, 328, 555
- Prochaska (2003a) Prochaska, J. X. 2003a, ApJ, 582, 49
- Prochaska et al. (2003b) Prochaska, J. X., Gawiser, E., Wolfe, A. M., Castro, S., & Djorgovski, S. G. 2003b, ApJ, 595, L9
- Routly & Spitzer (1952) Routly, P. M., & Spitzer, L. 1952, ApJ, 115, 227
- Savage & Sembach (1996) Savage, B. D., & Sembach, K. R. 1996, ARA&A, 34, 279
- Sembach et al. (1993) Sembach, K. R., Danks, A. C., & Savage, B. D. 1993, A&AS, 100, 107
- Sembach et al. (1994) Sembach, K. R., & Danks, A. C. 1994, ApJ, 289, 539
- Takami et al. (2004) Takami, H., et al. 2004, PASJ, 56, 225
- Tokunaga et al. (1998) Tokunaga, A. T., et al. 1998, Proc. SPIE, 3354, 512
- Turnshek et al. (2004) Turnshek, D. A., Rao, S. M., Nestor, D. B., Vanden Berk, D., Belfot-Mihalyi, M., & Monier, E. M. 2004, ApJ, 609, L53
- Vladilo et al. (1993) Vladilo, G., Molaro, P., Monai, S., D’Odorico, S., Ferlet, R., Vidal-Madjar, A., & Dennefeld, M. 1993, A&A, 273, 37
- Vladilo (1998) Vladilo, G. 1998, ApJ, 493, 583
- Vallerga et al. (1993) Vallerga, J. V., Vedder, P. W., & Welsh, B. Y. 1993, ApJ, 411, 729
- Vogt et al. (1994) Vogt, S. S., et al. 1994, in Proc. SPIE, 2128, 326
- Wakker & Mathis (2000) Wakker, B. P., & Mathis, J. S. 2000, ApJ, 544, L107
- Wakker (2001) Wakker, B. P. 2001, ApJS, 136, 463
- Welsh et al. (1990) Welsh, B. Y., Vedder, P. W., & Vallerga, J. V. 1990, ApJ, 358, 473
- Welty et al. (1994) Welty, D. E., Hobbs, L. M., & Kulkarny, V. P. 1994, ApJ, 436, 152
- Welty et al. (1999) Welty, D. E., Frisch, P. C., Sonneborn. G., & York, D. G. 1999, ApJ, 512, 636
- Welty & Fitzpatrick (2001) Welty, D. E., & Fitzpatrick, E. L. 2001, ApJ, 551, L175
- Wolfe et al. (1986) Wolfe, A. M., Turnshek, D. A., Smith, H. E., & Cohen, R. D. 1986, ApJS, 61, 249


| Our results | Petitjean et al. (2000) | |||||||
|---|---|---|---|---|---|---|---|---|
| system | Va,ba,bfootnotemark: | b | Va,ca,cfootnotemark: | b | ||||
| () | () | () | () | |||||
| 1.062 | 1.06266 | +53 | 12.9ddThere is a systematic uncertainty of about 1 dex because the gravitationally-lensed images are not resolved. See main text for detail. | 1.1 | +55 | 12.9 | 1.5 | |
| 1.062 | 1.06305 | +108 | 11.7eeThere is an additional systematic uncertainty of about 0.3 dex because the gravitationally-lensed images are not resolved. See main text for detail. | 7 | +120 | 1.5 | ||
| 1.173 | 1.17418 | +204 | 12.3ddThere is a systematic uncertainty of about 1 dex because the gravitationally-lensed images are not resolved. See main text for detail. | 1.0 | ||||
| 1.181 | 1.17998 | -99 | 12.0ddThere is a systematic uncertainty of about 1 dex because the gravitationally-lensed images are not resolved. See main text for detail. | 1.3 | -105 | 2.5 | ||
| 1.181 | 1.18015 | -75 | 12.5ffThere is a possible significant systematic uncertainty because of the accidental overlap of the Mg i absorption line. See main text for detail. | 4 | -80 | 13.5 | 0.8 | |
| 1.181 | 1.18073 | +4 | 11.7ffThere is a possible significant systematic uncertainty because of the accidental overlap of the Mg i absorption line. See main text for detail. | 0.8 | ||||
| 1.181 | 1.18105 | +48 | 12.0eeThere is an additional systematic uncertainty of about 0.3 dex because the gravitationally-lensed images are not resolved. See main text for detail. | 3.6 | +40 | |||
| 1.181 | 1.18143 | +101 | 12.2eeThere is an additional systematic uncertainty of about 0.3 dex because the gravitationally-lensed images are not resolved. See main text for detail. | 1.8 | ||||
| Our results | Petitjean et al. (2000) | |||||
|---|---|---|---|---|---|---|
| system | V | |||||
| 1.062 | +55aaThe velocity zero point is set to z=1.06230, 1.17270, 1.18070 for each system. | 12.9bbThere is a systematic uncertainty which is less than . See main text for detail. | 21.0bbThere is an additional systematic uncertainty of about 1 dex. See Table 1. | |||
| 1.062 | +120aaVelocities from figures in Petitjean et al. (2000). See note b in Table 1 for detail. | 11.6ccWe estimated the velocity with an accuracy of from Figure 7,8 of Petitjean et al. (2000) by eyes because Petitjean et al. (2000) do not list the velocities. | 20.2ccThere is an additional systematic uncertainty of about 0.3 dex. See Table 1. | |||
| 1.173 | +204 | 12.3bbThere is an additional systematic uncertainty of about 1 dex. See Table 1. | 20.6bbThere is an additional systematic uncertainty of about 1 dex. See Table 1. | |||
| 1.181 | -105aaVelocities from figures in Petitjean et al. (2000). See note b in Table 1 for detail. | 12.0bbThere is an additional systematic uncertainty of about 1 dex. See Table 1. | 20.4bbThere is an additional systematic uncertainty of about 1 dex. See Table 1. | |||
| 1.181 | -80aaVelocities from figures in Petitjean et al. (2000). See note b in Table 1 for detail. | 12.9ddThere is a possible significant systematic uncertainty. The value shown here is after removing of the contamination from the Mg i absorption at . | 20.7ddThere is a possible significant systematic uncertainty. The value shown here is after removing of the contamination from the Mg i absorption at . | |||
| 1.181 | +4 | 11.7ccThere is an additional systematic uncertainty of about 0.3 dex. See Table 1. | 20.2ccThere is an additional systematic uncertainty of about 0.3 dex. See Table 1. | |||
| 1.181 | +40aaVelocities from figures in Petitjean et al. (2000). See note b in Table 1 for detail. | 12.0ccThere is an additional systematic uncertainty of about 0.3 dex. See Table 1. | 20.4ccThere is an additional systematic uncertainty of about 0.3 dex. See Table 1. | |||
| 1.181 | +101 | 12.2ccThere is an additional systematic uncertainty of about 0.3 dex. See Table 1. | 20.5ccThere is an additional systematic uncertainty of about 0.3 dex. See Table 1. | |||
| system | V | |||
|---|---|---|---|---|
| 1.062 | +50 | 12.9aaThere is an additional systematic uncertainty of about 1 dex. See Table 1. | ddNo measurement was possible due to the blending effects. See the note of TABLE 2 in Petitjean et al. (2000). | ddNo measurement was possible due to the blending effects. See the note of TABLE 2 in Petitjean et al. (2000). |
| 1.062 | +110 | 11.7bbThere is an additional systematic uncertainty of about 0.3 dex. See Table 1. | ||
| 1.181 | -100 | 12.0aaThere is an additional systematic uncertainty of about 1 dex. See Table 1. | ||
| 1.181 | -75 | 12.9ccThere is a possibly significant systematic uncertainty. The value shown here is after removing the contamination from the Mg i absorption at . | 1.1 | |
| 1.181 | +4 | 11.7bbThere is an additional systematic uncertainty of about 0.3 dex. See Table 1. | ||
| 1.181 | +40 | 12.0bbThere is an additional systematic uncertainty of about 0.3 dex. See Table 1. | ||
| 1.181 | +101 | 12.2bbThere is an additional systematic uncertainty of about 0.3 dex. See Table 1. |