XMM–Newton observations of a sample of ray loud active galactic nuclei††thanks: Based on public observations obtained with XMM–Newton, an ESA science mission with instruments and contributions directly funded by ESA Member States and the USA (NASA).
Abstract
Aims. To understand the nature of ray loud active galactic nuclei (AGN) and the mechanisms for the generation of high-energy rays.
Methods. We performed a homogeneous and systematic analysis of simultaneous X-ray and optical/UV properties of a group of ray loud AGN, using observations performed with XMM-Newton. The sample is composed of 13 blazars (6 BL Lac and 7 Flat-Spectrum Radio Quasar) and 2 radio galaxies that are associated with detections at energies MeV. The data for 7 of them are analyzed here for the first time, including the first X-ray observation of PKS . The spectral characteristics of the sources in the present sample were compared with those in previous catalogs of blazars and other AGN, to search for difference or long term changes.
Results. All the selected sources appear to follow the classic “blazar sequence” and the spectral energy distributions (SED) built with the present X-ray and optical/UV data and completed with historical data, confirm the findings of previous studies on this type of source. Some sources display interesting features: four of them, namely AO , PKS , S5 and PKS show the presence of an intervening absorption system along the line of sight, but only the last is known to be gravitationally lensed. AO was detected during an outburst and its SED shows a clear shift of the synchrotron peak. 3C shows a change in state with respect to the previous BeppoSAX observations that can be interpreted as an increase of the Seyfert-like component and a corresponding decline of the jet emission. This is consistent with the monitoring at radio wavelengths performed during the same period. PKS is detected with a flux higher than in the past, but with a corresponding low optical flux. Although it is classified as FSRQ, the SED can be modelled with a simple synchrotron self-Compton model.
Key Words.:
Galaxies: active – BL Lacertae objects: general – Quasars: general – X-rays: galaxies1 Introduction
There is general consensus on the supermassive black hole (SMBH) paradigm as the central engine of active galactic nuclei (AGN). It is more difficult to obtain quantitative understanding of the physical mechanisms responsible for the observed properties of these cosmic sources. In the AGN zoo, ray loud objects – where with this term we consider the AGN detected at MeV – represent a small, but interesting class. Their discovery dates back to the start of ray astronomy, when the European satellite COS-B () detected photons in the MeV range from 3C273 (Swanenburg et al. 1978). However, 3C273 remained the only AGN detected by COS-B. A breakthrough in this research field came later with the Energetic Gamma Ray Experiment Telescope (EGRET) on board the Compton Gamma-Ray Observatory (CGRO, 1991-2000). The third catalog of point sources contains sources detected at energies greater than MeV: of them are identified with blazars ( at high confidence and at low confidence), and with the nearby radiogalaxy Centaurus A (Hartman et al. 1999). Among the remaining sources, there are pulsars, the Large Magellanic Cloud, one exceptional solar flare, and are unidentified. Therefore, EGRET discovered that the blazar-type AGN are the primary source of the extragalactic background in the MeV-GeV range, as suggested by several authors (e.g. Strong et al. 2004, Giommi et al. 2006).
| 3EG | Counterpart | Other Name | AGN Type | , | ||
|---|---|---|---|---|---|---|
| (1) | (2) | (3) | (4) | (5) | (6) | (7) |
| J | 3C A | LBL | , | |||
| J | AO | LBL | , | |||
| J | PKS | FSRQ | , | |||
| J | S5 | LBL | , | |||
| J | S5 | 4C | FSRQ | , | ||
| J | Mkn | HBL | , | |||
| J | PKS | FSRQ | , | |||
| J | ON | W Comae | LBL | , | ||
| J | 3C | FSRQ | , | |||
| J | Cen A | NGC | RG | , | ||
| J | PKS | FSRQ | , | |||
| J | PKS | FSRQ | , | |||
| J | NGC | RG | , | |||
| J | PKS | FSRQ | , | |||
| J | PKS | HBL | , |
-
∗
Lower limit evaluated on the basis of the non-detection of the host galaxy (Sbarufatti et al. 2005).
-
∗∗
This redshift is not indicative and the distance of Mpc is adopted here. See Evans et al. (2004) for more details.
During the years following these discoveries, much effort has been dedicated to the identification of the remaining sources. This is a challenging enterprise given the large position error contours of EGRET sources (typically ). A significant advancement has been obtained by Sowards-Emmerd et al. (2003, 2004), who performed a radio survey at GHz. By using a “figure of merit” obtained combining the GHz flux, the radio spectral index and the X-ray flux (when available), they proposed new identifications of EGRET sources with blazar-type AGN. A strong improvement in the identification and discovery of new ray loud AGN is expected with the forthcoming missions GLAST111http://www-glast.stanford.edu and AGILE222http://agile.iasf-milano.inaf.it.
An important complement to these discoveries was the observations performed by the Italian-Dutch satellite BeppoSAX (1996-2002) and operating in the keV energy band (see Ghisellini 2004 for a review on blazar observations with this satellite). During its lifetime, BeppoSAX observed more than blazars (Giommi et al. 2002, Donato et al. 2005) and sampled with high sensitivity the X-ray region of the spectral energy distribution (SED) over more than three decades in energy.
The observations of these and other high-energy satellites, together with ground telescopes, led to the discovery that the spectral energy distribution (SED) of blazars is typically composed of two peaks, one due to synchrotron emission and the other to inverse Compton radiation, the latter discovered by CGRO/EGRET (von Montigny et al. 1995). Maraschi et al. (1995b) and Sambruna et al. (1996) noted that the broad-band spectra of BL Lac and Flat-Spectrum Radio Quasars (FSRQ) share common features and properties (that justified the common designation of “blazars” proposed by Spiegel in 1978). Fossati et al. (1998) and Ghisellini et al. (1998) proposed a unified scheme where the blazars are inserted into a “sequence” according to their physical characteristics. Low luminosity BL Lac have the synchrotron peak in the UV-soft X-ray energy band and therefore are “high-energy peaked” (HBL). As the synchrotron peak shifts to low energies (near infrared, “low-energy peaked” BL Lac or LBL), the luminosity increases and the X-ray emission can be due to synchrotron or inverse Compton or a mixture of both. In the case of FSRQ, the blazars with the highest luminosity, the synchrotron peak is in the far infrared and the X-ray emission is due to inverse Compton radiation. However, other authors reported failures in the above mentioned scheme (see, for example, Padovani et al. 2003, Landt et al. 2006).
The two-peak SED is a dynamic picture of the blazar behaviour: indeed, these AGN are characterized by strong flares during which the SED can change dramatically (e.g. Tagliaferri et al. 2002). The most striking example of such a behaviour is represented by Mkn – although at ray energies this source was not detected by EGRET, but by TeV telescopes – that during an outburst in 1997 showed a shift of the synchrotron peak to the hard X-ray energy band ( keV, Pian et al. 1998). The variability on different time scales and, particularly, the intraday variability, is one of the striking characteristics of blazars and is considered one of the proofs that the continuum is generated by a relativistic jet with a small observing angle (for a review see Wagner & Witzel 1995, Ulrich et al. 1997).
XMM-Newton (launched in Dec. 1999, Jansen et al. 2001) is a satellite with the current largest collecting area, useful for timing studies, together with a good sensitivity and spectral resolution. XMM-Newton covers a lower frequency range than BeppoSAX, i.e. from the optical/UV domain to the X-rays, up to keV. From the large XMM-Newton public archive, we have selected and analyzed all the publicly available EGRET-detected AGN data. Although the single observations were originally intended for other purposes, it was possible to carry out a homogeneous analysis and to study the main spectral characteristics of these sources in the X-ray energy band. Several sources of the present sample deserve particular attention and many detailed studies have been published on the individual sources. However, the aim of the present work is to perform an overall view and comparison with previous surveys to search for common features that could explain the ray generation. Some early resuls of the present work have been presented in Foschini et al. (2006).
This paper is organized as follows: in Sect. 2 the selection criteria, biases and the parameters used in the data analysis are presented; in Sect. 3, the spectral characteristics are shown and compared with other catalogs. The absorption systems are discussed in Sect. 4, and a short note on the X-ray spectral features is presented in Sect. 5. The spectral energy distributions and the blazar sequence is shown in Sect. 6. Sect. 7 contains final remarks. In Appendix A we provide the notes on the individual sources together with the fits and some tabular material.
The cosmology values adopted through the paper, when not explicitly declared, are kms-1Mpc-1, and .
2 Sample selection and data analysis
The starting sample consists of all the AGN in the Third EGRET Catalog (Hartman et al. 1999) updated with the recent results by Sowards-Emmerd et al. (2003, 2004). This sample has been cross-correlated with the public observations available in the XMM-Newton Science Archive333http://xmm.vilspa.esa.es/external/xmm_data_acc/xsa/index.shtml to search for spatial coincidences in the field of view (FOV) of the EPIC camera, within of the boresight444This maximum distance has been selected to take into account that within that region the telescope vignetting is well corrected according to Kirsch (2005).. AGN have been found (Table 1) as of January , 2006, and for three of them there are more than 5 observations available (see the observation log in Table 6), making it possible also to study the long term behaviour.
2.1 Biases and caveats
The present work suffers from several biases, but nevertheless it is possible to obtain useful information about the overall behaviour of the ray loud AGN.
The first source of bias is the Third EGRET catalog itself: the large point spread function (PSF) of the EGRET telescope and its moderate sensitivity, changes in the position from the 2EG to the 3EG catalog, double (or more?) sources not resolved by the EGRET PSF (see the notes on the single sources). Sowards-Emmerd et al. (2005) called for the release of a Fourth EGRET catalog, but a major advancement will be possible when the GLAST satellite is operational. The arcminute-sized PSF of the LAT telescope and the higher sensitivity would then improve the confidence of the suggested associations (e.g. 3EG J or 3EG J) or disentangle the multiple contributions of certain EGRET sources (see, for example, 3EG J).
The use of the XMM-Newton public data introduces new biases. Exposures and instrument modes were not selected for a survey, but with completely different purposes (e.g. calibration, ToO, …). In the XMM-Newton archive there are many more pointings than the reported here: some were discarded because of problems in the processing of the observation data files (ODF), some others were not used because the instrument mode does not match the major part of the pointing of the same source555This is the case of Mkn 421, 3C 273, and PKS 2155-304, that are calibration sources. For the purposes of the present work, only the pointings with the PN detector in small window mode were used., or because the observations were still covered by the PI proprietary data rights at the time when the archive was scanned. In spite of observations, the present sample is made of only AGN. Three sources dominate: 3C with observations, PKS with , and Mkn with (see the observation log in Table 6).
The large differences in settings of the instrument modes between the individual observations had a particularly severe impact on the OM data (Table 12). It is not possible to have one single filter to be used as a reference for all the observations. In the best case, the magnitudes with filter UVW1 are available for of pointings. In one case only (PKS ), the optical counterpart of the blazar has a V magnitude (Courbin et al. 2002) and therefore is beyond the instrument capabilities.
| Name | / | |||
|---|---|---|---|---|
| (1) | (2) | (3) | (4) | (5) |
| Gal. | ||||
| AO | Gal. | |||
| PKS | Gal. | |||
| S5 | Gal. | |||
| S5 | ||||
| Mkn | Gal. | |||
| PKS | ||||
| ON | ||||
| 3C | Gal. | |||
| Cen A | ||||
| PKS | ||||
| PKS | Gal. | |||
| NGC | ||||
| PKS | ||||
| PKS | ||||
| Gal. |
| Name | / | |||
|---|---|---|---|---|
| (1) | (2) | (3) | (4) | (5) |
| Gal. | ||||
| AO | Gal. | |||
| PKS | Gal. | |||
| S5 | Gal. | |||
| S5 | ||||
| Mkn | Gal. | |||
| PKS | Gal. | |||
| ON | Gal. | |||
| 3C | Gal. | |||
| Gal. | ||||
| Cen A | ||||
| PKS | ||||
| PKS | ||||
| NGC | ||||
| PKS | ||||
| PKS | Gal. |
2.2 Common procedures of data analysis
For the processing, screening, and analysis of the data from the EPIC MOS1, MOS2 (Turner et al. 2001) and PN cameras (Strüder et al. 2001), standard tools have been used (XMM SAS v. 6.1.0 and HEAsoft v 6.0). The standard procedures described in Snowden et al. (2004) were followed. Only single pixel events have been selected, excluding border pixels or columns with higher offset. High-background flares affected the observations randomly, and in some cases it was necessary to filter the available data. Time intervals contaminated by flares have been excluded by extracting the whole detector lightcurve for keV and by removing the periods with count rates higher than s-1 for PN and s-1 for MOS, as suggested by Kirsh (2005).
The source spectra have been extracted from a circular region with a radius of and centered in the catalog (radio) position of the AGN. The background to be subtracted in the analysis was derived from a circular region, with the same radius, near the selected source. In the case of pile-up, the source region is an annulus with still an external radius of and an internal radius selected to minimize the pile-up effects by using the task epatplot of XMM SAS. It resulted for 3C and PKS , and for Mkn . For Cen A, the annulus has internal and external radii of size and , respectively.
Since PN is the most stable detector, with negligible degradation of performance to date, we adopted it as the prime instrument. Data from MOS cameras have been used only when it was necessary to check a finding obtained with the PN detector or to increase the statistics of a specific observation. For very bright sources (with fluxes of the order of erg cm-2 s-1 or more), only the PN data in small window mode have been analyzed.
The spectra were rebinned so that each energy bin contained a minimum of 20 counts and fit in the keV energy range for the PN detector and keV for MOS detectors, because of the uncertainties in the calibration and cross-calibration at lower energies (cf. Kirsch 2005). The fluxes and luminosities were calculated in the keV band by extrapolating the model spectrum with the command extend of xspec. The photon redistribution matrix and the related ancillary files were created appropriately with the rmfgen and arfgen tasks of XMM-SAS.
The data from the Optical Monitor (Mason et al. 2001) were also reprocessed with the latest version of SAS.
Through the paper, we report only the fits with reduced less than 2 () and we consider significant improvement in the fit with %. In the case of an added spectral component, we evaluated the improvement of the fit by the value (cf Protassov et al. 2002). All the quoted uncertainties in the parameters are at the % confidence level for 1 parameter (), unless otherwise stated.
3 Average spectra and comparisons with other catalogs
Most of the sources analyzed here are blazars, except for two radiogalaxies Fanaroff-Riley Type I (FRI), that are thought to be blazar-like sources seen at large viewing angles (Urry & Padovani 1995). Blazars display featureless X-ray continuum, occasionally with hints of breaks, curvature, or, more seldom, a soft excess (e.g. Giommi et al. 2002, Donato et al. 2005, Perlman et al. 2005). Radiogalaxies can have a much more complex environment at low energies (e.g. Evans et al. 2005, Grandi et al. 2005). However, since the main purpose of this work is to study and compare the continuum properties, we decided to fit the X-ray spectra with a redshifted power-law model (zpo in xspec; see Table 7) and a broken power law model (bknpo in xspec; see Table 8). The absorption can be fixed to the Galactic column density (Dickey & Lockman 1990) or fitted. Sometimes a more complex fit is necessary and is analyzed separately. More details on the fits are available in Appendix A (tables and notes on the individual sources).


Several of the sources analyzed here show significant variability, particularly on small time scales. Therefore, the comparison of average spectral parameters presented here (Table 2) and the values available in the BeppoSAX catalogues by Giommi et al. (2002) and Donato et al. (2005), can be considered a indicator of long term spectral variability, since XMM-Newton observations refer to the period and BeppoSAX data have been collected in the period . The spectra of the present work are generally best fitted with broken power law models (9/14 in Table 2 without PKS , that is fitted with both models), compared to only 4/14 sources in BeppoSAX data (Table 3, without 3C 273, that is fitted with both models). There is a possible important bias factor in BeppoSAX fits. The Italian-Dutch satellite concentrators LECS and MECS have energy bands overlapping at keV, where most of the blazars have the break energy. Therefore, it is also possible that – in some cases – the intercalibration constant between the two detectors could have “absorbed” some spectral shape variations, thus leading to prefer the single power law model. This could be the case of PKS , that is known to have an intervening system along the line of sight, but the BeppoSAX fit does not require an additional absorption.
In other cases, there are changes in the source state (e.g. AO , that in the present observation was found in outburst) or 3C , as already noted by Page et al. (2004). In the latter case, the blazar shows in the XMM-Newton data an increase of the break energy and a small softening of , the photon index at . Also Cen A shows a softer photon index and a flux lower by a factor of with respect to the BeppoSAX data analyzed in Grandi et al. (2003). In the two HBL (Mkn and PKS ), the broken power law model appears to be the simplification of a more complex curved model, as already noted by Brinkmann et al. (2001, 2003), Sembay et al. (2002), Ravasio et al. (2004).
Comparing the parameters in Table 2 with the larger catalogs by Giommi et al. (2002), Donato et al. (2005), Evans et al. (2005), Grandi et al. (2005) containing also radio-loud AGN not detected by EGRET, there are no signs of differences between ray loud and quiet AGN.
The analysis of the three most intensively observed sources is in agreement with the typical behaviour of these types of sources. Even though they require a broken power law model, to have an overall view of the source behaviour, we correlate the photon index of the single power law model with its normalization at keV. This gives an idea of the behaviour of the spectral shape with flux variations.
PKS shows a clear correlation (linear correlation coefficient for observations and ), with a hardening of the photon index with increasing flux (Fig. 1, bottom right) if one point is not considered (ObsID ). While the behaviour of most points can be explained by considering a flux increase with a constant synchrotron peak (implying a hardening of the spectrum), the outlying point can be explained as due to a frequency shift of the synchrotron peak. For this ObsID, OM data (Table 12) suggest a high flux level in the bands U, B, and V, but, again, available magnitudes are fragmentary and it is not possible to search for more stringent correlations.
The correlation in Mkn is poor ( for 6 points, ), although a general trend of spectral hardening with flux increasing can be noted (Fig. 1, bottom left).
3C shows instead a spectral softening with flux increasing (Fig. 1, top left, with 15 observations, ), although there is a non negligible scatter of the points, suggesting that other processes are playing important roles in this sources. Indeed, it is known that this blazar also has a Seyfert-like component that can be detected (Grandi & Palumbo 2004). Fig. 1 (top right) shows the equivalent width of the FeK line versus the photon index for both BeppoSAX observations (filled circles; data from Grandi & Palumbo 2004) and the present work (open squares; for XMM-Newton see Table 10). 3C was in a different state during the two satellites observations with only one point overlapping, when using the simultaneous BeppoSAX and XMM-Newton observation performed in June (ObsID , triangles in Fig. 1 top right) to cross-calibrate the respective instruments (cf Molendi & Sembay 2003). This strenghtens the validity of the other values obtained by the two satellites as indicating an effective change in the state of the source. The general trend can be understood, in the framework of the Grandi & Palumbo (2004) results on 3C and the more general picture on blazars outlined by Maraschi & Tavecchio (2003), as a weakening of the jet component and an increase of the Seyfert-like part. With respect to the BeppoSAX observations (), we noted in the XMM-Newton observations (), an increase of the “thermal” component and a softening of the hard photon index The former is indicated in the broken power law model by a shift to high energies of the break energy (see Table 2: the average value for XMM-Newton is keV compared to the BeppoSAX value of keV); in the blackbody plus power law model (Table 9) this is indicated by an increase of the temperature (from the average value of eV measured by BeppoSAX to eV derived from the data analyzed in the present work). This behaviour of the continuum is accompanied by an increase of the equivalent width of the (broad) iron emission line either at or keV (Fig. 1, top right). According to the results in Table 10, the major improvements in the fit occur with the detection of the (broad) iron line centered at or keV, but sometimes there is no detection at all. If we consider that the detection and the energy centroid are related to different degrees of ionization (see, for example, the review by Reynolds & Nowak 2003), the interpretation of the data still favours the hypothesis of an increase of the accretion around the SMBH. A more detailed spectral analysis is required to better assess the state variation of 3C , but this is outside the scope of the present work. However, the general trend outlined here is also confirmed by the radio data reported, for example, by Teräsranta et al. (2005) with observations at and GHz: there is a decreasing of activity from , with an outburst in , but smaller than in .
Another interesting case in the present sample is AO , that displays the typical characteristics of blazars in outburst. This should be compared with the negative detection of variability reported in the observations (Raiteri et al. 2005). A more detailed analysis of all the XMM-Newton data sets (both public and private) is available in Raiteri et al. (2006). In the present observation, the source displays a shift of the synchrotron peak (see the discussion in Section 6), with a hint of periodicity of s (significance ), but with a low quality factor, because of a limited number of cycles (). An inspection of the lightcurve suggests that this periodicity is transient: periodic flares appear during the activity phase of the source, while X-ray observations of the source in quiescence have detected constant flux and, obviously, no periodicities (Raiteri et al., 2006).
4 Intervening absorption
Torres et al. (2003) have suggested that gravitational microlensing can boost the ray flux. Therefore, we searched in the present sample for any presence of intervening systems of any type.
Damped Lyman (DLA) systems (see Wolfe et al. 2005 for a review) are present along the line of sight toward AO and PKS . In the case of AO (, Cohen et al. 1987), the intervening system is placed along the line of sight at (see, e.g., Raiteri et al. 2005 for a more recent discussion on this). This intervening system has been measured by ROSAT and ASCA obtaining a value of cm-2 (Madejski et al., 1996). In addition, Raiteri et al. (2005) measured a value of cm-2 with an XMM-Newton observation performed on January , . The present spectrum in the keV energy band for PN and the keV band for the two MOS detectors is the best fit with a broken power law model absorbed by the Galactic column together with one at redshift with cm-2. The low energy photon index is and the high-energy one is , with the break at keV, for a and dof (see also Appendix A).
PKS is another quasar with an additional absorber at along the line of sight, probably due to two late-type galaxies (Bergeron & Boissé 1991, Lane et al. 1998). The best fit model is the broken power law, with the absorption column of cm-2, the Galactic column, and no intrinsic absorption. Chandra observations reported the same absorption, but the continuum is best fitted with a single power law with (Bechtold et al. 2001).
The absorption in X-rays, in both the above cases, is lower than that measured from optical observations, but it can be due to different metallicity () or to the presence of dust with a ratio different from that in the Galaxy, that is common in DLA systems (Pei et al. 1991, Pettini et al. 1994). However, what is important in these systems is the presence of galaxies along the line of sight that can cause gravitational lensing effects, which in turn enhance the flux of the background blazar.
Another blazar (S5 ) presents an intervening system at , but optical observations by Stickel & Kühr (1993) indicated the presence of Mg II , which do not qualify this system as damped Lyman. The blazar spectrum, already quite hard, presents a spectral flattening at low energies. This type of flattening has been observed in other blazars at high redshift (; see, e.g., PMN J in Fabian et al. 2001 or on RBS in Piconcelli & Guainazzi 2005) and a few hypotheses have been invoked, like instrinsic absorption or intrinsic spectral properties. The best fit for S5 is that with the additional absorption at the redshift of the quasar and no improvements are obtained by adding an absorber at the redshift of the intervening system (). Therefore, it appears that this system is not responsible for the additional absorption or – at least – the present data do not allow us to separate the different components, if any. Radio observations by Hutchison et al. (2001) show that near the blazar core the polarization is very low with respect to typical values in other quasars. The authors explained this by the presence of an external environment surrounding the jet (a cocoon?). Such a plasma cocoon could act like the “warm absorber” of Seyferts and explain the spectral flattening at low energies. Yet another hypothesis is a low-energy cut-off in the relativistic electron distribution at , which would yield a flattening below , where is the peak frequency of the seed photon radiation field. These hypotheses are discussed in, e.g., Fabian et al. (2001).
Two more sources in the present sample show evidence of intrinsic absorption and are the two radiogalaxies (Cen A and NGC ). This is known to be due to the environment in the radiogalaxies (cf Evans et al. 2005, Grandi et al. 2005).
The last case of intervening systems is PKS (), that is gravitationally lensed by a galaxy at found by Wiklind & Combes (1996) through infrared observations of hydrocarbon absorption lines. The fit with a redshifted power law model absorbed by the Galactic column and the intervening system at , gives results consistent with previous X-ray analyses by Mathur & Nair (1997), Oshima et al. (2001), and De Rosa et al. (2005). The absorption due to the intervening system averaged over the three observations is cm-2 and the photon index is . However, some residuals at low energy are present and an improvement in the fit (with , , and for a decrease of two degrees of freedom, for the three observations respectively) can be obtained by adding a thermal plasma model (mekal) at the redshift of the blazar, with solar abundances and temperature keV. The absorption of the intervening system is slightly greater ( cm-2) and the photon index a little steeper (). This thermal plasma can be the “warm absorber” suggested by Fabian et al. (2001) to explain the X-ray deficit at low energies in high redshift blazars. Interestingly, the statistical best fit of these three XMM-Newton observations is obtained with a broken power law model and lower absorption (Table 8), thus suggesting that the low X-ray deficit could be due to something intrisic to the electron distribution.
5 X-ray spectral line features
The spectra of the AGN in the present sample sometimes show some features, but these are generally within deviations from the best fit model. For more significative detections (e.g. in PKS , known to be due to warm-hot intergalactic medium, see Cagnoni et al. 2004), we bypassed the problem with a proper selection of the energy band, since the study of these features is outside the aims of the present work. No evidence () of features linked to physical characteristic of any cosmic source is found in the present data set, except for the iron line complex of Cen A (see Table 11 and the note on this source in Appendix A) and some detections in 3C (Table 10). The latter is not always evident, although a forced fit with a broad iron line both neutral and ionized can give sometimes a non negligible improvement in the . The implications have been already discussed in the Sect. 3.
6 Spectral Energy Distributions and the blazar sequence
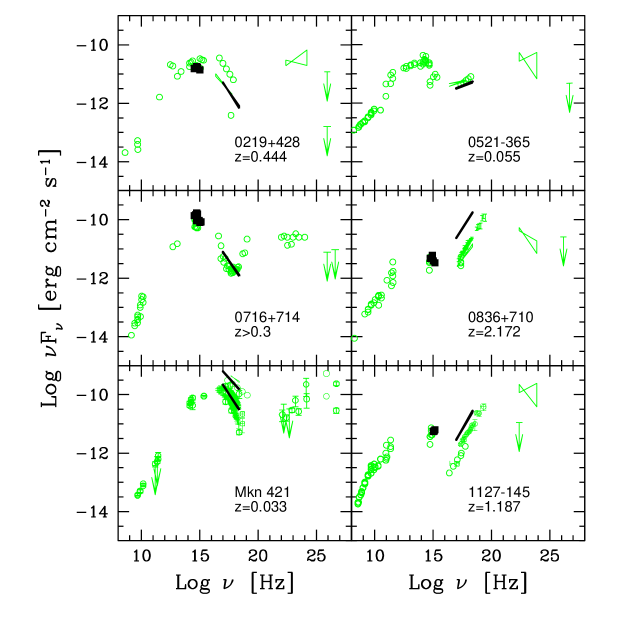
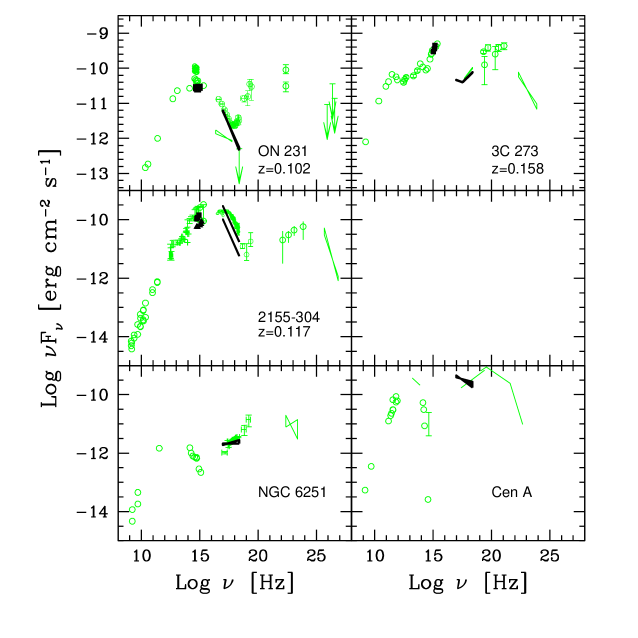
SED have been constructed and modelled to study the multiwavelength emission over a broad energy range. All but two (PKS and PKS ) of the blazars in the present sample have been studied in detail by Ghisellini et al. (1998), Tagliaferri et al. (2000), Ghisellini, Celotti & Costamante (2002). The radiogalaxies have been studied in Chiaberge et al. (2001, 2003), Guainazzi et al. (2003), Foschini et al. (2005), and Ghisellini et al. (2005). We refer to these papers and to the references therein. The SED with XMM-Newton data are reported in Fig. 4 and 5, together with the model of synchrotron and inverse Compton radiation (including self-Compton and external Compton) in a homogeneous region applied to the data. The results obtained do not change dramatically with respect to the above mentioned works.
There are however four cases, namely AO , PKS , PKS and PKS , which are worth investigating further. AO shows a clear shift in its peak frequency, as expected during flaring activities of blazars: the present XMM-Newton observation was performed when the source was in outburst (see Sect. ). PKS has been associated with an EGRET source only in the Third Catalog (Hartman et al. 1999), and therefore is missing in Ghisellini et al. (1998). PKS was never detected in X-rays and PKS is a gravitationally lensed system, also missing in Ghisellini et al. (1998).
| Parameter | AO | PKS | PKS | PKS | Units |
| cm | |||||
| cm | |||||
| erg s-1 | |||||
| Gauss | |||||
| degree | |||||
| erg s-1 | |||||
| cm | |||||
| erg cm-3 | |||||
| erg cm-3 | |||||
| erg s-1 | |||||
| erg s-1 | |||||
| erg s-1 | |||||
| erg s-1 |
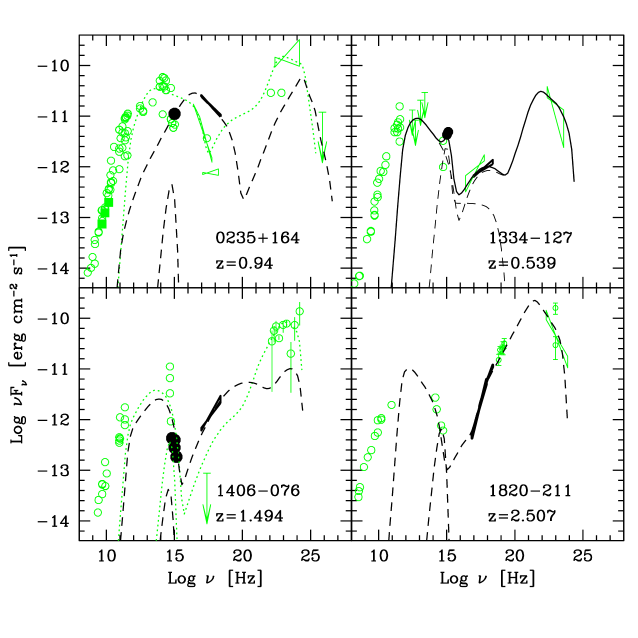
We therefore applied the same model used in Ghisellini, Celotti & Costamante (2002) in order to find out the physical parameters of the four sources. The main assumptions of the model can be summarized as follows: the geometry of the source is a cylinder – except for PKS , that is analyzed later – of radius and length, in the comoving frame, , where is the bulk Lorentz factor; is the viewing angle, the Doppler factor, and the magnetic field. The radiating particle distribution is assumed to be , where the value of depends on the value of of the injected particles. The injected power in the comoving frame is . The external seed photon field has a dimension and luminosity . It is assumed to mainly originate in a Broad Line Region or any other external source and it is calculated as a fraction of the disk luminosity (generally 10%). The magnetic and radiative energy densities are indicated with and , respectively. Electron, proton and radiation powers are represented by , , and , respectively.
Fig. 2 show the model with the SED, while in Table 4 we list the input and output parameters for the model. Only AO displays significant variability in the model parameters with respect to Ghisellini et al. (1998), but it continues to fulfill the requirements of the blazar sequence. PKS behaves as a typical FSRQ.
The X-ray emission of PKS is modelled as due to the inverse Compton emission from synchrotron seed photons, although this source is a FSRQ. An external source of seed photons is needed to generate rays in the EGRET energy band (not simultaneous data) and there is an apparent anti-correlation between X-ray and optical/UV emission: indeed, this first X-ray detection is simultaneous with low optical flux, while archival data (not simultaneous) report higher optical flux and only an upper limit in X-rays (for more details, see the note on this source in the Appendix). This does not allow us to claim an anti-correlation.
In the case of PKS , there are some problems that should be taken into account: the magnification effects of the gravitational lensing are still uncertain (cf Oshima et al. 2001 and Courbin et al. 2002) and so as the absorption, both due to the Galactic column (the source is apparently located at low Galactic latitude, with Galactic coordinates and ) and to the intervening system. Therefore, instead of making hypotheses about the quantity and quality of corrections to be applied, we decided to analyze the observed SED without any correction. This means that the anomalies in the parameters of PKS (Table 4) reflect the uncertainties in the magnification and the absorption. For example, the needed necessary for the external Compton contribution was calculated as % of the disk luminosity, while for the three other blazars a value of % was taken. A proper dereddening could result in the needed optical flux, without invoking an increase of percentage of the disk luminosity.
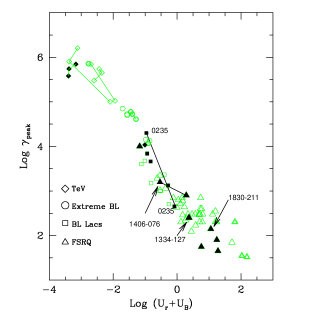
The location of the sources analyzed here in the blazar sequence can be seen in Fig. 3, where we show , the Lorentz factor of the electrons radiating mostly at the peak of the SED, versus , the radiation plus magnetic energy density in the comoving frame. Fig. 3 has been updated by adding 3 new BL Lac recently detected in the TeV range (see Aharonian et al. 2005a, 2005b). These new TeV BL Lacs, namely 1ES (cf also Wolter et al. 2000), PKS , and H , lie in the “high energy branch” defined by the BL Lacs previously detected in the TeV band. Interestingly, PKS moved toward the region of the BL Lac region, while the previous modeling – with only an upper limit in X-rays – placed this FSRQ in the region typical of these sources.
| Source | Conf. | |||
|---|---|---|---|---|
| (1) | (2) | (3) | (4) | (5) |
| 3C | high | |||
| NGC | low | |||
| PKS | low | |||
| Cen A | high |
The presence of two radiogalaxies in the present sample suggests some hints about the paradigm of the unification of radio-loud AGN (Urry & Padovani 1995), of which the ray loud AGN are the subclass analyzed in this work. This paradigm and the theories on the blazar evolution (see Böttcher & Dermer 2002, Cavaliere & D’Elia 2002, Maraschi & Tavecchio 2003) find analogies between BL Lac and FRI on one side and FSRQ and FRII on the other. BL Lac and FRI are evolved AGN, with low emission from the environment around the SMBH, while FSRQ and FRII are instead young sources with a rich environment.
With reference to the ray propagation from the source to the observer, one of the most important factor is the beaming factor , that allow high energy photons to escape from the source without disappearing in pair production. From the SED of the ray loud AGN reported in Ghisellini et al. (1998, 2005), Chiaberge et al. (2001, 2003), Foschini et al. (2005), complemented and confirmed by this work, we see that the values for almost all the EGRET detected AGN are above , with only a few exceptions. 3C with and Cen A with are also the only AGN with detected by EGRET with high confidence. PKS () and NGC () have low confidence identifications, that should be confirmed. The two of the low confidence detections are in between 3C and Cen A, which are instead detected at high confidence level. Therefore, there should be other reasons to explain the EGRET detections. Indeed, three of the four above sources have also the lowest intrinsic luminosities in the present sample (and also among the whole EGRET sample), but not the fluxes (cf Table 5). This implies that the present definition of ray loudness – that it is defined here simply as the detection at MeV – is still strongly biased by the instrument sensitivity or by the distance of the source.
Moreover, there is another key point still missing in this picture: ray detection of FRII radiogalaxies, that are still completely missing to date even in the list of hypothetical associations.
7 Final remarks
A small sample of AGN ray loud (i.e. detected by the EGRET instrument on board CGRO) observed by XMM-Newton has been analyzed in a homogeneous way and presented here. The sample is composed of 15 AGN divided into 7 FSRQ, 4 LBL, 2 HBL, and 2 FRI radiogalaxies. All the data were taken from the public archive of XMM-Newton: 46 pointings were analyzed, of which 30 are of three sources only (3C , Mkn , PKS ).
Despite these limitations, some useful inferences can be made. Indeed, with XMM-Newton it is possible to perform simultaneous X-ray and optical/UV observations, that can be particularly useful in blazars to place reliable constraints on the synctrotron and inverse Compton peaks in the SED.
The main findings can be summarized as follows: all the blazars obey the sequence suggested by Ghisellini et al. (1998) and Fossati et al. (1998). The only X-ray features found in the present sample are the emission lines of the iron complex in Cen A and in 3C . In the case of Cen A, the iron line at keV ( eV) is known to be due to the transmission of radiation along the dust lane warped around Cen A, while in 3C , the broad iron line can be associated with the Seyfert-like component.
The comparison with BeppoSAX data show a preference of the broken power law model over the single power law; the latter was often the best fit in the BeppoSAX catalog, suggesting a long term change in the sources. The changes in the spectra of 3C appear to be genuinely due to a variation in the state of the source, as well as in the case of AO , observed during an outburst.
Four sources show intervening systems along the line of sight, but only one case is known to be gravitationally lensed. In the remaining three cases, it is not clear if the intervening galaxies can generate gravitational effects strong enough to enhance the ray loudness. See Torres et al. (2003) for a discussion on this topic.
The SED compiled in the present sample confirm the model parameters already found in previous studies and increase the number of modelled sources. However, PKS shows some particular features and deserves further investigation. Four sources appear to be the key to understand the transition (with respect to ray loudness) from blazars to radiogalaxies, namely 3C , PKS , NGC , and Cen A. The first two are FSRQ with the largest jet viewing angle, which in turn means the lowest among the blazars. The latter two are the (only) radiogalaxies detected by EGRET. Further and more detailed studies on these four sources could give important contributions to the comprehension of the mechanisms acting to generate rays, of the unification models of AGN, and to the improvement of the resolution of the extragalactic ray background.
Acknowledgements.
LF thanks G.G.C. Palumbo, P. Grandi and M. Dadina for useful discussions and S.R. Rosen of the OM Team for useful hints in the OM data analysis. We thank also the referee, X. Barcons, for useful comments, that helped to improve the manuscript. This research has made use of the NASA’s Astrophysics Data System Abstract Service and of the NASA/IPAC Extragalactic Database (NED), which is operated by the Jet Propulsion Laboratory, California Institute of Technology, under contract with the National Aeronautics and Space Administration. This work was partly supported by the European Community’s Human Potential Programme under contract HPRN-CT-2002-00321 and by the Italian Space Agency (ASI).References
- (1) Aharonian F., Akhperjanian A.G., Aye K.M., et al., 2005a, A&A 436, L17
- (2) Aharonian F., Akhperjanian A.G., Bazer-Bachi A.R., et al., 2005b, submitted to Nature, (astro-ph/0508073)
- (3) Bechtold J., Siemiginowska A., Aldcroft T.L., et al., 2001, ApJ 562, 133
- (4) Bergeron J. & Boissé P., 1991, A&A 243, 344
- (5) Birkinshaw M., Worrall D.M. & Hardcastle M.J., 2002, MNRAS 335, 142
- (6) Böttcher M. & Dermer C.D., 2002, ApJ 564, 86
- (7) Böttcher M., Harvey J., Joshi M., et al., 2005, ApJ 631, 169
- (8) Brinkmann W., Sembay S., Griffits R.G., et al., 2001, A&A 365, L162
- (9) Brinkmann W., Papadakis I.E., den Herder J.W.A. & Haberl F., 2003, A&A 402, 929
- (10) Cagnoni I., Nicastro F., Maraschi L., Treves A. & Tavecchio F., 2004, ApJ 603, 449
- (11) Cappi M., Matsuoka M., Comastri A., et al., 1997, ApJ 478, 492
- (12) Cavaliere A. & D’Elia V., 2002, ApJ 571, 226
- (13) Chiaberge M., Capetti A. & Celotti A., 2001, MNRAS 324, L33
- (14) Chiaberge M., Gilli R., Capetti A. & Macchetto F.D., 2003, ApJ 597, 166
- (15) Cohen R.D., Smith H.E., Junkkarinen V.T. & Burbidge E.M., 1987, ApJ 318, 577
- (16) Courbin F., Meylan G., Kneib J.P. & Lidman C., 2002, ApJ 575, 95
- (17) Courvoisier T.J.-L., Beckmann V., Bourban G., et al., 2003, A&A 411, L343
- (18) Croston J.H., Hardcastle M.J., Birkinshaw M. & Worrall D.M., 2003, MNRAS, 346, 1041
- (19) Danziger I.J., Fosbury R.A.E., Goss W.M. & Ekers R.D., 1979, MNRAS 188, 415
- (20) De Rosa A., Piro L., Tramacere A., et al., 2005, A&A 438, 121
- (21) Dickey J.M. & Lockman F.J., 1990, ARA&A 28, 215
- (22) Donato D., Sambruna R.M. & Gliozzi M., 2005, A&A 433, 1163
- (23) Edelson R., Griffiths G., Markowitz A., et al., 2001, ApJ 554, 274
- (24) Evans D.A., Kraft R.P., Worrall D.M., et al., 2004, ApJ 612 786
- (25) Evans D.A., Worrall D.M., Hardcastle M.J., Kraft R.P. & Birkinshaw M., 2005, ApJ, accepted for publication (astro-ph/0512600)
- (26) Fabian A.C., Celotti A., Iwasawa K., et al., 2001, MNRAS 323, 373
- (27) Fang T., Marshall H.L., Bryan G.L. & Canizares C.R., 2001, ApJ 555, 356
- (28) Foschini L., Chiaberge M., Grandi P., et al., 2005, A&A, 433, 515
- (29) Foschini L., Ghisellini G., Raiteri C.M., et al., 2006, Proceedings of “The X-ray Universe”, ed. A. Wilson, ESA SP-604, p. 615 (astro-ph/0510793)
- (30) Fossati G., Maraschi L., Celotti A., Comastri A. & Ghisellini G., 1998, MNRAS 299, 433
- (31) Ghisellini G., 2004, Nuclear Physics B Proceedings Supplements 132, 76
- (32) Ghisellini G., Celotti A., Fossati G., Maraschi L. & Comastri A., 1998, MNRAS 301, 451
- (33) Ghisellini G., Celotti A. & Costamante L., 2002, A&A 386, 833
- (34) Ghisellini G., Tavecchio F. & Chiaberge M., 2005, A&A 432, 401
- (35) Giommi P., Capalbi M., Fiocchi M., et al., 2002, Proceedings of Blazar Astrophysics with BeppoSAX and Other Observatories, eds P. Giommi, E. Massaro, G.G.C. Palumbo, ASI Science Data Center and ESA-ESRIN, p. 63 (astro-ph/0209596)
- (36) Giommi P., Colafrancesco S., Cavazzuti E., Perri M., Pittori C., 2006, A&A 445, 843
- (37) Gliozzi M., Sambruna R.M., Brandt W.N., et al., 2004, A&A 413, 139
- (38) Grandi P., Fiocchi M., Perola C.G., et al., 2003, ApJ 593, 160
- (39) Grandi P. & Palumbo G.G.C., 2004, Science 306, 998
- (40) Grandi P., Malaguti G. & Fiocchi M., 2005, ApJ, accepted for publication (astro-ph/0511784)
- (41) Guainazzi M., Grandi P., Comastri A. & Matt G., 2003, A&A 410, 131
- (42) Hardcastle M.J., Worrall D.M. & Birkinshaw M., 1999, MNRAS 305, 246
- (43) Hartman R.C., Bertsch D.L., Bloom S.D., et al., 1999, ApJS 123, 79
- (44) Hutchison J.M., Cawthorne T.V. & Gabuzda D.C., 2001, MNRAS 321, 525
- (45) Jansen F., Lumb D., Altieri B., et al., 2001, A&A 365, L1
- (46) Junkkarinen V.T., Cohen R.D., Beaver E.A., et al., 2004, ApJ 614, 658
- (47) Kirsch M., 2005. EPIC status of calibration and data analysis. XMM-SOC-CAL-TN-0018, v. 2.4, 11 February 2005.
- (48) Kuiper L., Hermsen W., Verbunt F., et al., 2000, A&A 359, 615
- (49) Lamb R.C. & Macomb D.J., 1997, ApJ 488, 872
- (50) Lane W., Smette A., Briggs F., et al., 1998, AJ 116, 26
- (51) Landt H., Perlman E.S. & Padovani P., 2006, ApJ, 637, 183
- (52) Lidman C., Courbin F., Meylan G., et al., 1999, ApJ 514, L57
- (53) Madejski G., Takahashi T., Tashiro M., et al., 1996, ApJ 459, 156
- (54) Malizia A., Bassani L., Dean A.J., et al., 2000, ApJ 531, 642
- (55) Maraschi L., Ciapi A., Fossati G., Tagliaferri G. & Treves A., 1995a, ApJ 443, 29
- (56) Maraschi L., Fossati G., Tagliaferri G. & Treves A., 1995b, ApJ 443, 578
- (57) Maraschi L., Tavecchio F., Cagnoni I., et al., 2002, In: New Visions of the X-ray Universe in the XMM-Newton and Chandra era. ESA-ESTEC, 2001 (astro-ph/0202418)
- (58) Maraschi L. & Tavecchio F., 2003, ApJ 593, 667
- (59) Mason K.O., Breeveld A., Much R., et al., 2001, A&A 365, L36
- (60) Mathur S. & Nair S., 1997, ApJ 484, 140
- (61) Molendi S. & Sembay S., 2003, Assessing the EPIC spectral calibration in the hard band with 3C 273 observation. XMM-SOC-CAL-TN-0036, March 2003.
- (62) Mukherjee R., Halpern J., Mirabal N. & Gotthelf E.V., 2002, ApJ 574, 693
- (63) Oshima T., Mitsuda K., Ota N., et al., 2001, ApJ 551, 929
- (64) Padovani P., Perlman E.S., Landr H., Giommi P. & Perri M., 2003, ApJ 588, 128
- (65) Page K.L., Turner M.J.L., Done C., et al., 2004, MNRAS 349, 57
- (66) Pei Y.C., Fall S.M. & Bechtold J., 1991, ApJ 378, 6
- (67) Pettini M., Smith L.J., Hunstead R.W. & King D.L., 1994, ApJ 426, 79
- (68) Perlman E., Madejski G., Georganopoulos M., et al., 2005, ApJ 625, 727
- (69) Pian E., Falomo R., Ghisellini G., et al., 1996, ApJ 459, 169
- (70) Pian E., Vacanti G., Tagliaferri G., et al., 1998, ApJ 492, L17
- (71) Pian E., Foschini L., Beckmann V., et al., 2005, A&A 429, 427
- (72) Piconcelli E. & Guainazzi M., 2005, A&A 442, L53
- (73) Protassov R., van Dyk D.A., Connors A., et al., 2002, ApJ 571, 545
- (74) Raiteri C.M., Villata M., Aller H.D., et al., 2001, A&A 377, 396
- (75) Raiteri C.M., Villata M., Tosti G., et al., 2003, A&A 402, 151
- (76) Raiteri C.M., Villata M., Ibrahimov M.A., et al., 2005, A&A 438, 39
- (77) Raiteri C.M., Villata M., Kadler M., et al., 2006, A&A, accepted for publication (astro-ph/0603364)
- (78) Ravasio M., Tagliaferri G., Ghisellini G. & Tavecchio F., 2004, A&A 424, 841
- (79) Reynolds C.S. & Nowak M.A., 2003, Physics Reports 377, 389
- (80) Sambruna R.M., Maraschi L. & Urry C.M., 1996, ApJ 463, 424
- (81) Sambruna R.M., Gliozzi M., Donato D., et al., 2004, A&A 414, 885
- (82) Sbarufatti B., Treves A., Falomo R., 2005, ApJ 635, 173
- (83) Sembay S., Edelson R., Markowitz A., et al., 2002, ApJ 574, 634
- (84) Siebert J., Brinkmann W., Drinkwater M.J., et al., 1998, MNRAS 301, 261
- (85) Siemiginowska A., Bechtold J., Aldcroft T.L., et al. 2002, ApJ 570, 543
- (86) Snowden S., Still M., Harrus I. et al., 2004. An introduction to XMM-Newton data analysis. Version 2.01, 23 July 2004.
- (87) Sowards-Emmerd D., Romani R.W. & Michelson P., 2003, ApJ 590, 109
- (88) Sowards-Emmerd D., Romani R.W., Michelson P. & Ulvestad J.S., 2004, ApJ 609, 564
- (89) Sowards-Emmerd D., Romani R.W., Michelson P., et al., 2005, ApJ 626, 95
- (90) Stanghellini C., O’Dea C.P., Dallacasa D., et al., 1998, A&ASS 131, 303
- (91) Stanghellini C., 2003, PASA 20, 118
- (92) Stickel M. & Kühr H., 1993, A&AS 100, 395
- (93) Strong A.W., Moskalenko I.V., Reimer O., 2004, ApJ 613, 956
- (94) Strüder L., Briel U., Dennerl K., et al., 2001, A&A 365, L18
- (95) Swanenburg B.N., Hermsen W., Bennett K., et al., 1978, Nature 275, 298
- (96) Tagliaferri G., Ghisellini G., Giommi P., et al., 2000, A&A 354, 431
- (97) Tagliaferri G., Ghisellini G. & Ravasio M., 2002, Proceedings of Blazar Astrophysics with BeppoSAX and Other Observatories, eds P. Giommi, E. Massaro, G.G.C. Palumbo, ASI Science Data Center and ESA-ESRIN, p. 11 (astro-ph/0207017)
- (98) Tagliaferri G., Ravasio M., Ghisellini G., et al., 2003, A&A 400, 477
- (99) Tavecchio F., Maraschi L., Ghisellini G., et al., 2000, ApJ 543, 535
- (100) Tavecchio F., Maraschi L., Ghisellini G., et al., 2002, ApJ 575, 137
- (101) Teräsranta H., Wiren S., Koivisto P., Saarinen V., & Hovatta T., 2005, A&A 440, 409
- (102) Thompson D.J., Bertsch D.L., Dingus B.L., et al., 1995, ApJS 101, 259
- (103) Tingay S.J. & Edwards P.G., 2002, AJ 124, 652
- (104) Torres D.F., Romero G.E., Eiroa E.F., Wambsganss J. & Pessah M.E., 2003, MNRAS 339, 335
- (105) Turner M.J., Abbey A., Arnaud M., et al., 2001, A&A 365, L27
- (106) Ulrich M.-H., Maraschi L., & Urry C.M., 1997, ARA&A 35, 445
- (107) Urry C.M. & Padovani P., 1995, PASP 107, 803
- (108) von Montigny C., Bertsch D.L., Chiang J., et al., 1995, ApJ 440, 525
- (109) Wagner S.J., & Witzel A., 1995, ARA&A 33, 163
- (110) Wiklind T. & Combes F., 1996, Nature 379, 11
- (111) Wolfe A.M., Gawiser E. & Prochaska J.X., 2005, ARA&A 43, 861
- (112) Wolter A., Tavecchio F., Caccianiga A., Ghisellini G. & Tagliaferri G., 2000, A&A 357, 429
- (113) Zhang Y.H., Treves A., Celotti A., Qin Y.P. & Bai J.M., 2005, ApJ 629, 686
Appendix A Notes on individual sources, tables and SED
We report in this Appendix the tables with the Observation log (Table 6), the fit with the simple power law model (Table 7), the broken power law model (Table 8), the additional fits for 3C (Table 9 and 10) and Cen A (Table 11) and the magnitudes with different filters of the Optical Monitor (Table 12). Some notes on the individual sources and the SED of the sources not reported in Sect. 6 (Fig. 4 and 5) complete this Appendix.
| Name | ObsID | Date | MOS1 | MOS2 | PN | Position |
|---|---|---|---|---|---|---|
| (1) | (2) | (3) | (4) | (5) | (6) | (7) |
| FF(10) | FF(10) | FF(11.0) | ||||
| AO | FF(19) | FF(19) | FF(15.0) | |||
| PKS | SW(31.3) | FF(31.3) | FF(27.1) | |||
| S5 | SW(31) | FF(31) | TIMING | |||
| S5 | SW(23.8) | SW(23.8) | FF(24.6) | |||
| Mkn | SW | SW | SW(24.2) | |||
| SW | SW | SW(25.6) | ||||
| SW | SW | SW(23.4) | ||||
| SW | SW | SW(25.7) | ||||
| TIMING | SW | SW(25.3) | ||||
| SW | SW | SW(17.4) | ||||
| PKS | FF(13.9) | FF(13.7) | FF(10.7) | |||
| ON | FF(33.1) | FF(32.6) | FF(26.7) | |||
| 3C | SW | SW | SW(39.7) | |||
| SW | SW | SW(20.8) | ||||
| SW | SW | SW(21.0) | ||||
| SW | SW | SW(42.5) | ||||
| SW | SW | SW(62.0) | ||||
| TIMING | SW | SW(3.5) | ||||
| TIMING | SW | SW(3.5) | ||||
| TIMING | SW | SW(3.5) | ||||
| TIMING | SW | SW(3.5) | ||||
| SW | SW | SW(6.0) | ||||
| TIMING | SW | SW(3.5) | ||||
| TIMING | SW | SW(3.9) | ||||
| TIMING | SW | SW(5.6) | ||||
| TIMING | SW | SW(5.9) | ||||
| SW | SW | SW(13.9) | ||||
| Cen A | FF(22.8) | FF(22.8) | FF(16.8) | |||
| FF(13.2) | FFb | FF(7.9) | ||||
| PKS | FF(13.5) | FF(13.5) | FF(10.9) | |||
| PKS | FF(7.8) | FF(10.0) | FF(7.3) | |||
| FF(5.6) | FF(5.8) | FF(3.6) | ||||
| NGC | FF(18.0) | FF(18.0) | FF(8.0) | |||
| PKS | FF(7.0) | FF(7.6) | FF(2.8) | |||
| FF(31.0) | FF(31.0) | FF(27.0) | ||||
| FF(18.5) | FF(18.5) | FF(13.0) | ||||
| PKS | TIMING | SW | SW(41.6) | |||
| TIMING | SW | SW(40.2) | ||||
| TIMING | SW | SW(40.8) | ||||
| SW | SW | SW(31.2) | ||||
| SW | SW | SW(22.3) | ||||
| SW | SW | SW(39.8) | ||||
| SW | SW | SW(18.7) | ||||
| SW | SW | SW(20.0) | ||||
| SW | SW | SW(28.0) |
-
a
Only PN data have been analyzed, because the high flux of the source caused strong pile-up.
-
b
MOS2 not used, because of a series of bad pixels in the source PSF.
3EG J0222+4253 (0219+428, 3C 66A): The counterpart of this EGRET source is the BL Lac , although Kuiper et al. (2000) have proposed that the flux below MeV is significantly contaminated by the nearby pulsar PSR J. 3C A was extensively monitored from radio to very high rays during (Böttcher et al. 2005) and no significant X-ray variability was detected. The present XMM-Newton data set was affected by a high background, but it is possible to use more than % of the observation. The fit of the spectrum of this BL Lac object with an absorbed power law model is acceptable (see Table 7), although there are residuals for energies greater than keV. The broken power law model provides the best fit with a confidence % with a f-test. This observation has been studied by Croston et al. (2003) and the fit with a simple power law absorbed by the Galactic is consistent with the present results. However, significant differences are present in the fit with the broken power law model: this can be understood by taking into account that in the present analysis a more conservative selection of events has been used (for example, this can be clearly inferred by comparing the PN exposures: ks in the present analysis vs ks in the analysis of Croston et al., 2003).
| Name | /dof | |||||
|---|---|---|---|---|---|---|
| (1) | (2) | (3) | (4) | (5) | (6) | (7) |
| Gal. | ||||||
| AO | Gal. | |||||
| PKS | Gal. | |||||
| S5 | Gal. | |||||
| S5 | ||||||
| Mkn | ||||||
| PKS | ||||||
| ON | ||||||
| 3C | Gal. | |||||
| Gal. | ||||||
| Gal. | ||||||
| Gal. | ||||||
| Gal. | ||||||
| Gal. | ||||||
| Gal. | ||||||
| Gal. | ||||||
| Gal. | ||||||
| Gal. | ||||||
| Gal. | ||||||
| Gal. | ||||||
| Gal. | ||||||
| Gal. | ||||||
| Gal. | ||||||
| Cen Ae | ||||||
| PKS | ||||||
| PKS | Gal. | |||||
| Gal. | ||||||
| NGC | ||||||
| PKS | ||||||
| PKS | ||||||
| Gal. | ||||||
-
a
Only MOS1+MOS2, since the PN was set in TIMING. Lower limit of luminosity calculated for .
-
b
Additional absorber placed at the redshift of the source (wa*zwa(zpo) model in xspec).
-
c
Fit in the keV energy range and extrapolation to keV for flux and luminosity calculations.
-
d
Additional redshifted absorber (wa*zwa(zpo) model in xspec) along the line of sight.
-
e
Fit in the keV energy range, without keV energy band, because of complex features in the low energy part and in the iron emission line complex.
| Name | /dof | ||||||||
|---|---|---|---|---|---|---|---|---|---|
| (1) | (2) | (3) | (4) | (5) | (6) | (7) | (8) | (9) | (10) |
| Gal. | |||||||||
| AO | Gal. | ||||||||
| PKS | Gal. | ||||||||
| S5 | Gal. | ||||||||
| S5 | Gal. | - | |||||||
| Mkn | Gal. | ||||||||
| Gal. | |||||||||
| Gal. | |||||||||
| Gal. | |||||||||
| Gal. | |||||||||
| Gal. | |||||||||
| PKS | |||||||||
| ON | Gal. | ||||||||
| 3C | Gal. | ||||||||
| Gal. | |||||||||
| Gal. | |||||||||
| Gal. | |||||||||
| Gal. | |||||||||
| Gal. | |||||||||
| Gal. | |||||||||
| Gal. | |||||||||
| Gal. | |||||||||
| Gal. | |||||||||
| Gal. | |||||||||
| Gal. | |||||||||
| Gal. | |||||||||
| Gal. | |||||||||
| Gal. | |||||||||
| Cen A | - | ||||||||
| - | |||||||||
| PKS | Gal. | ||||||||
| PKS | |||||||||
| NGC | |||||||||
| PKS | |||||||||
| PKS | Gal. | ||||||||
| Gal. | |||||||||
| Gal. | |||||||||
| Gal. | |||||||||
| Gal. | |||||||||
| - | |||||||||
| - | |||||||||
-
a
Only MOS1+MOS2, since the PN was set in TIMING. Lower limit of luminosity calculated for .
-
b
Fit in the keV energy range and extrapolation to keV for flux and luminosity calculations.
-
c
Additional redshifted absorber (wa*zwa(bknpo) model in xspec) along the line of sight.
| /dof | ||||||
|---|---|---|---|---|---|---|
| (1) | (2) | (3) | (4) | (5) | (6) | (7) |
| keV | keV | ||||||
|---|---|---|---|---|---|---|---|
| keV | keV | keV | keV | ||||
| (1) | (2) | (3) | (4) | (5) | (6) | (7) | (8) |
| EqW1 | ||
|---|---|---|
| - | ||
| - | ||
| - | ||
| EqW2 | - | |
| /dof | ||
![[Uncaptioned image]](/html/astro-ph/0603268/assets/x7.png)
| Name | V | B | U | UVW1 | UVM2 | UVW2 |
|---|---|---|---|---|---|---|
| (1) | (2) | (3) | (4) | (5) | (6) | (7) |
| AO | ||||||
| PKS | ||||||
| S5 | ||||||
| S5 | ||||||
| Mkn | ||||||
| PKS | ||||||
| ON | ||||||
| 3C | ||||||
| Cen A∗ | ||||||
| PKS | ||||||
| PKS | ||||||
| NGC | ||||||
| PKS | ||||||
| PKS | ||||||
-
∗
Source beyond the capabilities of OM: too faint or too bright.
3EG J0237+1635 (AO 0235+164): The data set analyzed here refers to an observation performed in and shows no signs of high background. The epatplot task of XMM SAS shows a slight excess of double pixels events and a corresponding deficit of single pixel events (pile-up), that can be easily suppressed by removing the inner region with radius. The fit can improve significantly by reducing the energy band to keV, that is by removing the energy band that can be affected by the absorption and the fit reported in Tables 7 and 8 refer to this case. The best fit is still obtained with the broken power law model with the absorption column fixed to the Galactic value, although the is slightly harder than the above mentioned case.
3EG J0530-3626 (PKS 0521-365): The blazar PKS has been associated with the EGRET source in the Second Catalog (Thompson et al. 1995), but a stronger detection in the Cycle 4 placed this blazar outside the % probability contours. Sowards-Emmerd et al. (2004) suggested that the counterpart of 3EG J source could be another radio source (PMN J) of unknown nature. This can be another case of a possible double source not resolved by EGRET (like, e.g. 3EG J), an interesting target worth observing with GLAST. In the present work, we keep as valid the association with PKS . The XMM-Newton observation is analyzed here for the first time. There is no evidence of high background, but the epatplot task shows that the data are affected by pile-up. This blazar has a small jet (), visible in radio (see Tingay & Edwards 2002 for a description of the parsec scale structure), and optical wavelenghts (Danziger et al. 1979). Chandra detected a jet-like feature of -size, spatially coincident with the optical and radio structure (Birkinshaw et al. 2002). Hardcastle et al. (1999) and Birkinshaw et al. (2002) reported also the presence of extended emission that can be fitted with thermal plasma model with keV and . Given the size of the PSF of EPIC camera on board XMM-Newton ( HEW, see Jansen et al. 2001), the above mentioned structures are not resolved. Attempts to fit the low energy part with a thermal plasma model (mekal or raymond models in xspec, not reported in the Tables), resulted in a improved with respect to the simple power law ( for a decrease of dof), but still worse than the broken power law model. The broken power law model absorbed by the Galactic column provides the best fit to the present data, consistent with the results obtained by Einstein, EXOSAT (Pian et al. 1996), ROSAT (Pian et al. 1996, Hardcastle et al. 1999), BeppoSAX (Tavecchio et al. 2002).
3EG J0721+7120 (S5 0716+714): This BL Lac object is known for its extreme variability, also at intraday time scales (cf Wagner & Witzel 1995), and it is extensively monitored by optical and radio ground telescopes (see, e.g. Raiteri et al. 2003). The present observation was performed simultaneously with the end of a ToO of INTEGRAL, triggered after an optical giant flare (Pian et al. 2005). The optical lightcurve started to increase at the end of March 2004, and the trigger was activated on March. The INTEGRAL ToO was performed from to April, when the source activity was already declining. The XMM-Newton observation covered instead the period April. The X-ray lightcurve shows a clear decrease of the flux as the observation proceeded, confirming that the source was observed during the tail of the flare. More details on this XMM-Newton data set are presented in a separate paper (Foschini et al., submitted).
3EG J0845+7049 (S5 0836+710): This flat-spectrum radio quasar has one of the highest redshifts among the objects in the present sample. The XMM-Newton data, published here for the first time, show high background. Past analyses of ROSAT and ASCA data by Cappi et al. (1997) and BeppoSAX data by Tavecchio et al. (2000) have shown a spectrum with a hard photon index (), with acceptable fit also with a broken power law, but some inconsistencies in the value of the absorption. The present data are best fitted with a simple power law model absorbed by the Galactic column plus an additional absorber at the redshift of the quasar with a value cm-2, consistent with the ASCA and BeppoSAX values. This is also consistent with Chandra observations by Fang et al. (2001), who found ( keV), but a slightly lower absorption cm-2 (not redshifted). The photon index is also consistent with the value of in the keV energy band measured by INTEGRAL (Pian et al. 2005) and the value of measured by CGRO with OSSE and BATSE instruments (Malizia et al. 2000). The broken power law gives also a good fit, although with no improvement with respect to the simple power law model, but does not require the additional absorber.
3EG J1104+3809 (Mkn 421): This is one of three sources in the present sample that has been extensively observed, being a calibration target (the others are 3C and PKS ). observations are present in the XMM-Newton data archive, but for sake of homogeneity in the present analysis, we selected only the observations with EPIC PN in small window mode. We refer the reader to the several papers published with more detailed analysis of Mkn data with different observing modes (e.g. Brinkmann et al. 2001, 2003, Sembay et al. 2002, Ravasio et al. 2004).
3EG J1134-1530 (PKS 1127-145): This source is in the list of Gigahertz-Peaked Sources (GPS) by Stanghellini et al. (1998), Stanghellini (2003). The present XMM-Newton data set has never been published. It shows high background, but, once cleaned of soft-proton flares, it is possible to extract useful information. This source also has a -sized jet, observed in X-rays with Chandra (Siemiginowska et al. 2002), but that is still too small for the PSF size of EPIC.
3EG J1222+2841 (ON 231): This is another EGRET source that could be composed of two or more contributions: indeed, although ON is outside the global % probability contours of 3EG J, there is a strong association with the emission at GeV (Lamb & Macomb 1997). The present XMM-Newton data set has never been analysed and shows evidence of high background towards the end of the observation. The broken power law model provides the best fit to the data. An absorption in addition to the Galactic column is marginally detected. The values are consistent with, although slightly different to the fit to the BeppoSAX data of an observation in , when ON was in outburst (Tagliaferri et al. 2000).
3EG J1229+0210 (3C 273): For historical reasons, 3C is one of the most observed sources in the sky, and XMM-Newton spent a lot of time observing this quasar (3C is also a calibration source). We refer the reader to the works by Molendi & Sembay (2003), Courvoisier et al. (2003) and Page et al. (2004) for more details in the analysis of the XMM-Newton data sets. There is a general agreement between the analysis presented here and the above cited works: just to mention one case (ObsID ), for the fit with a simple power law model with the Galactic absorption column in the keV energy band, Courvoisier et al. (2003) reported , Page et al. (2004) found , and the value in the present work is . However, small differences in the procedures should be noted. Indeed, a small excess of double pixel events and a corresponding deficit of single pixel events can be observed with epatplot task at high energies, specifically above keV, as already indicated by Molendi & Sembay (2003). The problem is resolved by removing the inner region of radius: the fit improves with negligible changes in the spectral parameters. For example, let us consider the data of the ObsID in the keV energy band fit with a simple power law model with Galactic absorption. By using a circular region with radius, the best fit gives these values: and normalization ph cm-2 s-1 keV-1 for and dof. This is to be compared with and normalization ph cm-2 s-1 keV-1 for and dof in the case of annular region of extraction with inner radius and external radius . Therefore, since the fit improves significantly with a small increase of the error bars, the annular region of extraction has been used in the data set analyzed here. An alternative model is a power law plus a blackbody (Table 9), where the thermal component could have a physical origin and be the hard tail of a Comptonized accretion disk. However, the values found in the present work are well above the value of eV found with BeppoSAX, but with a more complex model (Grandi & Palumbo 2004). On the other hand, 3C appeared to be in a different state when observed with BeppoSAX and with XMM-Newton (see also Page et al. 2004).
3EG J1324-4314 (Cen A): Centaurus A is the nearest AGN in the sky ( Mpc) and has been observed twice by XMM-Newton with a delay of one year between the two observations. An analysis of these data has been published by Evans et al. (2004) and we refer the reader to that paper for more details, particularly for the extranuclear environment. But, since the purpose of the present work is to study the continuum, we performed the fit in the keV energy band, to avoid the complex features in the low energy part of the spectrum. Moreover, to guarantee a good approximation of the continuum, we ignored the energy band keV, which is affected by prominent emission lines. After having fixed the power law, the energy band of the iron complex is restored and one or two Gaussian emission lines are added to the model to complete the fit (Table 11). Both observations require a Gaussian emission line from FeK, but a wing toward the high energy is present. The addition of another large line with centroid at keV determines an improvement in the fit of the ObsID (although the centroid is not well constrained), but not in the ObsID (it should be noted that this ObsID has less statistical power, because the MOS2 data are not useful). The iron complex found here is partially in agreement with the BeppoSAX results obtained by Grandi et al. (2003): the discrepancies refer to the FeK line at keV, that is not required by the present data sets. The variability of the neutral iron line found by Grandi et al. (2003) is confirmed also by the present data: the line flux changed significantly between the two observations (spaced by 1 year), but increasing with the source flux increases, the opposite of what has been found in BeppoSAX data. However, two points temporally spaced by one year are not sufficient to claim different behaviour.
3EG J1339-1419 (PKS 1334-127): This flat-spectrum radio quasar has been poorly observed in hard X-rays: the only available observations are with ROSAT and Einstein (see, e.g., Maraschi et al. 1995a). The present analysis is also the first look at the hard X-ray emission ( keV) of this source. A simple power law model, with absorption in excess of the Galactic column, provides the best fit. The photon index is in the middle of the values from Einstein and ROSAT (Maraschi et al. 1995a), and consistent with both within the % confidence level.
3EG J1409-0745 (PKS 1406-076): This source was never studied in X-rays: ROSAT observation resulted only in an upper limit () with erg cm-2 s-1 (Siebert et al. 1998). XMM-Newton observed this blazar twice, with the second observation about one month after the first one, and the fluxes in the ROSAT energy band were and erg cm-2 s-1, respectively. In both observations, the source was best fitted with a simple power law with and no additional absorption.
3EG J1621+8203 (NGC 6251): This EGRET source has been associated by Mukherjee et al. (2002) with the nearby FRI radio galaxy NGC (). Later studies supported this conclusion, e.g. Sowards-Emmerd et al. (2003), Chiaberge et al. (2003), Guainazzi et al. (2003), Foschini et al. (2005). There is one XMM-Newton pointing available which lasted ks, but heavy contamination with soft-proton flares strongly reduced the effective exposure on the three detectors (see Table 6). The best fit model is an absorbed broken power law model. The addition of a thermal plasma to the single power law does not provide an improvement with respect to the broken power law model. This data set has been analyzed by Gliozzi et al. (2004) and Sambruna et al. (2004), but there are some discrepancies with the present analysis (mainly the presence of the FeK emission line) likely to be attributed to a different cleaning of soft-proton flares. In the present analysis, the addition of a narrow ( keV) or broad ( keV) line at keV, determines a worsening of the fit both with respect to the single and the broken power law model. On the other hand, the present results are consistent with ASCA and BeppoSAX observations analyzed by Chiaberge et al. (2003) and Guainazzi et al. (2003) that found no indication of any emission line of the iron complex. An improvement with respect to the single power law is obtained by adding the mekal model, but the fit remains always worse than the broken power law model. The parameters of the single power law plus thermal plasma model are: cm-2, keV, for and dof. The observed flux in the keV energy band is erg cm-2 s-1.
3EG J (PKS ): This is the highest redshift blazar in the present sample () and is gravitationally lensed by an intervening galaxy at (Wiklind & Combes 1996, Lidman et al. 1999, Courbin et al. 2002). It was observed in the past in X-ray by ROSAT (Mathur & Nair 1997), ASCA (Oshima et al. 2001) and Chandra (De Rosa et al. 2005). The present data set has not yet been published and two observations of the three available are affected by high background.
3EG J2158-3023 (PKS 2155-304): This BL Lac object is the third calibration source in the present sample and, for this reason, it has been observed several times. Most of the present data set have been already published (Edelson et al. 2001, Maraschi et al. 2002, Cagnoni et al., 2004, Zhang et al. 2005), where it is possible to find more detailed analyses, particularly with reference to timing properties. This source, being one of the brightest in the X-ray sky, is also used in the search for the warm-hot intergalactic medium (WHIM) and a local absorber has been detected at ( keV) with the Reflection Grating Spectrometers (RGS) on board XMM-Newton (Cagnoni et al. 2004). However, since the study of this type of feature is outside the purpose of the present work, the spectrum of PKS has been fitted in the keV energy range and then the flux has been extrapolated to keV.