The masses of PSR J19115958A and its white dwarf companion
We present spectroscopic and photometric observations of the optical counterpart to PSR J19115958A, a millisecond pulsar located towards the globular cluster NGC 6752. We measure radial velocities from the spectra and determine the systemic radial velocity of the binary and the radial-velocity amplitude of the white-dwarf orbit. Combined with the pulsar orbit obtained from radio timing, we infer a mass ratio of . The spectrum of the counterpart is that of a hydrogen atmosphere, showing Balmer absorption lines up to H12, and we identify the counterpart as a helium-core white dwarf of spectral type DA5. Comparison of the spectra with hydrogen atmosphere models yield a temperature K and a surface gravity cgs. Using mass-radius relations appropriate for low-mass helium-core white dwarfs, we infer the white-dwarf mass and radius . Combined with the mass ratio, this constrains the pulsar mass to . If we instead use the white-dwarf spectrum and the distance of NGC 6752 to determine the white-dwarf radius, we find . For the observed temperature, the mass-radius relations predict a white-dwarf mass of , constraining the pulsar mass to . We find that the white-dwarf radius determined from the spectrum and the systemic radial velocity of the binary are only marginally consistent with the values that are expected if PSR J19115958A is associated with NGC 6752. We discuss possible causes to explain this inconsistency, but conclude that our observations do not conclusively confirm nor disprove the assocation of the pulsar binary with the globular cluster.
Key Words.:
Pulsars: individual (PSR J19115958A) – globular clusters: individual (NGC 6752) – stars: neutron – stars: white dwarfs1 Introduction
The equation-of-state of matter at supra-nuclear densities together with general relativity imply a maximum mass for a rotating neutron star (e.g. Lattimer & Prakash 2004). Conversely, a measurement of a high neutron-star mass constrains the equation-of-state of this matter at these densities. Thorsett & Chakrabarty (1999) found that neutron stars in radio pulsars cover only a rather narrow range in mass; . However, their sample is statistically dominated by mildly recycled pulsars in relativistic double neutron-star binaries. Considerably higher masses (up to ) are expected for millisecond pulsars with low-mass white-dwarf companions, since binary evolution predicts that several tenths of solar masses of material have been transferred from the progenitor of the white dwarf onto the pulsar, spinning it up to the currently observed (millisecond) periods (for reviews, see Verbunt 1993; Phinney & Kulkarni 1994; Stairs 2004).
About 40 of such systems are known (see review by van Kerkwijk et al. 2005), but neutron-star masses have been measured for only six of them. PSR J0751+1807 contains the heaviest neutron star known to date and with a mass of (Nice et al., 2005b) this is the only system for which the mass is not consistent with a value near .
With the exception of PSR J1012+5307, these neutron-star masses are determinated from radio timing of the millisecond pulsar; either due to the detection of general-relativistic effects or due to the detection of secular and annual variations because of the motion of the Earth. For PSR J1012+5307, the neutron-star mass was determined through optical spectroscopy of the white-dwarf companion to the pulsar. These measurements yield the radial-velocity amplitude of the white-dwarf orbit, which combined with the pulsar orbit, determines the mass ratio between the white dwarf and the pulsar. A model-atmosphere fit to the white-dwarf spectrum provides the effective temperature and surface gravity of the white dwarf. Combining these values with white-dwarf mass-radius relations yield the white-dwarf mass and radius and, through the mass ratio, the pulsar mass.
In this paper, we use this method to determine the mass of the binary millisecond pulsar PSR J19115958A. This pulsar is in a 20 h, highly circular () orbit around a low-mass companion and located at a projected offset of from the center of the globular cluster NGC 6752 (D’Amico et al., 2001, 2002). D’Amico et al. (2002) argued that the pulsar binary is associated with the globular cluster NGC 6752 (cf. the discussion in Appendix B.3). In order to explain the large distance of the pulsar from the cluster center (3.3 half-mass radii) and the circular orbit, Colpi et al. (2002) investigated several possible scenarios. They argued that if PSR J19115958A was ejected out of the core of NGC 6752 this may be the result of an encounter with a wide binary consisting of two black holes.
The optical counterpart to PSR J19115958A was discovered by Bassa et al. (2003b) and confirmed by Ferraro et al. (2003). It was found that the colours and magnitudes of the counterpart are consistent with those of a 0.18– helium-core white dwarf at the distance of NGC 6752. The relative brightness of the counterpart () and the fact that the field surrounding PSR J19115958A is not extremely crowded, motivated us to obtain phase-resolved spectroscopic observations of the companion of PSR J19115958A and determine the mass of the pulsar. In principle, these observations can also be used to verify the membership of PSR J19115958A with NGC 6752 through the systemic radial velocity and the white-dwarf radius, which should be consistent with values expected for a system associated with the globular cluster. If the association is confirmed, the accurate distance to the globular cluster provides a separate constraint on the radius of the white dwarf and thus its mass.
This paper is structured as follows; in § 2, we describe our spectroscopic observations and their reduction, as well as the analysis of archival photometric observations. The radial-velocity measurements are described in § 3 and we determine the properties of the system in § 4. We compare our results with the work by Cocozza et al. (2006) and present the overall discussion and conclusions in § 5. In Appendix A we elaborate on the corrections we applied to the wavelength scale. Finally, we discuss the membership of PSR J19115958A with NGC 6752 in Appendix B.
2 Observations and data reduction
2.1 Spectroscopy
Twenty-three long-slit spectra of the companion of PSR J19115958A were obtained with FORS1, the Focal Reducer and Low Dispersion Spectrograph of the ESO VLT at Cerro Paranal, on 8 different nights from May to August of 2004. A summary of the observations is given in Table 2. Between the first and second observing run, the instrument was moved from Unit Telescope 1 (UT1, Antu) to UT2 (Kueyen). The spectra were obtained with the 600 lines mm-1 “B” grism and a slit, which gives a wavelength coverage from 3300–5690 Å. The standard-resolution collimator was used, resulting in a pixel size of pix-1 in the spatial direction and 1.2 Å pix-1 in the dispersion direction. All spectra had integration times of 2470 s and were sandwiched between two 30 s, -band, through-the-slit images and preceded by one or more 30 s -band acquisition images. The seeing, as determined from the width of the slit profiles, varied between and , with only three spectra having a FWHM larger than . Generally, the conditions were good, with photometric skies. With this setup, the spectral resolution is set by the seeing, which is less than the slit width in all observations. For our average spectra, a resolution of 4.5 Å is inferred from the spectra of the reference star discussed below. Following the FORS1 calibration plan, bias, flat-field and wavelength calibration frames were obtained during twilight or daytime afer each observing night, with the telescope pointed towards the zenith.
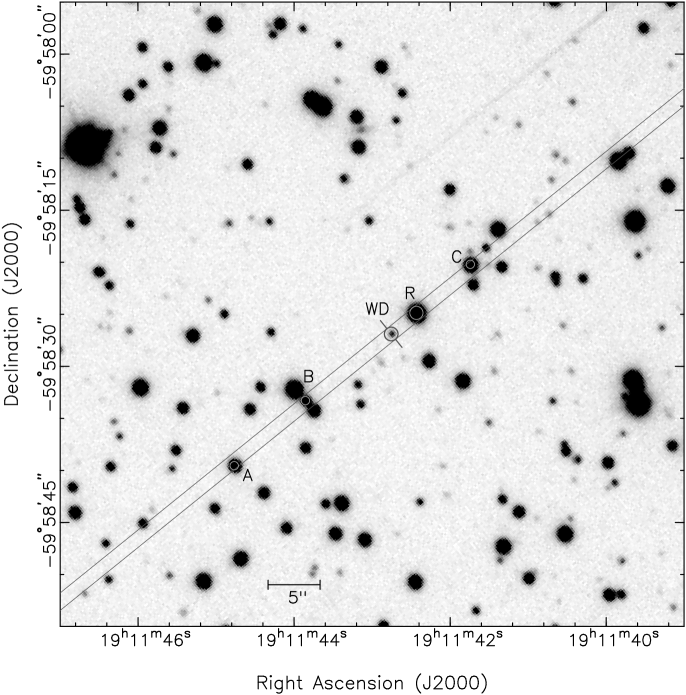
Given the proximity of a brighter star () only to the North-West of the pulsar companion, we chose to center the slit on both this star and the companion, see Fig. 1. We did this to use the star as a reference for the wavelength and flux calibration and to minimalize the influence of this star on the spectrum of the white dwarf. Besides the pulsar companion and this bright star (which we henceforth call the reference star or star R), stars A, B and C (see Fig. 1) and D also fall on the slit. As a result of this setup, the position angle of the slit is fixed on the sky and differs from the parallactic angle, by an amount which depends on the hour angle of the observation. Any effects of differential atmospheric refraction, which become important when one does not observe with the slit parallel to the parallactic angle (Filippenko, 1982), are largely corrected for by the Atmospheric Dispersion Corrector (ADC) on the FORS1 instrument.
To account for slit losses and to allow for flux calibration, the exposure with the slit positioned closest to the parallactic angle (that from MJD 53229, see Table 2) was followed by exposures through a slit of both the pulsar companion (1600 s) and the spectro-photometric flux standard LTT 7987 (30 s; Hamuy et al. 1992, 1994). For these the conditions were photometric with seeing.
The images were reduced with the Munich Image Data Analysis System (MIDAS). All images were bias-corrected with the bias values from the overscan regions on the FORS1 chip and flat-fielded using lamp exposures. For the sky substraction we used clean regions between the stars along the slit. The region extended to 26″ to each side of the pulsar companion, encompassing the pulsar companion, the reference star and star A, B and C. For star D a similar procedure was used. A polynomial was fitted to the spatial profile of these clean regions of the sky for each column in the disperion direction. The order of the polynomial was predominantly zero; but first and second order fits were used when this significantly increased the goodness of the fit.
Spectra were extracted from the sky-subtracted images using an optimal extraction method similar to that of Horne (1986). Each of the extracted spectra was wavelength calibrated with the wavelength calibration frames. Here we measured the positions of the lines in a row-averaged (in the spatial direction) multiplication of the wavelength calibration frame and the 2-dimensional (in the spatial and dispersion direction) slit profile of the star in question. A cubic polynomial fit was sufficient to describe the dispersion relation and gave root-mean-square (rms) residuals of less than 0.06Å. The wavelength calibrations were found to be stable between different observing nights; the rms scatter in the zero point was 0.041Å (corresponding to 2.7 km s-1 at 4500Å).
The last step was to calibrate the spectra for the instrumental response of the spectrograph, as derived from the observation of the flux standard. The spectrum of the standard was reduced in a similar manner as the pulsar companion and the other stars on the slit. Unfortunately, deriving the response was somewhat troublesome since the calibrated spectrum of the DA white dwarf LTT 7987 was tabulated at 50Å steps. With such a resolution the higher Balmer lines are poorly sampled which may result in systematic trends in the flux calibration at these wavelengths. We therefore analyzed two archival observations of Feige 110 (Oke, 1990), tabulated at 1Å and 2Å steps, from June 28th and December 1st, 2004. The observations were taken with the same grism as the pulsar companion, though with 5″ MOS slits. The spectra were extracted and wavelength calibrated as before and corrected for atmospheric extinction using the average La Silla extinction curve (this relation is also suitable for Paranal). A comparison of the resulting response curves showed that these had a very similar shape, and that the ratio of the two curves could be well approximated with a linear polynomial, i.e. that the response was stable over time. We now used the response curve derived from the June 2004 observation of Feige 110 and fitted it against the extinction-corrected response of LTT 7987, fitting for a linear polynomial scaling factor. Using the -band filter curve of Bessell (1990) and the zero point of Bessell et al. (1998) we obtain a synthetic -band magnitude of 12.30 for LTT 7987, which compares well to =12.28 found by Hamuy et al. (1992) and =12.27 by Landolt (1992).
We corrected all spectra for atmospheric extinction and calibrated them using this new response. Differences in continuum flux between the narrow and wide slit exposures were corrected for with a scaling factor that depends linearly on wavelength.
2.2 Photometry
We have analyzed all available FORS1 observations of the field containing PSR J19115958A. The data consists of i) three 1500 s , five 360 s and eight 220 s -band images, taken with the high-resolution collimator (which has pix-1) on 3 different nights in 2003 March, April and May under photometric conditions with good seeing (–); ii) three 32 s -band and three 13 s -band images that were obtained under photometric conditions with seeing on 2003 March 31 with the standard collimator; iii) a series of thirty 30 s -band acquisition images obtained prior to the spectral observations presented above, and iv) a series of twenty-three 600 s -band images obtained on 2004 August 10–15 with the high resolution collimator during good to moderate seeing conditions (–).

All images were bias-subtracted and flatfielded using twilight flats. The DAOPHOT II package (Stetson 1987), running inside MIDAS, was used for the photometry on the averaged images. We followed the recommendations of Stetson (1987), obtaining instrumental magnitudes through point-spread function (PSF) fitting. The and -band observations of March 31, 2003 include 20 photometric standards from Stetson (2000) of which 12 were unsaturated. The instrumental PSF magnitudes of these stars were directly compared against the calibrated values to derive zero points and colour terms (no extinction coefficients are needed since the standards and target are at the same airmass), giving rms residuals of 0.01 mag in and 0.03 mag in . For the calibration of the -band observations, we used 4 standard stars from the PG 1657+078 field (Landolt, 1992). We fitted for zero point and colour term, using the standard ESO extinction coefficients of 0.46 and 0.25 mag per airmass for and -band respectively. These calibrations have rms residuals of 0.02 mag in and . The difference between the two -band calibrations was less than 0.01 mag, hence we expect our zero-point uncertainties in to be less than 0.02 mag, less than 0.03 mag in , and allowing for the uncertainty in the -band extinction coefficient, less than 0.05 mag in . The resulting magnitudes of the stars on the slit are tabulated in Table 1.
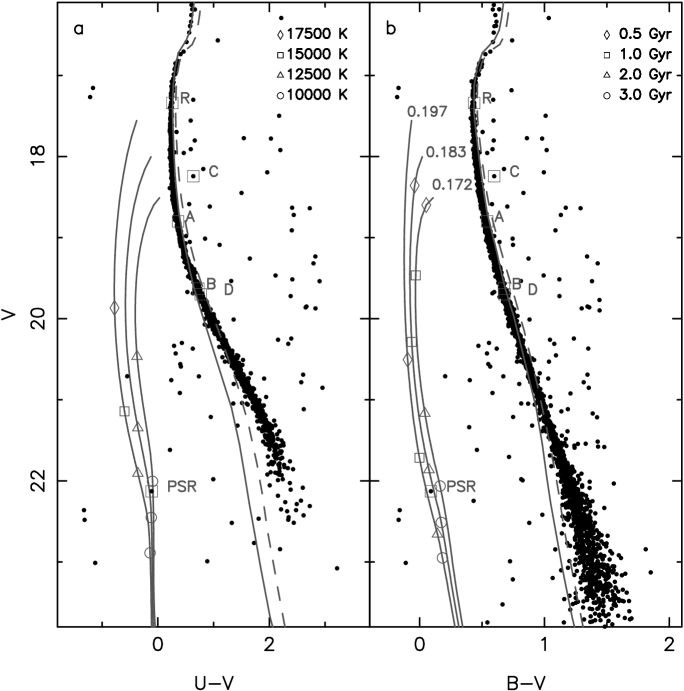
Colour-magnitude diagrams were constructed from the photometry and are shown in Fig. 2. We find that star R has the magnitude and colours of a cluster turn-off star while stars A, B and D are located further down the cluster main sequence. Star C, on the other hand, is not located on the main sequence, and is about a magnitude brighter than cluster stars with the same and colours. The pulsar companion is blue with respect to the cluster main-sequence by about 2 mag in and more than 1 mag in .
We checked for variability of the pulsar companion using the twenty-three 600 s -band images and the thirty 30 s -band acquisition images. With a pixel scale of pix-1, the 600 s images are severely oversampled, and we rebinned the images to a pixel scale of pix-1 (averaging every pixels). Next, instrumental magnitudes were determined through PSF fitting and calibrated to the photometry presented above. The resulting magnitudes are shown in Fig. 3. In both the 600 s and the 30 s images, the magnitudes of the pulsar companion do not significantly vary with orbital phase. For example, the rms scatter for the white dwarf around the average value in the 600 s and 30 s images is only 0.02 mag and 0.05 mag, respectively, and these values are comparable to that of stars of similar brightness.
| ID | |||||
|---|---|---|---|---|---|
| WD | 19 11 42.753 | -59 58 26.89 | 22.02(5) | 22.22(3) | 22.13(2) |
| R | 19 11 42.432 | -59 58 24.90 | 17.60(5) | 17.78(1) | 17.34(1) |
| A | 19 11 44.768 | -59 58 39.58 | 19.16(5) | 19.34(1) | 18.80(1) |
| B | 19 11 42.854 | -59 58 33.34 | 20.36(5) | 20.31(1) | 19.63(1) |
| C | 19 11 41.742 | -59 58 20.25 | 18.88(5) | 18.84(1) | 18.24(1) |
| D | 19 11 35.911 | -59 57 45.35 | 20.47(5) | 20.38(1) | 19.70(1) |
| MJDbar111The time of the observation at mid-exposure, corrected to the solar system barycenter. | 222Using the ephemeris of D’Amico et al. (2002): , days. | (km s-1) | (km s-1) | (km s-1) | (km s-1) | (km s-1) |
|---|---|---|---|---|---|---|
| 53147.38143 | 0.1590 | 29 22 | 12.9 8.1 | 18 11 | 34 16 | 21 20 |
| 53198.11569 | 0.7664 | 3 29 | 6.8 7.8 | 1 11 | 18 16 | 11 22 |
| 53204.15036 | 0.9752 | 233 26 | 11.5 8.2 | 23 11 | 19 16 | 1 20 |
| 53204.19242 | 0.0254 | 219 22 | 17.8 8.1 | 13 12 | 45 16 | 13 21 |
| 53204.22978 | 0.0701 | 160 25 | 8.8 8.5 | 17 11 | 58 15 | 12 21 |
| 53206.21868 | 0.4459 | 218 23 | 16.8 8.6 | 7 11 | 33 15 | 6 22 |
| 53206.25549 | 0.4899 | 262 20 | 10.8 8.1 | 12 11 | 38 15 | 23 21 |
| 53206.29500 | 0.5371 | 245 23 | 10.3 8.5 | 3 11 | 31 16 | 10 20 |
| 53210.19705 | 0.1983 | 6 25 | 15.4 8.8 | 2 11 | 35 16 | 20 20 |
| 53210.23098 | 0.2388 | 12 22 | 0.3 8.0 | 1 12 | 30 15 | 3 20 |
| 53210.27816 | 0.2952 | 77 24 | 6.4 7.6 | 12 11 | 38 16 | 2 21 |
| 53210.31250 | 0.3362 | 148 27 | 3.6 7.8 | 1 11 | 33 16 | 23 26 |
| 53229.01322 | 0.6748 | 116 23 | 6.2 8.1 | 8 11 | 27 16 | 1 22 |
| 53231.02712 | 0.0805 | 186 25 | 0.3 8.1 | 8 11 | 12 16 | 12 22 |
| 53231.06463 | 0.1253 | 179 27 | 3.8 8.2 | 6 11 | 19 16 | 8 20 |
| 53231.11869 | 0.1899 | 64 26 | 16.3 7.8 | 6 11 | 33 16 | 22 21 |
| 53231.17422 | 0.2562 | 35 25 | 7.0 7.9 | 4 11 | 22 16 | 6 20 |
| 53231.22574 | 0.3177 | 153 29 | 7.7 8.2 | 6 10 | 34 16 | 6 21 |
| 53232.00988 | 0.2544 | 57 22 | 1.2 7.7 | 5 11 | 9 16 | 8 19 |
| 53232.04617 | 0.2978 | 42 24 | 11.4 8.1 | 13 11 | 21 15 | 9 20 |
| 53232.08482 | 0.3439 | 142 21 | 23.9 8.2 | 15 10 | 38 15 | 16 20 |
| 53232.13559 | 0.4046 | 200 22 | 12.7 8.4 | 0 11 | 37 17 | 5 20 |
| 53232.18610 | 0.4649 | 273 32 | 0.6 9.2 | 3 10 | 32 17 | 1 21 |
3 Radial velocities
Radial velocities of the companion and the five stars on the slit were determined by comparing them with template spectra. In case of the white dwarf this was done iteratively, where we used the hydrogen atmosphere models from which we determined the surface gravity and effective temperature (see § 4.2 and Fig. 5) as a template. A best-fit model was first determined for one of the single spectra. This model was then used as a velocity template to measure the velocities of the other spectra. These spectra were shifted to zero velocity and averaged. The final velocity template was found by fitting a new atmosphere model against the averaged spectrum. The actual velocities were measured by minimizing a merit function, as defined in Bassa et al. (2003a), fitting for velocity and a 2nd order polynomial modelling continuum differences.
In the case of the reference star we used a somewhat different approach. Here, a template was constructed from fitting Lorentzian profiles to a single, normalized spectrum of the reference star. Eight lines ( up to 11 and K, but without the blend of and H) were simultaneously fitted, fitting for depth and width, but forcing the velocity to be the same for all lines. The resulting template was shifted to zero velocity and fitted against normalized spectra of the reference star by again minimizing a merit function. To test for the stability of the radial velocities, we also used this template to determine radial velocities of the other four stars on the slit. These stars also display the hydrogen Balmer lines and K, though the lines are not as strong as those of the reference star (see Fig. 9).
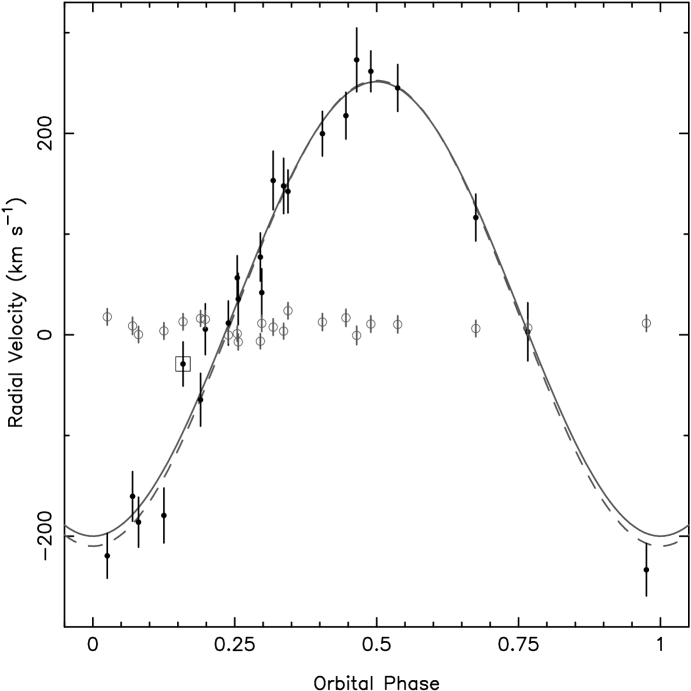
The radial velocity of the pulsar companion varied by as much as 470 km s-1 between the different spectra, fully within the expectations for this system. From radio timing, it was found that the eccentricity of the orbit is (D’Amico et al., 2002). Hence, we fitted the barycentric radial velocities of the pulsar companion to a circular orbit, with the orbital period and time of the ascending passage node fixed to the values determined from the radio-timing solution by D’Amico et al. (2002). We find a radial-velocity amplitude km s-1 and a systemic velocity km s-1 for a reduced chi-squared with 21 degrees-of-freedom. Here, the errors on and are scaled to give .
The velocity of the reference star, however, varied over a 120 km s-1 range, much larger than the 7 to 10 km s-1 error on the individual velocities. We feared that these velocity variations might also be a result of binarity, but the other stars on the slit displayed similar variations in velocity. In particular, the velocities of these stars displayed a trend when compared against the local hour angle of the observation, where the velocity decreased by about 16 km s-1 per hour prior or after culmination. Upon closer investigation this trend was found to be caused by two separate, systematic, effects. Because the effects are systematic, they can be corrected for.
For the first correction, we applied a shift to the wavelength calibration of each spectrum based on the difference between the measured wavelength of the O i night sky emission line in the spectrum and the labaratory value. This correction removes the global decrease of the velocities as a function of hour angle. The remaining scatter in the radial velocities is largely removed by correcting for the second effect, which is due to errors in the centering of the stars on the slit. For this correction, we determined the position of star R with respect to the center of the slit in the through-the-slit images obtained before and after each spectrum. We apply this offset as a shift in wavelength to the wavelength calibration of the corresponding spectrum. In Appendix A we describe these corrections in detail, while Table 1 lists the velocities that were determined from the corrected wavelength calibrations.
We now use the corrected radial velocities to determine the radial-velocity orbit of the white-dwarf companion of PSR J19115958A. Again fitting for a circular orbit, we find a radial-velocity amplitude km s-1 and a systemic velocity km s-1 ( for 21 degrees-of-freedom). The errors on and are again scaled to give . This fit is represented in Fig. 4 with the solid line. If we exclude the single point (the boxed point in Fig. 4) that lies away from the best-fit, the fit improves to , giving km s-1 and km s-1, depicted by the dashed curve in Fig. 4. Remarkably, this outlier corresponds to the spectrum taken during the first observing run, when, as mentioned in § 2, FORS1 was still on UT1, unlike all other spectroscopic observations, when it was on UT2. We do not understand, however, how this could cause a difference, since differences in the flat-fields, wavelength calibration, and flux calibration should all be corrected for.
If we fit a circular orbit against the radial velocities of the pulsar companion relative to the radial velocities of the reference star R, we obtain kms, km s-1, for 21 degrees-of-freedom. Again excluding the outlier gives km s-1, km s-1, with for 20 degrees-of-freedom.
The differences in the radial velocity amplitudes are consistent within the errors. The same holds for the systemic velocities measured from the absolute and the relative velocities. For the remainder of this paper we will use the fit using absolute velocities, without the outlier; km s-1 and km s-1 (here we corrected the systematic velocity for the km s-1 velocity offset which we determined in Appendix A).
4 System properties
We use our measurements to determine the properties of the white dwarf and the pulsar. In our analysis, we distinguish between results that do and that do not depend on the assumption that the pulsar is a member of NGC 6752. We will see that our conclusions depend on that assumption; we will address this in detail in Appendix B.
4.1 Minimum white dwarf mass
The radio timing observations by D’Amico et al. (2002) yielded a projected semi-major axis of the pulsar orbit of s, which, together with the orbital period implies a radial-velocity amplitude of km s-1. Combining this with the radial-velocity amplitude of the white dwarf determines the mass ratio . Here, the error on is dominated by the uncertainty in .
We can use the mass ratio and the constraint that the inclination must be less than or equal to to determine a lower limit to the white-dwarf mass. For this, we use the pulsar mass-function , so that we can write . Setting the inclination at and using the mass ratio as determined above we find a lower limit of . The lower limit is .
4.2 Effective temperature and surface gravity
The atmospheric parameters for the white dwarf were determined by fitting theoretical model atmospheres to the average of the velocity-corrected spectra (see § 3). The theoretical models were taken from a grid of pure hydrogen models usually applied to normal DA white dwarfs, but extending down to surface gravities of . The methods and input physics are described in more detail in Finley et al. (1997) and Homeier et al. (1998). The best-fitting parameters are found with a Levenberg-Marquardt type algorithm (Press et al., 1992). We also use a second, newly developed algorithm, which is less sophisticated but more transparent and robust than the Levenberg-Marquardt method. In essence it determines the values for the models of the grid around the minimum and then fits the surface with a paraboloid, from which the parameters and errors corresponding to the minimal can be calculated. This avoids excessive interpolations between the models in the grid, which sometimes leads to artificial small-scale structure of the surface. The results between the two methods did not differ significantly; the values given below are from the second method.
For the fit we used the spectral ranges from 3740–4440 and 4760–5030 Å, which contain the Balmer lines. The model was fitted to the observed spectrum and the calculated from the fit to the continuum-normalized line profiles. The obtained parameters and their formal errors are K and cgs. The resulting best-fit model is shown in Fig. 5. With this temperature, the spectral type of the white dwarf is DA5 (Wesemael et al., 1993).
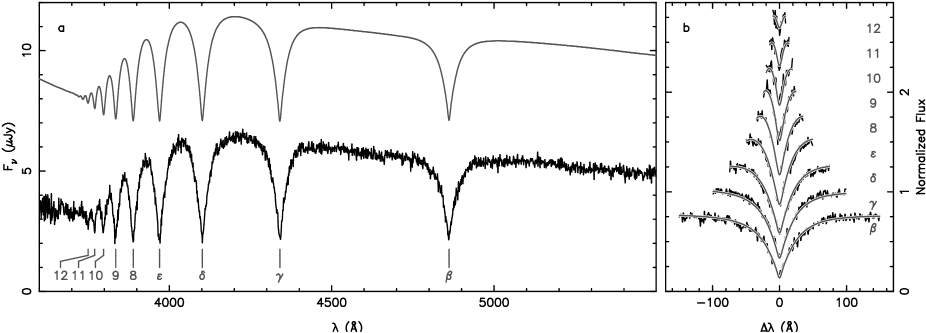
The model fits the observed Balmer lines extremely well up to H10. H11 and H12 are weaker and not as deep in the model as is observed. This may be an indication that the surface gravity is slightly lower than the formal fit. It may also indicate that the Hummer-Mihalas occupation probability theory (Hummer & Mihalas, 1988; Mihalas et al., 1988, 1990) used in the models overestimates the quenching of the highest Balmer lines. The theoretical line profiles of H11 and H12 depend strongly on the Hummer-Mihalas formalism and as these lines are absent in the typical white dwarf, the theory is difficult to calibrate. For a recent study on the influence of the Hummer-Mihalas formalism on the line profiles, see Koester et al. (2005).
The fit uncertainties include only the statistical errors, while systematic effects may be important (Reid, 1996; Vauclair et al., 1997). We experimented with small changes in the continuum and fit regions, and other fitting parameters. The largest effect is from changes in the resolution: assuming that the resolution were 6.5Å instead of the 4.5Å inferred from the lines in the spectrum of the reference star, we find K and cgs. As we discuss in Appendix B.2.2, rapid rotation may mimic a change in resolution. Since this is not secure, however, we decided to adopt conservative errors below, and use K and cgs
4.3 White dwarf mass and radius
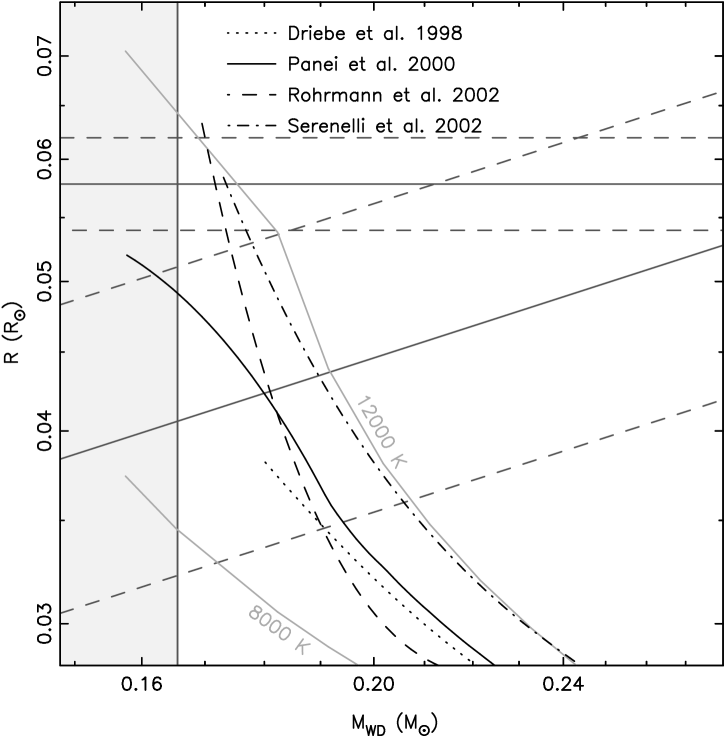
The mass and radius of the white dwarf can be determined from the surface gravity using a mass-radius relation appropriate for a helium-core white dwarf at the observed temperature. Such mass-radius relations have been modelled by Panei et al. (2000) and we interpolate between their 8000 K and 12000 K tracks to obtain the relation at the observed temperature, as shown in Fig. 6, giving and . Similar white-dwarf masses and radii are found from the evolutionary cooling tracks of Driebe et al. (1998) and Rohrmann et al. (2002). Here we obtain, for each model with a given mass, the radius and hence the surface gravity at the observed white-dwarf temperature and interpolate between the models to get the mass and radius at the observed . The models by Rohrmann et al. (2002) give with . The lowest mass model by Driebe et al. (1998) has 0.179 M⊙, so we extrapolate their models. This yields and , though the uncertainties may be underestimated because of the extrapolation. The uncertainties of the Rohrmann et al. (2002) models are considerably smaller, as its mass-radius relation is steeper than those of the Panei et al. (2000) and Driebe et al. (1998). Finally, the mass-radius relations from the and models by Serenelli et al. (2002) are very similar and both predict a somewhat higher white-dwarf mass, of , and a radius of .
We should note that the models by Driebe et al. (1998) and Rohrmann et al. (2002) are computed for white-dwarf progenitors with solar metallicity and are appropriate for field systems. As the metallicity of NGC 6752 is considerably smaller ([Fe/H], Gratton et al. 2003), the Serenelli et al. (2002) models for white-dwarf progenitors with sub-solar metallicities (with in particular) are more appropriate in the case that PSR J19115958A is associated with NGC 6752. The differences of about 0.01 M⊙ and 0.001 R⊙ in the predictions from different models, however, are similar in magnitude to the difference induced by different metallicities. For the remainder of the paper, we will use values that encompass all predictions from the effective temperature and surface gravity: and .
4.4 Distance inferred from the white dwarf
The distance to the white dwarf can now be estimated using the observed and modelled flux and the radius of the white dwarf. We do this by writing the flux normalization between the observed flux , the model flux , and the radius over the distance in terms of magnitudes; , where is the absolute magnitude in a given filter, the flux from the model in the same filter and the zero-point of the filter. By convolving the flux-calibrated best-fit model of the observed spectrum with the and -band filter curves from Bessell (1990), we obtain erg cm-2 s-1 Å-1 and erg cm-2 s-1 Å-1. The uncertainties on these fluxes due to the uncertainties in and are about 5%. With the zero-points from Bessell et al. (1998), and , we obtain , . The uncertainties are dominated by those on the white-dwarf radius.
Combined with the observed and -band magnitudes from Table 1, we obtain distance moduli of and . Assuming a negligible reddening, the averaged distance modulus yields a distance of kpc. Assuming a reddening of , the distance becomes kpc.
4.5 Mass and radius from distance, flux and temperature
Now we determine the properties of the white dwarf based on the assumption that the distance of the binary is that of the globular cluster. From the values from Table 1, the distance modulus and reddening (Gratton et al., 2003, 2005), we obtain and . The and -band fluxes and zero-points and the relation from § 4.4 yield white-dwarf radii of and for the and -band values, respectively. As a conservative estimate, we will use , corresponding to , which encompasses both values.
The mass of the white dwarf can be determined from the radius using the mass-radius relations. The radius is shown with the horizontal lines in Fig. 6, together with the mass-radius relations. The models by Rohrmann et al. (2002) predict , while the models of Serenelli et al. (2002) give . The mass-radius relation by Panei et al. (2000) and the evolutionary models by Driebe et al. (1998) do not reach these radii and provide no mass estimate. The surface gravity that corresponds with these masses and radii is about cgs. Both the white-dwarf radius and the surface gravity are slightly outside the range of these values inferred from the spectrum (see Fig. 6). Because of the steepness of the mass-radius relations, the masses are in agreement. We do note that if the pulsar binary is at the distance of NGC 6752, the white-dwarf mass is slightly below our best estimate for the minimum mass, though they are consistent with the limit.
If the pulsar binary is associated with NGC 6752, the progenitor of the white dwarf must have evolved from a cluster star. Serenelli et al. (2002) computed white-dwarf cooling tracks for objects with sub-solar metallicities. Their models have a metallicity that is similar to that of NGC 6752 ([Fe/H]; Gratton et al. 2003), and for this reason, we use the corresponding mass estimate as the best value for the white-dwarf mass. To take into account the uncertainty in the white-dwarf mass-radius relation, we add 0.010 M⊙ in quadrature to the uncertainty in the mass. In summary, under the assumption that the binary system is a member of NGC 6752, we infer a radius of and a mass of .
4.6 Pulsar mass
As for the white dwarf, we can determine a minimum mass for the pulsar from the mass ratio and the constraint that the inclination is less than or equal to 90°. The white-dwarf mass-function is , which can be written to give . With , this yields a lower limit to the pulsar mass: . The limit is . These limits are model independent, as they only depend on three observables; the projected semi-major axis of the pulsar orbit and the orbital , as determined from pulsar timing, and the white-dwarf velocity amplitude , that we obtained from our spectroscopic observations.
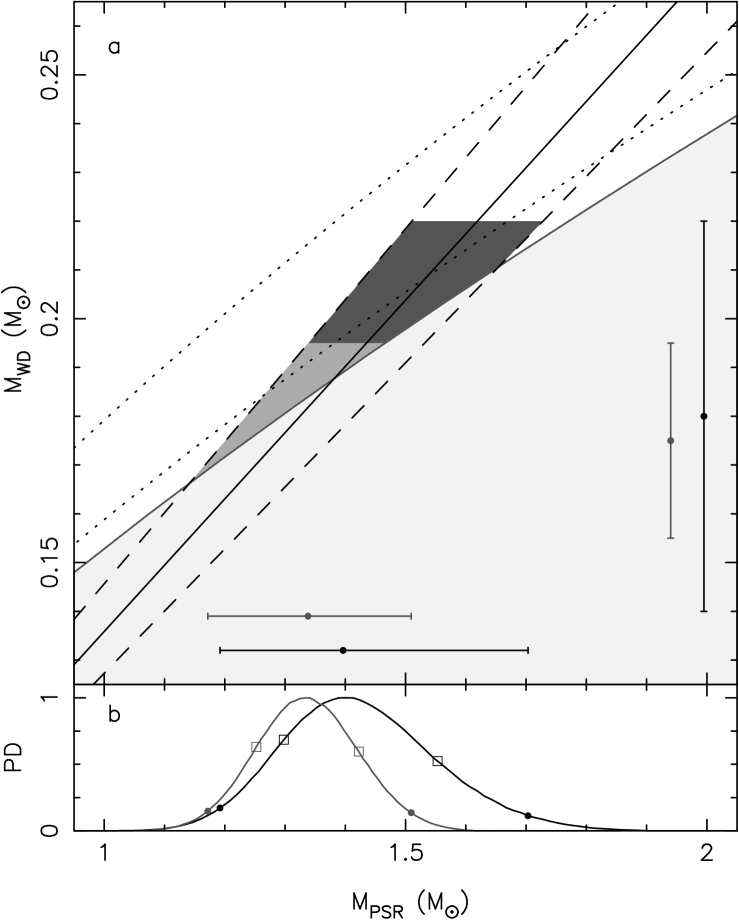
In Fig. 7, we show the constraints set by the mass ratio and the two white-dwarf mass determinations. It is clear that a large part of the range allowed by these constraints is excluded by the pulsar mass function. As a result, the most probable value for the pulsar mass and the uncertainties on it are not normally distributed. Instead, we determined these values via a Monte Carlo error propagation method. For a million trial evaluations, values for , , and were randomly drawn from Gaussian distributions with the appropriate means and widths to obtain the corresponding pulsar mass. Solutions that had were excluded. From the resulting distribution of solutions the most probable value for and the uncertainties on the pulsar mass were determined.
For a white-dwarf mass of , the mass of the pulsar is constrained to at 68% confidence. For the case that the white dwarf is associated with the globular cluster, the allowed range in pulsar mass is smaller, at 68% confidence. The uncertainties corresponding to 95% confidence are in both cases twice as large.
5 Discussion and conclusions
We have unambiguously identified the companion to PSR J19115958A as a Helium-core white dwarf and determined its mass. Together with the measurement of the mass-ratio of the binary, we obtain constraints on the pulsar mass. However, before we discuss our results, we compare our results to those presented by Cocozza et al. (2006).
Cocozza et al. found that the light-curve of the white dwarf companion to PSR J19115958A showed two phases of brightening by about 0.3 mag, located approximately at the quadratures of the orbit (phases and ). This result is at odds with our light-curve, which excludes variations larger than 0.02 mag. Fig. 3 shows a reproduction of the light-curve determined by Cocozza et al. (2006). This figure also shows the variation in the seeing under which these images were obtained; one sees that these closely follow the variations in the white-dwarf magnitude found by Cocozza et al. (2006). This suggests that seeing affects their photometry and that the variations they measure are due to variations in the seeing and not due to variations in the white-dwarf brightness. We found that we could reproduce their light-curve by defining the PSF over an area smaller than about in radius. This distance corresponds to the distance between star R and the white dwarf, and if the PSF radius is chosen smaller than this value, flux in the wings of star R is not removed and added to the flux of the white dwarf. Hence, the effect increases for increasing seeing. We used a PSF radius that extends up to from the center of each star and is still larger than the width of the PSF in the images of the worst seeing. As such, our photometry is not affected by this error and excludes the 0.3 mag variations seen by Cocozza et al. (2006).
The radial-velocity curve of the white dwarf companion to PSR J19115958A is also presented in Cocozza et al. (2006). Their radial-velocity amplitude and systemic velocity are consistent with the values we found using the uncorrected velocities. We note that the uncertainty on our value for is about a factor two smaller. We believe this is caused by the fact that we used nine Balmer lines (H up to H12) whereas Cocozza et al. (2006) only used four (H up to H). Especially since the higher Balmer lines are narrower they will provide more accurate velocities. Cocozza et al. (2006) use their measurement of the systemic velocity of the pulsar binary ( km s-1) as an arguement supporting the association of PSR J19115958A with NGC 6752. However, as Cocozza et al. (2006) did not correct for the systematic shifts in the wavelength scale that we identified and corrected for (see Appendix A), their conclusion regarding the association between the binary and the cluster is meaningless.
We now turn to the conclusions that can be drawn from our results. In Appendix B we have used the available constraints set by our observations to test whether PSR J19115958A is associated with the globular cluster NGC 6752. Unfortunately, these tests are not conclusive and hence, we discuss both pulsar mass determinations below.
First, it is interesting to compare the mass of the white dwarf with the mass predicted by the theoretical relation between the white-dwarf mass and the orbital period (Joss et al., 1987). For short orbital periods, this relation is least secure, since mass transfer starts before the companion has a well-developed core (Ergma et al., 1998). Nevertheless, from earlier systems it seemed that the predictions by Tauris & Savonije (1999), which are strictly valid only for d, work well for binaries with orbital periods as short as 8 h (see Fig. 2 in van Kerkwijk et al. 2005). At the orbital period of PSR J19115958A, their relation predicts a white-dwarf mass between 0.18 and 0.20 . This is again in very good agreement with our white-dwarf mass measurement (independent of whether the pulsar binary is associated with the globular cluster).
Binary evolution furthermore predicts that the progenitors of white dwarfs in low-mass binary millisecond pulsars have lost of matter in order to form a helium-core white dwarf. It is believed that at least a part of this matter is accreted onto the neutron star in order to spin it up to millisecond periods. As such, the neutron stars in low-mass binary pulsar systems are expected to be heavier than the canonical neutron star of (Thorsett & Chakrabarty, 1999).
For the case that PSR J19115958A is a field system, the mass of the pulsar () is indeed heavier than the canonical value, though not by much. However, similarly small differences have been found for several of the other low-mass binary millisecond pulsars for which masses have been determined; PSR J1713+0747, (Splaver et al., 2005), PSR J19093744, (Jacoby et al., 2005), PSR J04374715 with (van Straten et al., 2001), PSR B1855+09, (Nice et al., 2005a) PSR J1012+5307, (van Kerkwijk et al., 1996, 2005; Callanan et al., 1998). The only system for which the pulsar is significantly heavier than the is PSR J0751+1807, with (Nice et al., 2005b).
For the case that PSR J19115958A is associated with NGC 6752, the pulsar mass () is consistent with the found by Thorsett & Chakrabarty (1999) and is one of the least heavy neutron stars in low-mass binary millisecond pulsars. In this case, it is interesting to compare PSR J19115958A with PSR J07373039B, the 2.8 s non-recycled pulsar in the double pulsar system. If the mass of this pulsar (; Lyne et al. 2004) is indicative of the mass of a neutron star after is has been formed, it would only take less then to recycle a normal neutron star to a millisecond pulsar spinning with a period of 3.26 ms.
Finally, our observations also constrain the inclination of the system. For the case that PSR J19115958A is not associated with NGC 6752, we have a limit of or . In the other case, and . Because of these high inclinations, the effects of Shapiro delay should be significant in the timing of the pulsar. Combined with our measurement of the white-dwarf mass, these limits on the inclination imply a Shapiro delay s. Unfortunately, for nearly circular orbits, the Shapiro delay is covariant with the projected semi-major axis and the eccentricity, and a large part of the effect is absorbed in these two parameters. As a result, the effect that remains has a size of s. Interestingly, if Shapiro delay is present, but neglected in the pulsar timing fit, it introduces an apparent eccentricity of and places the longitude of periastron at . Though the small signal due to Shapiro delay may be difficult to detect, radio timing observations of PSR J19115958A may be used to obtain an upper limit on the inclination and the companion mass. For example, if , the timing signal due to Shapiro delay will be much larger, s and s.
Acknowledgements.
This research is based on observations made with ESO Telescopes at the Paranal Observatory under programme IDs 71.D-0013, 71.D-0232, 073.D-0039 and 073.D-0067. We thank Daniel Harbeck for providing us with proprietary VLT/FORS1 data. MIDAS is developed and maintained by the European Southern Observatory. We acknowledge support from NWO (C. G. B.) and NSERC (M. H. v. K.).References
- Bassa et al. (2003a) Bassa, C. G., van Kerkwijk, M. H., & Kulkarni, S. R. 2003a, A&A, 403, 1067
- Bassa et al. (2003b) Bassa, C. G., Verbunt, F., van Kerkwijk, M. H., & Homer, L. 2003b, A&A, 409, L31
- Bessell (1990) Bessell, M. S. 1990, PASP, 102, 1181
- Bessell et al. (1998) Bessell, M. S., Castelli, F., & Plez, B. 1998, A&A, 333, 231
- Bhattacharya & Verbunt (1991) Bhattacharya, D. & Verbunt, F. 1991, A&A, 242, 128
- Callanan et al. (1998) Callanan, P. J., Garnavich, P. M., & Koester, D. 1998, MNRAS, 298, 207
- Carretta et al. (2000) Carretta, E., Gratton, R. G., Clementini, G., & Fusi Pecci, F. 2000, ApJ, 533, 215
- Cocozza et al. (2006) Cocozza, G., Ferraro, F. R., Possenti, A., & D’Amico, N. 2006, ApJ, 641, L129
- Colpi et al. (2002) Colpi, M., Possenti, A., & Gualandris, A. 2002, ApJ, 570, L85
- D’Amico et al. (2001) D’Amico, N., Lyne, A. G., Manchester, R. N., Possenti, A., & Camilo, F. 2001, ApJ, 548, L171
- D’Amico et al. (2002) D’Amico, N., Possenti, A., Fici, L., et al. 2002, ApJ, 570, L89
- Driebe et al. (1998) Driebe, T., Schönberner, D., Blöcker, T., & Herwig, F. 1998, A&A, 339, 123
- Dubath et al. (1997) Dubath, P., Meylan, G., & Mayor, M. 1997, A&A, 324, 505
- Ergma et al. (1998) Ergma, E., Sarna, M. J., & Antipova, J. 1998, MNRAS, 300, 352
- Ferraro et al. (2003) Ferraro, F. R., Possenti, A., Sabbi, E., & D’Amico, N. 2003, ApJ, 596, L211
- Filippenko (1982) Filippenko, A. V. 1982, PASP, 94, 715
- Finley et al. (1997) Finley, D. S., Koester, D., & Basri, G. 1997, ApJ, 488, 375
- Freire et al. (2005) Freire, P. C. C., Hessels, J. W. T., Nice, D. J., et al. 2005, ApJ, 621, 959
- Girardi et al. (2000) Girardi, L., Bressan, A., Bertelli, G., & Chiosi, C. 2000, A&AS, 141, 371
- Gratton et al. (2003) Gratton, R. G., Bragaglia, A., Carretta, E., et al. 2003, A&A, 408, 529
- Gratton et al. (2005) Gratton, R. G., Bragaglia, A., Carretta, E., et al. 2005, A&A, 440, 901
- Hamuy et al. (1994) Hamuy, M., Suntzeff, N. B., Heathcote, S. R., et al. 1994, PASP, 106, 566
- Hamuy et al. (1992) Hamuy, M., Walker, A. R., Suntzeff, N. B., et al. 1992, PASP, 104, 533
- Homeier et al. (1998) Homeier, D., Koester, D., Hagen, H.-J., et al. 1998, A&A, 338, 563
- Horne (1986) Horne, K. 1986, PASP, 98, 609
- Hummer & Mihalas (1988) Hummer, D. G. & Mihalas, D. 1988, ApJ, 331, 794
- Jacoby et al. (2005) Jacoby, B. A., Hotan, A., Bailes, M., Ord, S., & Kulkarni, S. R. 2005, ApJ, 629, L113
- Joss et al. (1987) Joss, P. C., Rappaport, S., & Lewis, W. 1987, ApJ, 319, 180
- Koester et al. (2005) Koester, D., Napiwotzki, R., Voss, B., Homeier, D., & Reimers, D. 2005, A&A, 439, 317
- Landolt (1992) Landolt, A. U. 1992, AJ, 104, 340
- Lattimer & Prakash (2004) Lattimer, J. M. & Prakash, M. 2004, Science, 304, 536
- Le Borgne et al. (2003) Le Borgne, J.-F., Bruzual, G., Pelló, R., et al. 2003, A&A, 402, 433
- Lugger et al. (1995) Lugger, P. M., Cohn, H. N., & Grindlay, J. E. 1995, ApJ, 439, 191
- Lyne et al. (2004) Lyne, A. G., Burgay, M., Kramer, M., et al. 2004, Science, 303, 1153
- Manchester et al. (2001) Manchester, R. N., Lyne, A. G., Camilo, F., et al. 2001, MNRAS, 328, 17
- Mihalas et al. (1988) Mihalas, D., Dappen, W., & Hummer, D. G. 1988, ApJ, 331, 815
- Mihalas et al. (1990) Mihalas, D., Hummer, D. G., Mihalas, B. W., & Daeppen, W. 1990, ApJ, 350, 300
- Nelemans et al. (1997) Nelemans, G., Hartman, J. W., Verbunt, F., Bhattacharya, D., & Wijers, R. A. M. J. 1997, A&A, 322, 489
- Nice et al. (2005a) Nice, D. J., Splaver, E. M., & Stairs, I. H. 2005a, in ASP Conference Series, Vol. 328, Binary Radio Pulsars, ed. F. A. Rasio & I. H. Stairs, 371
- Nice et al. (2005b) Nice, D. J., Splaver, E. M., Stairs, I. H., et al. 2005b, ApJ, 634, 1242
- Oke (1990) Oke, J. B. 1990, AJ, 99, 1621
- Panei et al. (2000) Panei, J. A., Althaus, L. G., & Benvenuto, O. G. 2000, A&A, 353, 970
- Phinney & Kulkarni (1994) Phinney, E. S. & Kulkarni, S. R. 1994, ARA&A, 32, 591
- Press et al. (1992) Press, W. H., Teukolsky, S. A., Vetterling, W. T., & Flannery, B. P. 1992, Numerical recipes: The art of scientific computing (Cambridge: University Press, 2nd ed.)
- Reid (1996) Reid, I. N. 1996, AJ, 111, 2000
- Renzini et al. (1996) Renzini, A., Bragaglia, A., Ferraro, F. R., et al. 1996, ApJ, 465, L23
- Rohrmann et al. (2002) Rohrmann, R. D., Serenelli, A. M., Althaus, L. G., & Benvenuto, O. G. 2002, MNRAS, 335, 499
- Serenelli et al. (2002) Serenelli, A. M., Althaus, L. G., Rohrmann, R. D., & Benvenuto, O. G. 2002, MNRAS, 337, 1091
- Splaver et al. (2005) Splaver, E. M., Nice, D. J., Stairs, I. H., Lommen, A. N., & Backer, D. C. 2005, ApJ, 620, 405
- Stairs (2004) Stairs, I. H. 2004, Science, 304, 547
- Stetson (1987) Stetson, P. B. 1987, PASP, 99, 191
- Stetson (2000) Stetson, P. B. 2000, PASP, 112, 925
- Tauris & Savonije (1999) Tauris, T. M. & Savonije, G. J. 1999, A&A, 350, 928
- Taylor & Cordes (1993) Taylor, J. H. & Cordes, J. M. 1993, ApJ, 411, 674
- Thorsett & Chakrabarty (1999) Thorsett, S. E. & Chakrabarty, D. 1999, ApJ, 512, 288
- van Kerkwijk et al. (2005) van Kerkwijk, M. H., Bassa, C. G., Jacoby, B. A., & Jonker, P. G. 2005, in ASP Conference Series, Vol. 328, Binary Radio Pulsars, ed. F. A. Rasio & I. H. Stairs (ASP), 357
- van Kerkwijk et al. (1996) van Kerkwijk, M. H., Bergeron, P., & Kulkarni, S. R. 1996, ApJ, 467, L89
- van Kerkwijk & Kulkarni (1995) van Kerkwijk, M. H. & Kulkarni, S. R. 1995, ApJ, 454, L141
- van Straten et al. (2001) van Straten, W., Bailes, M., Britton, M., et al. 2001, Nature, 412, 158
- Vauclair et al. (1997) Vauclair, G., Schmidt, H., Koester, D., & Allard, N. 1997, A&A, 325, 1055
- Verbunt (1993) Verbunt, F. 1993, ARA&A, 31, 93
- Wesemael et al. (1993) Wesemael, F., Greenstein, J. L., Liebert, J., et al. 1993, PASP, 105, 761
Appendix A Corrections to the wavelength calibration
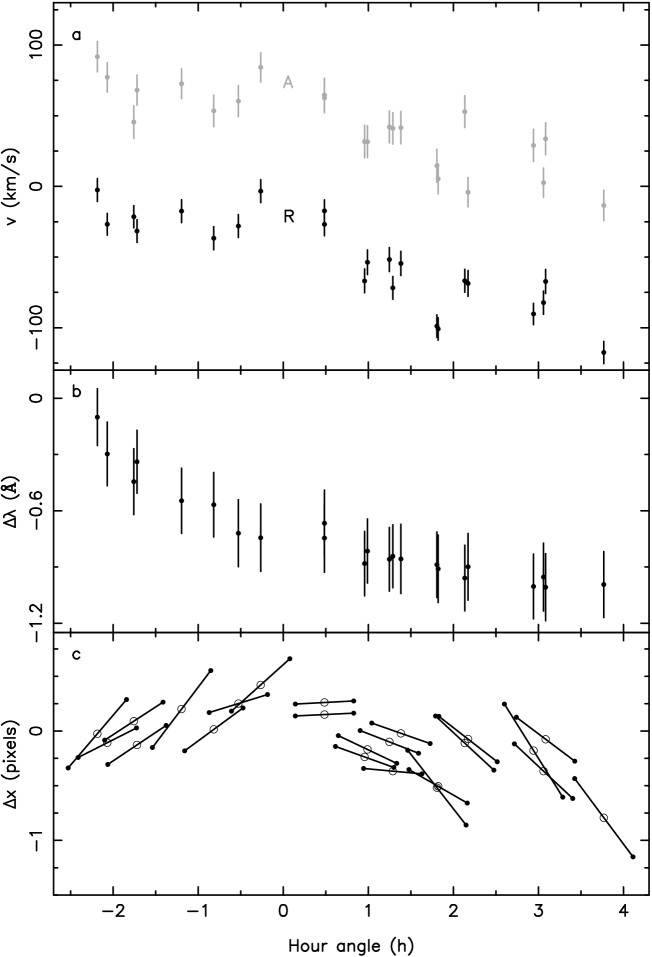
First, according to the wavelength calibration of the different spectra, the wavelength of the O i night sky emission line was offset from the laboratory value ( Å). The offsets varied over a range of 0.9Å or about 50 km s-1 and appeared to decrease with increasing hour angle, as shown in Fig. 8b. We believe this effect is the result of instrument flexure due to differences in the pointing of the telescope, as the calibration frames are obtained with the telescope pointing towards the zenit, while the PSR J19115958A has . We corrected for this effect by applying the measured offsets as a wavelength shift in the zero point of the wavelength calibrations of each individual spectrum.
However, as the O i sky line lies redwards of the last arc line used for the wavelength calibration (Hg ) we cannot verify that the polynomial used for the wavelength calibration is still valid at the wavelength of the skyline and that all systematic wavelength shifts are corrected for. We found, however, that the higher order terms of the polynomial are very similar between the calibration spectra extracted for the different stars; this is because the curvature of the calibration lines and the sky line at the positions of the stars is very small. As a result, we do not expect random effects to dominate the wavelength shift computed above, though the procedure may introduce a systematic wavelength shift affecting all spectra.
The second effect involved the centering of the stars on the slit. In general, when a star is not centered on the slit the offset of the star from the center of the slit will appear as a wavelength shift in the spectrum. This can clearly be seen by the velocities of star R and A in Fig. 8a, where the velocity of star A differs from that of star R by about 100 km s-1; this is primarily due to the fact that compared to star R, star A is positioned closer to the right-hand (redwards) edge of the slit, see Fig. 1. Because of the magnitude of this effect, we determined the position of the reference star R with respect to the center of the slit from the through-the-slit images taken before and after the spectra. The positions on the ‘before’ images varied over a range of 0.68 pixels, whereas those on the ‘after’ images varied over 1.81 pixels. Interestingly, the ‘after’ positions with negative hour angles displayed positive shifts (redwards in wavelength) whereas those with positive hour angles displayed negative shifts. Fig. 8c shows these trends. We interpret the variations in centering of the reference star R on the ‘before’ images as simple scatter inherent to the centering of a star on the slit. The centering variations on the ‘after’ images clearly has a different cause, given its dependence on the hour angle. It may be that this is also related to flexure or differential atmospheric refraction. The averaged affect introduces the scatter in the velocities of the stars on the slit (Fig. 8a) and affects all stars in the same way.
To correct for this effect, we computed the position of star (in pixels) with respect to the center of the slit and applied it as a shift in wavelength in the zeropoint of the wavelength calibrations of each individual spectrum. The position is computed from , where is the normalized point-spread function, as determined from fitting a Moffat function to the spatial stellar profile. Furthermore, is the average of the ‘before’ and ‘after’ shifts in the position of the reference star R with respect to the center of the slit and is the slit width (in pixels). Finally, is the offset between the position of the reference star R and star , measured in pixels in the dispersion direction. These offsets were computed from the five combined 360 s -band exposures used for the photometry.
The resulting radial velocities of the pulsar companion and the other stars on the slit, corrected to the solar-system barycenter, are given in Table 2. The velocity of the reference star R now only varies over a range of 30 km s-1, with an rms scatter of 11 km s-1, comparable to the errors on the velocities tabulated in Table 2. For stars A, B, C, and D the rms scatter is comparable or somewhat larger, with 10, 50, 32 and 13 km s-1, respectively. The large scatter in the radial velocities of star B is likely caused by secondary light from the two nearby stars (see Fig. 1), where variations in the seeing lead to shifts in the center of light in the dispersion direction, which in turn leads to velocity shifts. Therefore, we have not used star B in the further analysis.
The stars on the slit have systemic radial velocities of km s-1, km s-1, km s-1and km s-1. It is unexpected that all these stars have systemic velocities that are different from the radial velocity of the globular cluster NGC 6752 ( km s-1; Dubath et al. 1997), especially as all stars, except star C, have colours that place them on the narrow cluster main sequence in Fig. 2. Since star R, A and D have very similar systemic velocities, we conclude that these stars are cluster members, but that their velocities are off by km s-1. We suspect that this systematic shift may have been introduced by the correction that we applied using the night-sky emission line. As this sky line was located redwards of the reddest wavelength calibration line, the polynomial could have introduced this systematic shift. However, as mentioned above, we do not expect that this influences relative velocities between different observations and different stars, since the shape of the polynomial did not vary between the different observations.
The one remaining issue is that of the systemic radial velocity of star C, which is different from that of the other stars. Star C may not be a cluster member, as it does not coincide with the cluster main sequence. Furthermore, its spectral features, as displayed in Fig. 9, are distinct from those of the other stars. In this figure, the normalized spectra of the stars are sorted in order of increasing -band magnitude, so that when the stars are cluster members their spectra should be ordered on spectral type and their spectral features should change accordingly. Approximate spectral types for these stars were determined by comparing the spectra to those in the atlas of Le Borgne et al. (2003). We see that both the spectral features and the spectral type of star C show more resemblance with that of star D than they do to star R or A. From this we conclude that star C is not a cluster member and therefore its radial velocity may differ from that of the cluster.

Appendix B Is the binary associated with NGC 6752?
We use our observations and the properties of the white dwarf and the pulsar that we derived from them, to test if these support the assumption that PSR J19115958A is a member of the globular cluster NGC 6752.
B.1 Velocities
If the pulsar binary is a member of the globular cluster, the systemic radial velocity of the binary should be compatible with the radial velocity of the cluster, km s-1 (Dubath et al., 1997).
The absolute systemic velocity of the pulsar binary is km s-1. This differs from the radial velocity of the cluster by km s-1 and is consistent with the systemic velocity of the binary km s-1 which we determined from the fit of the white dwarf velocities relative to those of star R.
The velocity difference needs to be corrected for the gravitational redshift of the white dwarf and the reference star R. Using the mass and radius of the white dwarf determined in § 4.3, and the mass and radius of star R determined from the its absolute magnitude and the models by Girardi et al. (2000) plotted in Fig. 2; we obtain 2.7 km s-1 and 0.5 km s-1 for the white dwarf and star R, respectively. This reduces the velocity difference to km s-1, amounting to about a difference between the velocity of the binary and the velocity of the cluster. A part of this velocity difference may be due to the dispersion in the velocity between the pulsar binary and the reference star R. From the scatter in the velocities of stars R, A and D, we estimate that the velocity dispersion is of the order of km s-1.
Also important is the local escape velocity at the pulsar position relative to the cluster center. To estimate the escape velocity at the projected distance of PSR J19115958A, we compute the mass inside a sphere of radius using relation A3 from the simplified cluster model presented in the Appendix of Freire et al. (2005). Here, we used a core-radius of (Lugger et al., 1995), a distance of kpc (Gratton et al., 2003), a central velocity dispersion of km s-1 (Dubath et al., 1997) and to obtain and km s-1. This velocity should be regarded as an upper limit since only the projected distance to the cluster center is known and not the actual distance , with the distance along the line-of-sight towards NGC 6752.
We conclude that, taking into account the velocity range expected due to the velocity dispersion and the escape velocity, the systemic velocity of PSR J19115958A is only marginally consistent (at the level) with the radial velocity of NGC 6752.
B.2 The radius of the white dwarf
From § 4, we found that the white-dwarf radius determined from the effective temperature and surface gravity is outside the uncertainty on the radius derived if the white dwarf is assumed to be at the distance of NGC 6752. This suggests that the pulsar binary is not a member of the globular cluster. There may be additional uncertainties in some of the parameters that were used. Here we discuss some of the sources of uncertainty that may explain the discrepancy in the white-dwarf properties.
B.2.1 Distance, reddening and magnitudes
As a result of the discrepancy in the white-dwarf radius, there is a discrepancy in the distance to the white dwarf. The distance modulus derived from the combination of the atmospheric properties of the white dwarf and the mass-radius relation (§ 4.4) is only marginally consistent with the distance modulus (Gratton et al., 2003) determined for NGC 6752. Though there is a considerable spread in the distance modulus measurements, ranging from ( kpc) from white-dwarf cooling sequence fitting (Renzini et al., 1996), to ( kpc) from main-sequence fitting (Carretta et al., 2000), no distance determination places NGC 6752 so close. Similarly, the spread in reddening measurements, to 0.046 (Gratton et al., 2003, 2005), does not help to explain the radius discrepancy.
It also seems unlikely that our photometry is in error by as much as the 0.6 mag or more needed to match the distance and hence the white-dwarf radius. Our magnitudes are consistent with those given by Ferraro et al. (2003), but have significantly smaller uncertainties. The presence of photometric and standards on the science images removed any uncertainties on the airmass dependence. Also, the -band calibrations taken on two different nights were consistent with each other, having only a 0.01 mag difference. Finally in § 2.2, we found that the white-dwarf companion is not variable (down to 0.02 mag) and this eliminates the possibility that the photometry was taken at an extremum in white-dwarf brightness.
B.2.2 Line broadening
As was found in § 4.2, a lower surface gravity, which would imply a lower mass and a larger radius, was found when the spectral resolution was decreased to 6.5 Å. Though this is considerably larger than the 4.5 Å determined from the width of the lines in the spectrum of star R, the Balmer lines in the spectrum of the white dwarf may be broadened. In order to broaden the lines from 4.5 Å to 6.5 Å a velocity smearing of km s-1 is required.
One source of broadening is due to the fact that in a single observation, the 2470 s exposure time covers about % of the 20 h orbit. This introduces a maximum change in velocity (at and ) of about km s-1, which is much less than required333It also causes a reduction in inferred radial-velocity amplitude by a factor . This is sufficiently small that we have chosen to ignore it..
Another source of broadening could be due to rotation. To estimate the rotational velocity of the white dwarf, we follow the reasoning used in van Kerkwijk & Kulkarni (1995) to explain the variations seen in the spectrum of the white-dwarf companion to PSR B0655+64. During the period of mass transfer, the progenitor of the white dwarf, a giant, filled its Roche lobe and tides ensured the system was synchronized and circularised. When mass transfer ceased and the pulsar companion started to contract to a white dwarf, the tides became inefficient and the rotational evolution of the companion was determined by conservation of angular momentum. Thus, the rotational periods scale inversely with the moments of inertia.
The moment of inertia of the progenitor can be separated in that of the core and the envelope; with and , where is the gyration radius. As the progenitor fills its Roche-lobe of radius , we have . After mass transfer, when the envelope has contracted to form the white dwarf, the white dwarf has . Assuming that and ignoring differences in the gyration radii, conservation of angular momentum gives . Here, two assumptions lead to an overestimate of the spin up; the envelope will be more centrally concentrated than the white dwarf, such that , while tidal dissipation will be important in the initial stages of contraction. On the other hand, the hot core of the progenitor will be larger than the white dwarf, so (though generally this effect should be small, since in most cases ).
For a white dwarf with a mass of 0.17–0.18 and a radius of 0.042–0.058 , and for the observed mass ratio of and orbital period of 20 h, the Roche-lobe radius of the progenitor is about . After cessation of mass transfer, the remaining envelope has a mass of about . With these values we estimate that the rotational period of the white dwarf is about 20–30 times faster than the orbital period, so to 0.6 h. In that case, the rotational velocity would be of the order of 50–100 km s-1. This is smaller than the 300 km s-1 estimated above, and since our assumptions likely led us to overestimate the rotational velocity, it seems unlikely that rotational broadening alone could explain the discrepancy between the surface gravity inferred from the spectrum and that inferred from the radius assuming that PSR J19115958A is a member of NGC 6752.
B.3 Constraints from radio timing
D’Amico et al. (2002) give two arguments for the association of PSR J19115958A with NGC 6752. The first one is that it was discovered in an observation of a globular cluster: the dedicated globular cluster observations with Parkes together cover a relatively small area compared to the whole sky, and the detection of a rare millisecond pulsar in this area suggests membership of the cluster. The problem is that the dedicated cluster observations are much deeper than most other pulsar observations, and that the number of millisecond pulsars at the flux level of PSR J19115958A, 0.22 mJy at 1400 MHz, and their distribution on the sky, are not known. Estimates based on extrapolation are uncertain. The accuracy of the estimate by D’Amico et al. of a probability for a chance coincidence is therefore not clear. D’Amico et al. (2002) used the center beam of the Parkes multibeam receiver in their discovery observation. The diameter of that beam is about 14′ (Manchester et al., 2001), and thus any pulsar detected in the globular cluster survey must lie within 7′ from the cluster center. We conclude that the argument from the probability of chance coincidence is less solid than the number might suggest.
The second argument of D’Amico et al. (2002) is that PSR J19115958A has a dispersion measure pc cm-3, almost the same as the dispersion measure pc cm-3 of the three pulsars in the cluster core, two of which certainly belong to the cluster as proven by a negative period derivative. According to the Taylor & Cordes (1993) model, the maximum dispersion measure in the direction of NGC 6752 and PSR J19115958A is pc cm-3. Since the values of the pulsars in the core of NGC 6752 (and of PSR J19115958A) are less than this, the pulsar would be almost at the distance of the cluster. However, the maximum to the dispersion measure arises because the electron layer in our Galaxy has a finite scale height of 0.5 to 1 kpc, and this implies that all pulsars above the electron layer have the same dispersion measure in the same direction (Bhattacharya & Verbunt, 1991). Since NGC 6752 is at a distance of kpc and a Galactic latitude of , it is well above the electron layer, and its observed must be equated with the actual in that direction. (This is compatible with the uncertainty of about in the model value of , which gives 13 pc cm-3 for pc cm-3; Nelemans et al. 1997). We conclude that the dispersion measure of PSR J19115958A does not prove that it is a member of the cluster, but merely that it is above the galactic electron layer, i.e., at a distance kpc.
B.4 White dwarf models
Finally, we cannot discard the possibility that the white-dwarf models themselves are uncertain. This can already be seen from the mass-radius relations shown in Fig. 6. These relations are for the observed temperature of K, but, for a given mass of say, 0.20 M⊙, the predicted radii show a spread of about 0.01 R⊙.
A part of this problem is the lack of low-mass, helium-core white dwarfs for which accurate parameters have been determined and which could be used to calibrate the evolution, cooling and atmospheric properties of these systems.
B.5 Summary and prospects
Summarizing the results of this section, we see that, at face value, the systematic radial velocity and radius estimate indicates that PSR J19115958A is not a member of NGC 6752. Furthermore, we have argued that the similarity in dispersion measure for all all five pulsars located towards NGC 6752 does not necessarily imply that they are all at the same distance.
However, our observations do not conclusively rule out the membership of the pulsar and the globular cluster either. All constraints are consistent at the level, and the inconsistencies of the constraints may be removed when we take into account that there is an allowed range in radial velocity due to the velocity dispersion, that there may be broadening of the Balmer lines in the spectrum of the white dwarf and that there are possible uncertainties in the white-dwarf models themselves. As such, it is for future observations to decide between either possibility.