Extreme Deuteration and Hot Corinos: the Earliest Chemical Signatures of Low-Mass Star Formation
Abstract
Low-mass protostars form from condensations
inside molecular clouds when gravity overwhelms thermal and magnetic
supporting forces. The first phases of the formation of a solar-type
star are characterized by dramatic changes not only in the physical
structure but also in the chemical composition. Since PPIV
(e.g., Langer et al.), exciting new developments have occurred in our
understanding of the processes driving this chemical evolution. These
developments include two new discoveries : 1) extremely enhanced
molecular deuteration, which is caused by the freeze-out of
heavy-element-bearing molecules onto grain mantles during the Prestellar
Core and Class 0 source phases; and 2) hot corinos, which are warm and
dense regions at the center of Class 0 source envelopes and which are
characterized by a multitude of complex organic molecules. In this
chapter we will review these two new topics, and will show how they
contribute to our understanding of the first phases of solar-type
stars.
1 INTRODUCTION
Molecular clouds are the placentas inside which matter evolves from embryos to stars and planetary systems. The material in the molecular cloud feeds the newly forming system. During this formation, the material undergoes several dramatic changes. This chapter focuses on the changes of the chemical composition during the first phases of star formation.
There are several reasons why the study of chemistry in the first phases of star formation is fascinating and important. Among them, two stand out. First, chemistry is a very powerful diagnostic, both of the current and the past physical conditions of the forming protostar. Much of this chapter will be spent in illustrating that point in detail. In addition, chemistry in the first phases of star formation may affect the chemical composition of the objects that will eventually form the planetary system: planets, comets, and asteroids. In this sense, the study of chemistry during the first phases of star formation is far-reaching. Indeed, one of the major and more fascinating questions linked to the process of the formation of a star and its planetary system, especially if similar to our Solar System, is: what is the chemical budget acquired during the protostellar phase and inherited by the forming planets? Answering this question might even shed some light on our own origins. The above ultimate question implies answering several linked questions: what molecules are formed during the protostellar phase? Do molecules exist that are formed prevalently during the protostellar phase, and that are therefore a hallmark of this period? What is their fate? Do they condense onto the grain mantles during the proto-planetary phase? Are they incorporated into planetesimals, which eventually form comets, meteorites and planets? Are these pristine molecules released into nascent planetary atmospheres during early, intense cometary bombardment? And what is the ultimate molecular complexity reached during star formation? In this contribution we will focus on the first questions, those related to the first phase of star formation.
The story starts with the first step towards collapse: the Prestellar Core phase (see the chapters by Di Francesco et al. and Ward-Thompson et al.). These objects are cold ( K) and dense ( cm-3) condensations inside molecular clouds. What makes them particularly important is that they are believed to be on the verge of collapse (Tafalla et al., 1998; Caselli et al., 2002b; Young et al., 2004; Crapsi et al., 2005b), and, in this sense, they are considered to be representative of the initial conditions of star formation. During this phase, matter slowly accumulates towards the center under the gravitational force, which counteracts the thermal and/or magnetic pressure. As the density increases, gaseous molecules start to freeze-out onto the cold dust grains, forming H2O-dominated ice mantles “dirtied” with several other molecules. The process is so efficient that in the innermost and densest regions of the condensation, heavy-element-bearing molecules are thought to be virtually all frozen out. The low temperatures and the disappearance of most molecules, and particularly of CO, from the gas phase trigger a peculiar chemistry: an extreme molecular deuteration.
| Name | (CO) | Mol. | Ref. | |
|---|---|---|---|---|
| (105 cm-3) | D/H | a | ||
| L1521F | 3 | 2.5 | 0.01 | 1,2,3 |
| B68 | 1 | 3.4 | 0.03 | 3,4 |
| L1689B | 1 | 4.5 | 0.09 | 3,6,7,8 |
| L183 | 10 | 12 | 0.22 | 3,9 |
| L1544 | 14 | 14 | 0.23 | 3,6,10 |
| L694-2 | 9 | 11 | 0.26 | 3 |
| L429 | 6 | 16 | 0.28 | 3,6,7 |
| OphD | 3 | 14 | 0.44 | 3,6,7 |
| L1709A | 1 | 5.5 | 0.17 | 6,7 |
| L1498 | 1 | 7.5 | 0.04 | 3,5 |
| L1517B | 2 | 9.5 | 0.06 | 3,5 |
Once gravitational contraction finally takes over, a protostar is born, consisting of a central object, which eventually will become a star, surrounded by an envelope from which the future star accretes matter. In the beginning, the envelope is so thick that it obscures the central object, and the Spectral Energy Distribution (SED) is totally dominated by the cold outer regions of the envelope, with a temperature lower than K. This phase is represented by so-called Class 0 sources (André et al., 2000). Most of the envelope is cold and depleted of heavy-bearing molecules, frozen onto the grain mantles, exactly as in Prestellar Cores. However, the presence of a central source, powered by gravitational energy, causes the heating of the innermost regions of the envelope. In these regions the dust temperature reaches 100 K, causing the evaporation of the grain mantles formed during the Prestellar-Core phase. The molecules trapped in the ices are injected back into the gas phase, giving rise to a rich and peculiar chemistry. Complex organic molecules are found in these regions, called Hot Corinos.
In this chapter, we will show that extreme deuteration and Hot Corinos are specific signatures of the first phases of low-mass star formation. The chapter is organized as follows. We first briefly describe the physical and chemical structures of Prestellar Cores and Class 0 source (Section 2). We then discuss in detail the deuteration phenomenon (Section 3), Hot Corinos (Section 4), and the chemical models that have been developed to explain these observations (Section 5). The chapter ends with our conclusions.
We conclude this section by listing a few reviews appeared in the literature related to the subjects treated in this chapter. Previous reviews of the chemistry in general are reported in Herbst (2005), and during the star formation period in van Dishoeck and Blake (1998), Langer et al. (2000) and Caselli (2006). Reviews of the observations of multiply deuterated molecules as well as the related chemical models can be found in Roueff and Gerin (2003), Ceccarelli (2004a) and Millar (2005), and on the Hot Corinos in Ceccarelli (2004b).
2 THE PHYSICAL AND CHEMICAL STRUCTURE IN THE FIRST PHASES OF THE COLLAPSE
Since PPIV, our understanding of the physical (temperature and density profiles) and chemical (molecular and atomic abundance profiles) structure of matter in the first phases of low-mass star formation has improved considerably. This is due both to the increased sensitivity of ground-based instruments and to the development of sophisticated models to interpret the data. In this section, we review the observations and their interpretations, which have led to the reconstruction of the gas density, temperature and molecular composition in both Prestellar Cores and Class 0 sources.
2.1 Prestellar Cores
Several authors have studied the physical and chemical structure of starless cores; detailed reviews are presented in the chapters by Di Francesco et al. and Ward-Thompson et al.. Here we briefly recall the basic properties characterizing Prestellar Cores, and discuss some aspects complementary to those presented by the mentioned authors. First, the density profiles of the studied Prestellar Cores are reasonably well represented by Bonnor-Ebert spheres. In practice, the density profile can be approximated by a power law in the outer regions and a plateau in the center regions of the Prestellar Core. In the following we will refer to the density in the plateau as the “central” density. Typically, the radius of the plateau is 3000-6000 AU (Crapsi et al., 2005a). Figure 1 shows the example of L1544, one of the best studied Prestellar Cores (Tafalla et al., 1998; Caselli et al., 2002b, c), but other Prestellar Cores present basically the same structure (Alves et al., 2001; Crapsi et al., 2005a). In the same figure, the predicted temperature profile is also shown. Note the temperature drop in the inner 3000 AU region, confirmed by observations of NH3 (Craspi et al. in prep). A similar drop in the dust temperature has been previously observed in other Prestellar Cores (Evans et al., 2001; Pagani et al., 2003, 2004, 2005), as expected from radiative transfer modeling of centrally concentrated and externally heated dense cloud cores (Zucconi et al., 2001). These large central densities and low temperatures are accompanied by the depletion of CO molecules in the central regions, as they condense out onto the grain mantles (Evans et al., 2001; Caselli et al., 1999; Galli et al., 2002).

Indeed, if one had to give a short list of properties for the Prestellar Cores they would be large central densities: cm-3; very low central temperatures: K; depletion of molecular species, including CO; and enhanced molecular deuteration. Table 1 summarizes these properties in a sample of Prestellar Cores.

In Figure 2 we show the observed CO depletion factors versus the central densities, where the depletion factor is computed with respect to the standard CO abundance in molecular clouds, with respect to H2 (Frerking et al., 1982). As can easily be seen, there is a clear correlation between the CO depletion factors and the densities. This observationally confirms the basic idea that CO molecules disappear from the gas phase because they freeze-out onto the grains, and that the condensation rate is proportional to the density (see below). Figure 2 also reports theoretical curves, obtained assuming that the CO molecules condense onto the grains at a rate and are released in the gas phase because of the evaporation caused by cosmic rays at a rate s-1 (Hasegawa and Herbst, 1993). The freezing rate can be written as follows:
| (1) |
where we adopted a sticking coefficient (Burke and Hollenbach, 1983), and a mean grain radius of . The grain number density is given by the (mass) dust-to-gas ratio (0.01) multiplied by the gas density, and divided by the grain mass (computed assuming a grain density of 2.5 gm cm-3). The figure shows curves assuming an average grain radius of 0.1 (solid lines) and 0.5 m (dashed lines) respectively. In the first case, which is the typical value assumed in chemical models for the ISM, the denser Prestellar Cores lie around the curve with an age of yr, which is definitively too short an age for these objects, based on several arguments. However, if the average grain radius is larger and equal to 0.5 m, for example, the observed points lie around the curve at yr, which is a more realistic estimate of the age of these objects. Larger grains would shift the curve even more to larger ages. Note that we used the same value for the cosmic ray evaporation rate, although increasing the grain sizes decreases it because of the larger volume to heat (Bringa and Johnson, 2004; Shen et al., 2004), enhancing the effect. Since the surface is dominated by the small grains, Figure 2 suggests that the small grains are efficiently removed by coagulation with large grains in the innermost regions of Prestellar Cores (Ossenkopf, 1993; Bianchi et al., 2003; Flower et al., 2005). Other explanations are also possible. For example, the cosmic ray evaporation rate can be enhanced if the ice mantles contain a substantial ( 1%) fraction of radicals due to UV photolysis (D’Hendecourt et al., 1982, 1986). However, in order to explain Figure 2 the mantle evaporation rate should be increased by more than a factor 30 with respect to the Hasegawa and Herbst (1993) rate. Therefore, our preliminary conclusion is that, most likely, the average sizes of the grains in Prestellar Cores are larger than in the ISM, and that these objects are older than about yr. It is also interesting noticing that less dense Prestellar Cores point to greater ages and/or smaller average grain sizes. It is not clear at this stage whether this means that those cores will not evolve into denser ones, or whether Prestellar Cores spend more time in this first “low-density” phase than in the “high-density” phase.
2.2 Class 0 sources
The physical and chemical structure of the envelopes of Class 0 sources is affected by the presence of a central object, i.e. a heating source, which implies gradients in the density and temperature. This, in turn, implies a gradient in the chemical composition of the gas across the envelope. Two basic methods have been used in the literature to derive the chemical and physical structure of Class 0 envelopes: i) modeling of multi-frequency observations of several molecules, and ii) modeling of the continuum SED and map, coupled with molecular multi-frequency observations. The first method makes use of the intrinsic property that each line from any molecule probes the specific region where the line is excited, namely a region with a specific density and temperature. Using several lines from the same molecule can, therefore, be used to reconstruct the gas density and temperature profiles of the envelope. The observations of several molecules are then used to derive the abundance profile of each molecule. Theoretical examples of this method, applied to the problem of collapsing envelopes, are discussed in Ceccarelli et al. (2000a), Maret et al. (2002a), Ceccarelli et al. (2003), and Parise et al. (2005b). In these models the density is assumed to follow the evolution of a Singular Isothermal Sphere contracting under the hypothesis of isothermal collapse - the so-called “inside-out” framework, developed by Shu and collaborators (Shu, 1977). In this framework, the density follows a two-slope power law: in the regions not reached by the collapse the density has an dependence, whereas in the collapsing regions the density follows an law.
In addition, in using molecular line observations, one has to also take into account the abundance profile of the molecule used. The simplest profile is that of a single step function, which assumes that the relevant molecule has an almost constant abundance in the cold outer envelope and a jump in the inner region when the grain mantles sublimate. Other profiles have been used though, in which the abundance also has a drop in the outer envelope, to take into account the molecular depletion as in Prestellar Cores (Ceccarelli et al., 2001; Schöier et al., 2004; Jørgensen et al., 2004).
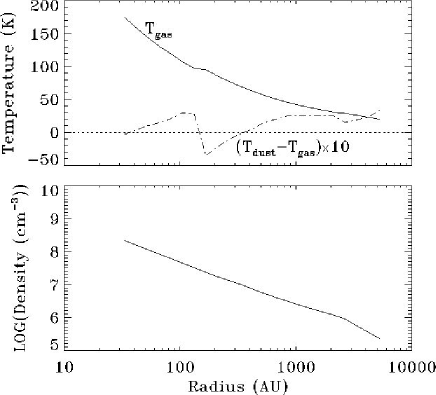
The second method uses the dust continuum SED simultaneously with maps to trace the H2 distribution, and the observations are best-fitted with assumed single power law density distributions (Shirley et al., 2002; Jørgensen et al., 2002; Williams et al., 2005; Young and Evans, 2005). Then, in order to derive the molecular abundance profiles, single-jump and/or drop models are used to interpret multi-frequency observations, as in Schöier et al. (2002), Schöier et al. (2004), Jørgensen et al. (2004), and Evans et al. (2005). Both methods give approximatively the same structure (temperature and density distribution) when applied to the same object, as in the case of IRAS16293-2422 (Ceccarelli et al., 2000a; Schöier et al., 2002). Figure 3 shows the derived structure of the envelope of this source, obtained by applying the first method to several molecules (Ceccarelli et al., 2000a, b).
Both classes of models predict the existence of regions with dust temperatures larger than 100 K, the sublimation temperature of the grain mantles (Ceccarelli et al., 1996). In these regions, therefore, the components of the grain mantles are injected into the gas phase, and the abundances of the corresponding molecules should increase with respect to the abundance in the cold (T K) envelope. Water is the major component of the ice mantles, but unfortunately water lines are not observable from ground-based telescopes. The spectrometer LWS on board ISO provided observations of water lines towards a few Class 0 sources (Ceccarelli et al., 1999), but with relatively poor spatial and spectral resolution, so that the interpretation of the data is not unique. Two interpretations have been advanced. The first one assumes that the water lines originate in the shocks at the interface between the outflows and the envelopes of these sources (Giannini et al., 2001; Nisini et al., 2002). The second one assumes that the water lines originate mostly in the envelope. Based only on the ISO data, it is impossible to discriminate observationally between the two hypotheses. However, if the water line spectra are interpreted as being emitted in the envelope, allowing a jump in the water abundance in the T K region, the agreement among the model predictions and the observed line fluxes is rather good (Ceccarelli et al., 2000a; Maret et al., 2002b). The observed data are reproduced if the water abundance is in the outer envelope, and jumps by about a factor 10 in the inner region. In support of this interpretation, the physical structure derived by this analysis is substantially confirmed by observations of other molecules obtained with ground-based telescopes (see below).
Formaldehyde is also an important grain mantle component, and this molecule has the advantage that it has several transitions in the millimeter to sub-millimeter wavelength range observable with ground-based telescopes (Mangum and Wootten, 1993; Ceccarelli et al., 2003). These observations have a much better spatial and spectral resolution than ISO-LWS and provide stronger constraints for the models. A survey of the H2CO line emission towards a bit fewer than a dozen Class 0 sources has shown that all the targeted sources, except VLA16293, have a region where the formaldehyde abundance jumps by more than one order of magnitude (Ceccarelli et al., 2000b; Maret et al., 2004). Several of these sources also show jumps in the methanol abundance (Maret et al., 2005). The predicted sizes of the jump regions range from 10 to 150 AU, and are, therefore, comparable to the sizes of the Solar System. The densities are predicted to be larger than 108 cm-3. However, one should be aware that the above observations have been obtained with single-dish telescopes, which, at best, have spatial resolutions corresponding to about 1000 AU in radius. Therefore, both the estimates of the abundances and the warm region sizes suffer from a relatively large uncertainty. Besides, the details of the model adopted in the analysis of the data give rise to additional systematic uncertainties so that the very existence of the H2CO abundance jumps is contested by some authors (Schöier et al., 2004; Jørgensen et al., 2005c, a). In addition, the situation is further confused by the presence at small scales of cavities and outflows, which some authors also consider a major component in the line emission attributed to the abundance jumps of the above analysis (Chandler et al., 2005; Jørgensen et al., 2005b).
Finally, several simple molecules ( HCO+, N2H+, CS, SO,
SO2, HCN, HNC, HC3 N and CN) have been observed in a sample of
Class 0 sources (Jørgensen et al., 2004). Given the observed
transitions, this study was able to trace the abundance of the
observed species in the outer envelope and probe some formation
routes, such as for N2H+ and HCO+. One remarkable result is
the discovery of large regions in the outer envelopes where the
molecular abundances are depleted, because of condensation onto
grain mantles (Maret et al., 2004; Jørgensen et al., 2005d).
However, even more remarkable is the discovery of
extreme deuterium fractionation in the Class 0 sources, which will be
discussed in Section 3, and which is indeed
linked to the molecular depletion.
In summary, from a chemical point of view, the similarity to Prestellar Cores is the most prominent characteristic of the outer envelopes of Class 0 sources. With respect to molecular depletion and extreme deuteration, they are indeed virtually indistinguishable, suggesting that Prestellar Cores are the likely precursors of Class 0 sources (Maret et al., 2004; Jørgensen et al., 2005c).
3 EXTREME DEUTERATION
The previous section has anticipated a major characteristic shared by Prestellar Cores and the envelopes of Class 0 sources: an extreme molecular deuteration. Although the deuterium abundance is relative to hydrogen (Linsky, 2003), singly deuterated molecules have been observed in both types of objects with abundances relative to their hydrogenated counterparts between 10% and 50% (Guélin et al., 1977; Loren et al., 1990; van Dishoeck et al., 1995; Tiné et al., 2000; Shah and Wootten, 2001; Roberts et al., 2002; Crapsi et al., 2004, 2005a). Even more extreme, doubly and triply deuterated molecules have been observed (Table 2) with D/H ratios reaching 30% for D2CO (Loinard et al., 2002) and 3% for CD3OH (Parise et al., 2004). This enhances the molecular D/H ratio by up to 13 orders of magnitude with respect to the elemental D/H ratio. In this section, we review these spectacular observations, which have led to the development of a new class of models for molecular deuteration, described in Section 5. It is worth emphasizing that extreme fractionations have only been observed in low mass Prestellar Cores (Section 3.1) and protostars (Section 3.2) so far. Massive protostars do not show the same deuterium enrichment, probably because the chemistry occurs in warmer environments.
3.1 Prestellar Cores
In the last few years, it has become increasingly clear that molecular deuteration reaches extreme values in Prestellar Cores, where multiply deuterated molecules have been detected with ratios larger than 1%. The list of multiply deuterated molecules detected in Prestellar Cores (and Class 0 sources) is reported in Table 2, as well as the typical measured D/H ratio for each species.
| Species | Deuterium | Ref. |
| Fractionation | a | |
| NHD2 | 0.03 | 1,2,3 |
| ND3 | 0.006 | 3,4,5 |
| D2CO | 0.15 | 6,7,8 |
| D2S | 0.12 | 9 |
| HD | 1 | 10 |
| CHD2OH | 0.06 | 11,8 |
| CD3OH | 0.03 | 12 |
| D2CS | 0.10 | 13 |
aREFERENCES:1- Roueff et al. (2000); 2- Loinard et al. (2001); 3- Roueff et al. (2005) 4- Lis et al. (2002); 5- van der Tak et al. (2002); 6- Ceccarelli et al. (1998); 7- Bacmann et al. (2003); 8- Parise et al. (2006); 9- Vastel et al. (2003); 10- Vastel et al. (2004); 11- Parise et al. (2002); 12- Parise et al. (2004); 13- Marcelino et al. (2005).
To the best of our knowledge, two surveys of multiply deuterated molecules – D2CO (Bacmann et al., 2003) and ND3 (Roueff et al., 2005) – have been obtained in (small) samples of Prestellar Cores. Bacmann et al. (2003) found that the D2CO/H2CO ratios correlate with the CO depletion factors, proving observationally the key role of CO depletion in the deuterium enhanced fractionation. This trend is confirmed now by the larger sample of Table 2, as shown in

Figure 4: the larger the CO depletion the larger the molecular D/H ratio (see also Crapsi et al. (2005a)). This is a key point whose importance will be further discussed in Section 5. Another aspect shown in the figure is the similarity of the D/H ratio of the three observed molecules: N2H+, H2CO and NH3. Note that the three molecules refer to the D/H ratios of singly, doubly and triply deuterated isotopologues respectively, and the ratios shown in the figure are scaled to account for the number of D atoms. While N2H+ is certainly a gas phase product (formed by the reaction of N2 with H), there is considerable debate on whether formaldehyde and ammonia are formed in the gas phase or on grain surfaces (Tielens, 1983; Ceccarelli et al., 2001; Roueff et al., 2005); Section 5). From a purely observational point of view, Figure 4 points to a similar origin for the three molecules, but this is very likely an over-simplification, and maybe just due to the common origin of the molecular deuteration, the molecular ion H2D+ (Section 5).
Indeed, it has been long believed that the deuterium fractionation is started by the fast ion-neutral reaction H+HD leading to H2D+ (Section 5.1). For this reason, H2D+ has long been searched for in regions of massive star formation, where, however, it has never been detected (van Dishoeck et al., 1992; Pagani et al., 1992). The first detection of H2D+ was finally obtained by Stark et al. (1999) towards the low-mass Class 0 source NGC1333-IRAS4. However, the break-through detection is considered to be that obtained in the Prestellar Core L1544 (Caselli et al., 2003), where the ground ortho-H2D+ line at 372 GHz is ten times brighter than in NGC1333-IRAS4. The observed flux implies an abundance of H2D+ similar to that of electrons, and, therefore, to that of H. This was unexpected and unpredicted by the chemical models at the time of the discovery. It is now accepted that the H2D+/H ratio can reach unity in cold gas depleted by heavy-element-bearing molecules, as occurs at the centers of Prestellar Cores (Section 2.1). Actually, in the extreme conditions of the centers of Prestellar Cores, even the doubly deuterated form of H has been detected (Vastel et al., 2004). The map of H2D+ emission in L1544 shows that it is very abundant in a zone with diameter AU (Vastel et al., 2006). This zone coincides with the central density plateau, where CO is highly depleted (Caselli et al., 1999). This further proves the key role played by the freezing of heavy-element-bearing molecules in the enhancement of molecular deuteration. Finally, one has to note that L1544 is not a peculiarity. An on-going project shows that Prestellar Cores are in general strong emitters of the ground ortho-H2D+ line ( 0.5 K; Caselli et al., in prep.).
Thanks to the above observations, the very high diagnostic power of the ground-state ortho-H2D+ line is now realized. This is true not only for chemistry, but also for the study of the evolutionary and dynamical status of Prestellar Cores. For example, the ortho-to-para ratio of H2D+ is predicted to critically depend on the density, temperature and grain sizes (Flower et al., 2005, 2006). Comparing these model predictions with observations, Vastel et al. (2006) found that the average grain sizes in L1544 are larger than in the ISM (in agreement with the discussion in Section 2.1). Finally, since very likely most of the heavy-element-bearing molecules are frozen out onto the grain mantles in the centers of the Prestellar Cores, H2D+ is the best, if not the only way to probe those regions. Of particular interest is knowing the kinematical structure and whether and when the collapse starts at the center. van der Tak et al. (2005) studied the lines profile of the fundamental ortho-H2D+ line towards L1544 with this scope. They found that the infall likely started at the center of L1544. We predict that similar studies with submillimeter interferometers will be extremely useful to unveil the first instants of collapse.
3.2 Class 0 sources
As for Prestellar Cores, recent observations have revealed a zoo of molecules with enhanced deuterium fractionation. Actually, the discovery of abundant D2CO in a Class 0 source started the hunt for multiply deuterated molecules. Although doubly deuterated formaldehyde had been detected fifteen years ago in Orion by Turner (1990), the measured abundance (% H2CO) did not seem to draw particular attention (probably because Orion has always been considered a peculiar region). The discovery that D2CO has an abundance about 5% that of H2CO in a low mass protostar, IRAS16293-2422 (Ceccarelli et al., 1998), on the contrary, started a flurry of activity in this field, and initiated the hunt for multiply deuterated molecules. In a few years, the deuterated species quoted in Table 2 were detected.

The best studied Class 0 source is IRAS16293-2422, where multi-frequency observations of singly and doubly deuterated formaldehyde constrain the abundance ratios of these molecules quite well (Loinard et al., 2000) to be HDCO/H2CO = 0.15 and D2CO/H2CO = 0.05. Besides, D2CO is very abundant across the entire envelope, which extends up to a radius of more than 5000 AU (Ceccarelli et al., 2001). Remarkably, the D2CO/H2CO ratio reaches a peak of 0.16 at about 2000 AU from the center. Note that the dust at this distance is warm enough to prevent the condensation of CO, and the gas is too warm, K, to favor the deuterium fractionation in the gas phase (Ceccarelli et al., 2000a; Schöier et al., 2002). In a few words, the two key factors for the enhanced fractionation, cold and CO-depleted gas, are absent in the largest fraction of the IRAS16293-2422 envelope, where D2CO is abundant. Therefore, the observed enhanced deuterium fractionation is unlikely to be a present-day product (Ceccarelli et al., 2001). In support of this view, the formaldehyde abundance profile across the IRAS16293-2422 envelope increases by about a factor of ten where the dust temperature exceeds 50 K, suggesting that gaseous formaldehyde is due to the partial, but continuous sublimation of the grain mantles across the entire envelope. Layered like onions, the components of the mantles sublimate at different distances, corresponding to different dust temperatures. In the regions where the dust temperature is larger than about 25 K, CO-rich mantles sublimate, injecting into the gas phase the CO and the trace molecules trapped in the ice, like formaldehyde. When the dust temperature reaches 50 K the H2CO-rich ices sublimate and so on (Ceccarelli et al., 2001). The observed deuteration is therefore a heritage of the pre-collapse phase (Section 3.1).
This can also be seen in Figure 5, where the measured D/H ratios of formaldehyde and methanol are reported as function of CO depletion in a sample of Class 0 sources (Parise et al., 2006). Contrary to the Prestellar Cores, there is no clear correlation between the molecular deuteration and the present CO depletion. The most plausible explanation is that the deuterated formaldehyde and methanol have been built up during the previous phase and that Class 0 sources are young enough for it not being substantially modified, likely younger than yr based on modeling (Charnley et al., 1997). Figure 5 also shows that methanol is systematically more enriched with deuterium than is formaldehyde. This may reflect a different epoch of formation of these two molecules on the ices: the formaldehyde perhaps formed in an earlier stage than methanol, when CO depletion was less severe. Alternatively, present day gas-phase reactions may have changed the initial mantle composition already, or, finally, formaldehyde and methanol follow different routes of formation (gas phase versus grain surface?) (Parise et al., 2006).
Although our comprehension of the mechanisms leading to molecular deuteration in the ISM has undoubtedly improved in these last few years, there still remain a number of unresolved questions. First, the relative role of gas phase versus grain surface chemistry is uncertain: it is not completely clear yet what molecules and to what extent are formed in the gas phase versus on the grain surfaces. Deuterium fractionation promises to be a key aspect in this issue. Another open question is represented by deuterated water. Searches for solid HDO have so far been in vain, giving some stringent upper limits to the water deuteration: % (Dartois et al., 2003; Parise et al., 2003), considerably less than the deuteration observed in the other molecules. One possible explanation is that observations of solid H2O and HDO may be “contaminated” by the contribution of the molecular cloud in front of the observed protostar (see for example the discussion in Boogert et al. (2002)). A more stringent constraint is set by observations of gas-phase HDO in the outer envelope and hot corino, where the icy mantles sublimate. Observations towards IRAS16293-2422 set a stringent constraint to the deuteration of water; in the sublimated ices it is %, whereas in the cold envelope it is % (Parise et al., 2005a). Therefore, water deuteration seems to follow a different route from formaldehyde, methanol, and the other molecules.

4 HOT CORINOS
While the outer envelopes of Class 0 sources are so cold that heavy-element-bearing molecules are at least partially frozen onto the grain mantles, the innermost regions are characterized by warm dust, so warm that the mantles sublimate totally (Section 2.2). These regions share several aspects of the hot cores, discovered in the 80s around massive protostars (Kurtz et al., 2000). Being “smaller” in size and mass, they have been called hot corinos (Ceccarelli, 2004b; Bottinelli et al., 2004b). Based on the analysis discussed in Section 2.2, the radii of the hot corinos are predicted to be around 50 AU (IRAS16293-2422 represents here an exception with a radius of 150 AU), comparable to the sizes of the Solar System. The key question, and the most relevant for the chemical structure of Class 0 sources, is which molecules are found in the hot corinos, and, in particular, whether complex organic molecules are formed, in analogy with massive hot cores. More generally, are the hot corinos a scaled version of the hot cores, or does a peculiar chemistry take place? And, how reliable are the hot corino sizes derived by the analysis of single-dish data?
Once again, the benchmark for these studies has been IRAS16293-2422. In the hot corino of this source, complex organic molecules were detected for the first time (Cazaux et al., 2003), and this hot corino was the first to be imaged (Kuan et al., 2004; Bottinelli et al., 2004b). In practice, all the complex molecules typical of massive hot cores that have been searched for were detected, with abundances similar to if not larger than those measured in hot cores (Cazaux et al., 2003). These species include O and N-bearing molecules such as formic acid, HCOOH, acetaldehyde, CH3CHO, methyl formate, HCOOCH3, dimethyl ether, CH3OCH3, acetic acid, CH3COOH, methyl cyanide, CH3CN, ethyl cyanide, C2H5CN and propyne, CH3CCH. Two years after the first detection in IRAS16293-2422, complex organic molecules were also detected towards the other Class 0 sources NGC1333 IRAS4A and B, and NGC1333 IRAS2 (Bottinelli et al., 2004a; Jørgensen et al., 2005a; Bottinelli et al., 2006b). The abundances of the O-bearing complex molecules detected in the four hot corinos are shown in Figure 6 as functions of the methanol abundance (Bottinelli et al., 2006b). Note that the abundances have been normalized to the methanol abundance so that they do not depend on the uncertain sizes of the hot corinos. The number of hot corinos where complex organic molecules have been detected is evidently much too small to try to draw firm conclusions based on statistical considerations. Nevertheless, it is obvious that complex organic molecules are rather common in hot corinos. In this respect, the prototypical Class 0 source, IRAS16293-2422, may actually be representative for Class 0 sources. Furthermore, the abundances of HCOOH, HCOOCH3 and CH3OCH3 in hot corinos are comparable to the methanol abundance and to formaldehyde (Bottinelli et al., 2006b), and do not depend appreciably on the source luminosity, nor on the methanol and formaldehyde abundance. If the O-bearing complex molecules are formed in the gas phase from methanol and formaldehyde, as some theories predict (Section 5.3), then they “burn” the majority of their “parent” molecules, and this burned fraction is independent of the amount of H2CO and/or CH3OH sublimated from the grain mantles. Alternatively, if the O-bearing complex molecules are synthesized on the grain surfaces, they are an important ice component. So far, however, only HCOOH has been claimed to be found in its solid form (Schutte et al., 1999; Gibb et al., 2000). The other evident message of Figure 6 is that hot corinos are not a simply scaled version of hot cores. The abundance of the O-bearing complex molecules in hot corinos is larger than that in hot cores, by more than a factor of ten: HCOOH is even 100 times more abundant.
So far, we have focused on results based on single-dish observations. These observations encompass regions of at least 1000 AU, whereas the predicted sizes of the hot corinos do not exceed 150 AU. Recently, interferometric observations have resolved the emission of complex organic molecules in the hot corinos towards IRAS16293-2422 (Kuan et al., 2004; Bottinelli et al., 2004b; Chandler et al., 2005), NGC1333-IRAS2 (Jørgensen et al., 2005a), and NGC1333-IRAS4B (Bottinelli et al. , in prep.). From these data, a few general conclusions can be drawn. First, for IRAS16293-2422 and NGC1333-IRAS4B, the line emission from the complex molecules is concentrated in two spots, centered on the two objects forming in each case a proto-binary system (Wootten, 1989; Looney et al., 2003; Sandell and Knee, 2001; Di Francesco et al., 2001). The full line flux of the observed complex molecules, detected with the single-dish, is recovered in these two spots, which means that all the single dish emission originates in those regions. In addition, there is no sign of outflows in the line emission of complex molecules; the emission is compact and the line profile is relatively narrow. The brightest – and so far only resolved spot – in IRAS16293-2422 has a radius of 150 AU, close to the size expected for warm ( K) gas (Ceccarelli et al., 2000a). As emphasized above, each of these two objects is indeed a protobinary system. In each case, the two objects in the protobinary have different characteristics; eg., one spot is bright in the continuum but barely detected in the complex molecule line emission, while this is reversed for the other spot. This difference does not necessarily imply that the abundances in the individual spots of these protobinaries are truly different. The spot with the weaker line emission is also unresolved and the line likely optically thick (Bottinelli et al., 2004b). Evidently, high-resolution observations of complex organic molecules are a valuable tool to study the chemistry of the hot corinos, and how it depends on physical conditions, rather than the mantle composition and age, which presumably are the same for the two objects of the binary system.
5 CHEMICAL MODELS
5.1 Molecular deuteration in the gas phase
Although the basic gas-phase mechanism of molecular deuteration in the cold interstellar medium was elucidated almost thirty years ago (Guélin et al., 1977; Watson et al., 1978) and incorporated into detailed models over a decade ago (Millar et al., 1989), it is only recently that an understanding of the effect in star-forming regions has been achieved by astrochemists. Since the reservoir of deuterium lies in the molecule HD, deuteration proceeds by removing deuterium atoms from this molecule onto the many other trace constituents of the gas. The principal mode of transfer at low temperatures has been thought to be the reaction system
| (2) |
in which the left-to-right reaction is exothermic by approximately 230 K. If no other reactions need be considered to determine the abundance ratio of H2D+ to H, the slowness of the backwards reaction leads to the stunning prediction that the abundance of the deuterated ion, now referred to as an isotopologue, can exceed that of H. For cold cores at the standard density of 104 cm-3, the prediction is in error because H2D+ reacts quickly with both electrons and heavy species such as CO. The reactions with heavy species serve to spread the enhanced deuteration around so that typical ratios between singly-deuterated isotopologues (e.g., DCO+) and normal species (e.g. HCO+) are predicted to lie in the range 0.01–0.10, in agreement with observation. Two other exchange reactions are of lesser importance: these involve the ions CH and C2H. Their deuterium exchange reactions with HD leading to the ions CH2D+ and C2HD+ are more exothermic than the H case, so that the backwards reactions are slow up to higher temperatures, and subsequent reactions involving the deuterated ions can maintain deuterium fractionation when H2D+ is no longer enhanced. Other reactions are also non-negligible, including some involving deuterium atoms (Brown and Millar, 1989).
As the density increases, the picture changes dramatically. Near the center of a cold pre-stellar core, for example, the gas density increases to 105-6 cm-3 and the time scale for accretion of species onto dust particles becomes so short that most heavy species are strongly depleted onto dust particles. In addition, the fractional ionization in the gas is thought to become quite low if one takes account of gas-grain interactions to deplete the chemically rather inert atomic ion H+ (Liszt, 2003). Since seemingly all destruction mechanisms of H2D+ are slow, a large abundance of H2D+ does indeed build up, in agreement with observations (Section 3.1). But the story does not end here: in analogy to the reaction above, further reactions with HD convert a significant portion of the H2D+ to the more deuterated isotopologues HD and even D (Roberts et al., 2003; Walmsley et al., 2004; Ceccarelli and Dominik, 2005). Indeed, simple chemical models of the densest portions show the triply deuterated ion to be the most abundant of the four ions in the series, and possibly the most abundant ion in the gas (Roberts et al., 2003).

Figure 7 shows the abundances of the deuterated forms of H, H+ and e-, as functions of the CO depletion factor respectively. Since the age and any other parameter is constant, increasing the depletion factor corresponds to increasing the density. For “intermediate” () CO depletion factors, H2D+ is the most abundant deuterated form of H. However, for larger depletions D takes over, and becomes the dominant positive charge carrier. A similar effect leads to the ions CD and C2D.
Although a tiny region in the center may be completely devoid of heavy species (Walmsley et al., 2004), such molecules do exist, albeit with depleted abundances, near the center (Bergin et al., 2002; Pagani et al., 2005; Lis et al., 2006). The remaining heavy species will react with all three of the deuterating ions, especially D, leading to highly-deuterated isotopologues such as D2CO and ND3. Critical here is the high efficiency of D since, unlike the partially deuterated analogs, it can deuterate and not protonate heavy species. Contrast the reaction
| (3) |
with
| (4) |
In the latter reaction, deuteration occurs on only one of three collisions. The increase in efficiency with D as the deuterating agent is especially important in the formation of multiply deuterated neutral isotopologues, which occurs via a cycle of deuteration followed by dissociative recombination reactions. For example, starting with normal ammonia, deuteration leads to NH3D+, followed by dissociative recombination to form NH2D, followed by deuteration to form NH2D, followed by dissociative recombination to form NHD2, etc (Roueff et al., 2005).
Gas-phase chemical models of Prestellar Cores including deuteration range from simple homogeneous treatments relevant to the center of the core (Roberts et al., 2003) to shell models that can be static (Roberts et al., 2004) or in a state of collapse (Aikawa et al., 2003, 2005). Accretion onto grains must be included in all approaches. The collapse can be treated via analytical approaches (Aikawa et al., 2003) or hydrodynamic simulations (Aikawa et al., 2005). The chemistry occurring on grain surfaces can also be included (Aikawa et al., 2003, 2005). A relatively simple static approach by Roberts et al. (2004) illustrates the power of the chemical models. In terms of column densities, Roberts et al. (2004) obtain a value for D2CO higher by only a factor of three than that observed by Bacmann et al. (2003), and a CO depletion of a factor of 20 compared with the standard value, in good agreement with the observed depletion of 14 (Bacmann et al., 2002) (see also Section 3 and 2). The overall computed D2CO/H2CO ratio is 0.3, also in good agreement with observation. In general, models with collapse are not in as good agreement with observation because it is not facile to vary the details of the collapse to obtain optimal agreement.
5.2 Mantle formation and surface chemistry
As the gas-phase chemistry occurs and mantles accrete in cold sources, a surface chemistry is also active. A proper mathematical treatment of diffusive surface reactions on interstellar grains is not simple. The first such treatments used rate equations analogous to those used for gas-phase processes (Pickles and Williams, 1977), and the method is still the only practical approach to the construction of large gas-grain models (Ruffle and Herbst, 2000). The method is only a rough approximation to reality for a number of reasons, and a variety of more accurate but more complex methods have been advocated. If we imagine grains to be rather smooth surfaces on which binding parameters for adsorbates do not differ strongly from one site to another, there is the problem that only small (fractional) numbers of reactive species such as atomic hydrogen are present on a given grain on average. With such small numbers, it is more reasonable to consider discrete rather than average quantities. Both the discreteness of the problem and the large fluctuations possible from grain to grain then argue for a stochastic approach. Following the pioneering work of Tielens and Hagen (1982), a truly stochastic method was utilized by Charnley (2001) based on Monte Carlo methods, while a master equation approach was advocated by Biham et al. (2001) and by Green et al. (2001). The latter approach has recently been incorporated into moderately sized gas-grain networks by Biham and Lipshtat (2002), Lipshtat and Biham (2004) and Stantcheva and Herbst (2004).
To add to the complexity of the problem, interstellar surfaces are likely to be irregular, porous, and even amorphous, so that binding sites for adsorbates are likely to be diverse, including some that contain much deeper wells than others. A new extension of the Monte Carlo method for irregular grains with silicate, carbonaceous and icy surfaces has been introduced by Chang et al. (2005) and Cuppen and Herbst (2005) for the specific case of the formation of hydrogen molecules. Here, the fraction of binding sites with deep potential wells totally changes the character of the problem since numerous H atoms are present over wide temperature ranges on each grain. Whether or not an approach of this complexity can be extended to large models is unclear. A simpler approach to different binding sites is the physisorption-chemisorption model of Cazaux and Tielens (2004), where only two types of binding sites are considered for H atoms, shallow and deep. In this approximation, rate equations can be used to a reasonable degree of accuracy.
At later stages, the surface chemistry includes deuteration via atomic deuterium, which is produced in the gas by dissociative recombination of deuterated ions; viz., and can lead in very dense regions to an abundance of atomic deuterium nearly equal to the abundance of atomic hydrogen (Roberts et al., 2003, 2004). The H and D atoms land on grains and, because of their rapid diffusion and high surface reactivity, both hydrogenate and deuterate heavy atoms and reactive molecules to form more saturated forms via sequential reactions. For example, the formation of water ice can occur by the addition of two hydrogen atoms to an oxygen atom that lands on a grain surface: . or can start from OH, which can be formed on grain surfaces by successive reactions involving O2 and O3 (Tielens and Hagen, 1982). Note that even if the gaseous O2 is low, an appreciable abundance of O2 can built up on the surface through reactions of O plus O, or O2 can be formed in the reaction of O3 with H. There is even laboratory evidence that hydrogenation of CO into formaldehyde (H2CO) and methanol (CH3OH) occurs (Watanabe et al., 2003; Hidaka et al., 2004): , although two of the hydrogenation reactions possess small activation energy barriers. Following a similar path, not only H2CO and CH3OH are formed but also their deuterated isotopologues (Charnley et al., 1997). It is interesting to note that there is currently no viable formation mechanism for methanol in the gas phase, so that all methanol detected in the gas has its genesis on grain surfaces. This statement is true even for the small amount of methanol detected in cold sources. Here surface formation is followed by inefficient desorption. The results of a number of models – which differ in the sophistication of the gas-grain interaction, their assumptions on initial conditions including gas-phase abundances, and the chemical routes included – have been reported in the literature (Tielens and Hagen, 1982; Hasegawa et al., 1992; Aikawa et al., 2003; Stantcheva and Herbst, 2003; Aikawa et al., 2005). Deuteration on cold surfaces was first explored by Tielens (1983) and later studied by Brown and Millar (1989), Charnley et al. (1997), Caselli et al. (2002a), and Stantcheva and Herbst (2003) among others. The basic picture adopted by astrochemists is that D atoms can deuterate atoms and radicals in a similar manner to the reactions of H atoms. If we, for example, consider the competing deuteration and hydrogenation processes starting with surface CO, all of the different isotopologues and isotopomers of methanol can be produced: CH3OD, CH2DOH, CH2DOD, CHD2OH, CHD2OD, CD3OH, and CD3OD (Charnley et al., 1997). Their relative abundances on grain surfaces depend on the flux ratio between H and D atoms landing on the grains. That the deuteration is more complex than envisioned by astrochemists, however, is shown by some recent experimental evidence provided by Nagaoka et al. (2005) where it seems that even normal methanol can be deuterated by reactions with atomic D on grain surfaces.
All model calculations confirm that ices are produced by surface reactions, and that these ices are, at least on average, dominated by water, as observed. The large amount of CO ice detected by observers is probably mainly the result of accretion from the gas, where this molecule is produced copiously. The production of surface methanol occurs once there is sufficient CO to be hydrogenated. The production of the other very abundant surface species – carbon dioxide (CO2) – is not well understood.
5.3 Mantle evaporation and complex organic molecule formation
A variety of processes can return ice mantle species to the gas phase, even during the cold prestellar core phase. The most important one here is cosmic ray driven desorption where an Fe-cosmic-ray ( MeV/nucleon) temporarily heats the grain to a high enough temperature that some mantle species evaporate (Leger, 1983; Leger et al., 1985). By itself, this process will only return weakly bound species (eg., CO, N2) to the gas phase. However, this process becomes very effective, even for more tightly bound species such as H2O, if the ices contain chemical energy in the form of stored radicals produced by UV photolysis (D’Hendecourt et al., 1982, 1986; Tielens, 2005). It should be emphasized that the thermal shock driven into the grain by the penetrating cosmic ray can also “lift” off a small quantity of larger species (Johnson et al., 1991).
As the protostellar stage commences and temperatures begin to increase, the “dirty” grain mantles will be lost partially or totally via evaporation in a rather complex process stemming from the heterogeneous nature of the mantles (Viti et al., 2004). Nearer to the bipolar outflows associated with protostellar regions, shock waves can also lead to the removal of the mantles. In particular, heating of ice mantles will lead to evaporation and an injection into the warm dense gas of large quantities of grain surface produced species such as water, methanol, and formaldehyde. Reactions among these simple molecules can then lead to more complex species (Millar et al., 1991; Charnley et al., 1992; Caselli et al., 1993; Rodgers and Charnley, 2003; Nomura and Millar, 2004). The process begins with the production of H via cosmic ray bombardment of H2, followed by the reaction of H and H2. This triatomic species, possibly through some intermediaries, transfers its proton to methanol. It has long been believed that the resulting protonated methanol, CH3OH, will rapidly undergo alkyl cation transfer reactions with other species. With CH3OH and H2CO, this might lead to the formation of dimethyl ether and methyl formate, which are abundant complex molecules in hot corinos (Section 4). However, the above reactions advocated to produce methyl formate do not occur, based on laboratory experiments (Horn et al., 2004). A more successful synthesis seems to be the one leading to dimethyl ether:
| (5) |
| (6) |
but it is to be noted that experimental measurements of the neutral products of dissociative recombination reactions show that two-body products such as shown here are often minor channels. Eventually, these complex species are destroyed on a timescale of yr, depending on the temperature and density of the gas, to reform CO. Indeed, if the chemistry were understood well enough, abundances of these species have the potential to be a chemical “clock”, timing the formation of the central object, which has heated up and evaporated the ices. Other determinants of age are abundance ratios of sulfur-bearing species, although the use of these indicators requires sophisticated modeling of both the chemical and the physical structure of the studied object (Wakelam et al., 2004, 2005). The need for such a sophisticated approach arises because the abundance ratios of sulfur-bearing species, used as clocks, turn out to also be dependent on initial abundances following evaporation as well as on physical conditions.
Deuterium fractionation in the ices arises mainly from reactions involving deuterium atoms accreted from the highly fractionated gas. Such fractionation occurs in the abundant surface species (H2O, H2CO, CH3OH, NH3, CH4) acting as signposts of a cold prestellar-core history in which gaseous D atoms are abundant. When these species are returned to the gas, the fractionation becomes more apparent. Although it is sometimes difficult to disentangle purely gas-phase fractionation from surface fractionation followed by evaporation, fractionation in gaseous molecules formed mainly on surfaces (e.g., methanol) is due at least initially to surface reactions. This fractionation will also be passed on to daughter products such as dimethyl ether and methyl formate via gas-phase processes. Thus, the deuteratium fractionation can be used as a tracer of the chemical routes involved in the formation of complex molecules in hot cores. Indeed, the fractionation pattern of dimethyl ether and methyl formate should reflect directly that of methanol and formaldehyde. Eventually, reactions in the warm dense gas of the hot core will reset this deuterium fractionation to that appropriate for the gas temperature (Charnley et al., 1997). This chemical kinetic evolution may run differently for different species or even for different chemical groups in one species. Specifically, for the fractionation pattern of methanol, it has been suggested that protonation of methanol isotopomers followed by dissociative electron recombination reforming methanol will preferentially remove the deuteration from the OH group but not affect the CH3 group (Osamura et al., 2004). The analysis may be incorrect, however, because the most recent storage ring experiments (Geppert et al., 2004) show that protonated and deuterated methanol ions undergo dissociative recombination reactions that lead to virtually no neutral methanol or its isotopologues at all. If all of the gas-phase isotopologues of methanol are depleted at the same rate, then the abundance ratios are indeed determined by the surface chemistry during the previous cooler eon.
6 CONCLUSIONS: CLOSED AND OPEN QUESTIONS
In this contribution, we have summarized new insights into the physical and chemical composition and evolution of Prestellar Cores and Class 0 low-mass Protostars. In particular,
1. On the physical structure, Prestellar Cores can be described by the density distribution of a Bonnor-Ebert sphere, whereas Class 0 sources are consistent with the Shu “inside-out” recipe.
2. At the center of Prestellar Core condensations, densities are so high and temperatures so low that possibly all heavy-element-bearing molecules freeze out onto the dust grains, forming mantles of ices. We discussed the possibility that small grains coagulate into larger grains during this phase.
3. A similar molecular depletion is observed in large regions of the outer envelopes of Class 0 sources. These regions are indistinguishable from Prestellar Cores on this basis, arguing that the latter are precursors of Class 0 sources.
4. The molecular depletion is accompanied by a dramatic enhancement of the molecular deuteration, observed in both Prestellar Cores and Class 0 sources. In the innermost regions of Prestellar Cores, the only observable molecules may be H2D+ and HD, which are likely as abundant as H or even more so.
5. In Class 0 sources, many multiply deuterated molecules have been observed. Even triply deuterated molecules have been detected, with abundances enhanced by up to 13 orders of magnitude with respect to the D/H elemental abundance.
6. Triggered by the observations of multiply deuterated molecules in Prestellar Cores and Class 0 sources, a new class of models for deuteration has been developed in the last few years. These models predict that the low temperatures coupled with the disappearance of heavy-element-bearing molecules from the gas phase cause the formation of abundant H2D+, HD and D, which are extremely efficient in passing their deuterium atoms on to other molecules. In extreme conditions, D is predicted to be the most abundant molecular ion in the gas, surpassing by orders of magnitude the number density of H.
7. During the cold phases of low-mass star formation, grain mantles are formed, consisting mainly of water ice, but with many other molecules in quantities that can be important. Extreme molecular deuteration is a clear hallmark of this phase and is recorded in the mantles. Hydrogenated molecules, like formaldehyde and methanol, are also believed to be formed on the grain surfaces during the cold pre-collapse phase.
8. Class 0 envelopes consist of two chemically distinct regions: the
outer envelopes and the inner regions, called hot corinos. The
border between the two is where the dust temperature reaches the
sublimation temperature of the grain ices. This has a major impact
on the gas chemistry. In the hot corinos, the chemistry is dominated
by the evaporation of the mantles, built up during the pre-collapse
phase. Once the mantle components are in the gas phase, they undergo
successive reactions leading to the formation of many complex
organic molecules, similar to those observed in the hot cores.
Although important progress has been achieved in these last few years, it has also been accompanied by the rise of numerous new questions. For example, while molecular depletion is now an accepted “fact”, it is still not totally clear whether in the innermost regions of the Prestellar Cores the density increases so much that not even a trace of heavy-element species remains in the gas phase. Also, it still remains unclear when and exactly how the collapse starts. It is clear now that observations of heavy-element-bearing molecules may not be the best way to proceed. In contrast, as we now realize, the ground-state transition of ortho-H2D+ (and, to a lesser extent, para-HD) provides a new and exciting probe with which to search for the long-sought collapse in the innermost regions of Prestellar Cores (van der Tak et al., 2005). However, in order to fully exploit this new diagnostic, we have to first fully understand the ortho-para ratio of H2D+ (Flower et al., 2006), which is not measured at all so far. It is also clear that models for the Prestellar Core phase have improved dramatically with the inclusion of the extreme depletions of the gas phase and the formation of the multiply deuterated forms of H. However, these models still struggle to reproduce the extreme observed deuteration, especially that of formaldehyde and methanol. While this is likely due to grain surface chemistry, it remains the case that, unless there is an enhancement in the reactivity of D over H, the gas landing on the grain surfaces at the moment of the mantle formation must have an atomic D/H ratio higher than accounted for by the current gas phase chemistry models. We also have little knowledge as to whether the prediction that D is the most abundant molecular ion in extreme conditions is correct. The coming years will likely see many of these questions answered, with the advent of the satellite Herschel and, foremost, the interferometer ALMA.
If many questions remain about the cold pre-collapse phase, even more questions are unanswered for the protostellar phase, and many have likely not even been asked. For example, the very nature of the hot corinos is still very much debated. Several authors question how much of the observed warm gas, with complex organic molecules, is due to the interaction of an outflow with the inner envelope (Chandler et al., 2005). Another possibility invoked is that this warm gas enriched with complex organic molecules resides in a disk-like atmosphere (Jørgensen et al., 2005a). The reality is indeed that very few observations have resolved hot corinos; actually, in just one source has this so far occurred (Kuan et al., 2004; Bottinelli et al., 2004b). Until more sensitive observations are available with SMA and ALMA, the question will remain open for debate. Another open question regards the chemistry leading to the observed molecular complexity in hot corinos. No clear observations are able so far to distinguish the roles of gas phase and grain surface chemistry in the formation of formic acid or methyl formate, just to mention two molecules frequently detected. The answer to this question will likely need not only more and more sensitive observations towards the hot corinos, but also laboratory experiments coupled with modeling in order to elucidate the role of the grains in the story. Last, but not least, we suspect that we are just viewing the tip of the iceberg: what is still hidden from our eyes? What is the ultimate molecular complexity reached during the hot corino phase? Do biotic molecules form? Do they play a role in the trigger and/or diffusion of life in the Universe (see the chapter by Gaidos & Selsis)?
Finally, many more questions exist regarding the fate of the molecules formed through the pre-stellar and protostellar phases. It is likely that some condense again onto the grain mantles during the phase of the proto-planetary disk, at least in the outer zones of the disk that are shielded by FUV photons (see the chapters by Bergin et al., Dutrey et al. and Dullemond et al.). The same grains are likely to coagulate into larger aggregates, which are the bricks from which the planets eventually form (see the chapters by Dominik et al. and Wadhwa et al.). How much of the mantle formed in the Prestellar Core phase is preserved? Do the molecules, and particularly the complex organic molecules formed during the hot corino phase, freeze-out onto the new mantles without other alterations? Or what kind of alterations do they undergo? How pristine is the material forming the comets, asteroids and planets?
To reconstruct the full story, we need many more pieces of the puzzle. One strong motivation for pursuing the story of protoplanetary disks is that their aftermath may have been part of the history of our own Solar System. The water of the oceans is an emblematic example. The ratio between HDO and H2O (known as SMOW) is (De Witt et al., 1980), fully ten times larger than the D/H elemental abundance of the Solar Nebula (Geiss, 1993). The origin of the oceans has been long debated and new theories keep coming. The deuterium enhancement is in line with the theory that much of the ocean water comes from the bombardment of the early Earth by comets (Owen and Bar-Nun, 1995), for comets show a similarly enhanced HDO/H2O ratio (Meier et al., 1998; Bockeleé-Morvan et al., 1998). Other possibilities include water brought by smaller bodies of the Solar System (meteorites and asteroids) (Raymond et al., 2004; Gomes et al., 2005). These bodies, as well as comets, have the imprint of the pre-collapse/protostellar phase in their ices (see the chapters by Jewitt et al., Wooden et al. and Alexander et al.). Regarding deuterium fractionation, the question remains as to what extent the enhanced HDO/H2O ratio is a legacy from the protostellar/proto-planetary phase and to what extent it has been modified by subsequent chemistry. And in addition to water, what other molecules were inherited by the early Earth and how did they arrive? As with other molecular indicators, how much of the terrestrial HDO/H2O ratio is a legacy depends on how it evolved during the various phases of the earth’s formation. So far, we have constraints on the evolution of deuterium fractionation from the pre-collapse, protostellar, and proto-planetary phases for only two molecules, HCO+ and H2O, and in the outer zones of the disk only, which may not necessarily be connected with cometary formation. The case of DCO+/HCO+, representing deuteration in the gas phase, seems to keep a rather constant value, around 10% (van Dishoeck et al., 2003). The HDO/H2O ratio, very likely a product of the grain mantles, seems to remain quite similar too, at a level of 1%, with just a relatively small decrease in the proto-planetary phase (Ceccarelli et al., 2005; Dominik et al., 2005). Evidently, this information alone is far too little to resolve the problem of the oceanic origin, but shows how important the study of chemistry in the prestellar and protostellar phases of star formation is and how much it will eventually aid our understanding of later phases up through the present eon. The coming decade will likely see many of these questions answered with the advent of the satellite Herschel and the sub-millimeter interferometer ALMA.
Acknowledgments. We wish to thank the referee for valuable comments on the manuscript. This study was supported in part by the European Community’s Human Potential Programme under contract MCRTN 512302, Molecular Universe, the French “Projet National PCMI”, the NASA Planetary Geology and Geophysics Program under grant NAG 5-10201.
References
- Aikawa et al. (2003) Aikawa Y., Ohashi N., and Herbst E. (2003) ApJ, 593, 906–924.
- Aikawa et al. (2005) Aikawa Y., Herbst E., Roberts H., and Caselli P. (2005) ApJ, 620, 330–346.
- Alves et al. (2001) Alves J. F., Lada C. J., and Lada E. A. (2001) Nature, 409, 159–161.
- André et al. (2000) André P., Ward-Thompson D., and Barsony M. (2000) Protostars and Planets IV (V. Mannings et al., eds.), pp. 59–63,Univ. of Arizona, Tucson.
- Bacmann et al. (2002) Bacmann A., Lefloch B., Ceccarelli C., Castets A., Steinacker J., and Loinard L. (2002) A&A, 389, L6–L10.
- Bacmann et al. (2003) Bacmann A., Lefloch B., Ceccarelli C., Steinacker J., Castets A., and Loinard L. (2003) ApJ, 585, L55–L58.
- Bergin et al. (2001) Bergin E. A., Ciardi D. R., Lada C. J., Alves J., and Lada E. A. (2001) ApJ, 557, 209–225.
- Bergin et al. (2002) Bergin E. A., Alves J., Huard T., and Lada C. J. (2002) ApJ, 570, L101–L104.
- Bianchi et al. (2003) Bianchi S., Gonçalves J., Albrecht M., Caselli P., Chini R., Galli D., and Walmsley M. (2003) A&A, 399, L43–L46.
- Biham et al. (2001) Biham O., Furman I., Pirronello V., and Vidali G. (2001) ApJ, 553, 595–603.
- Biham and Lipshtat (2002) Biham O. and Lipshtat A. (2002) Phys. Rev. E, 66, 100–112.
- Bockeleé-Morvan et al. (1998) Bockeleé-Morvan D., Gautier D., Lis D. C. et al. (1998) Icarus, 133, 147–162.
- Boogert et al. (2002) Boogert A. C. A., Hogerheijde M. R., Ceccarelli C. et al. (2002) ApJ, 570, 708–723.
- Bottinelli et al. (2004a) Bottinelli S., Ceccarelli C., Lefloch B. et al.. (2004a) ApJ, 615, 354–358.
- Bottinelli et al. (2004b) Bottinelli S., Ceccarelli C., Neri R., Williams J. P., Caux E., Cazaux S., Lefloch B., Maret S., and Tielens A. G. G. M. (2004b) ApJ, 617, L69–L72.
- Bottinelli et al. (2006b) Bottinelli S., Ceccarelli C., Williams J. P., and Lefloch B. (2006b) ApJ, submitted.
- Bringa and Johnson (2004) Bringa E. M. and Johnson R. E. (2004) ApJ, 603, 159–164.
- Brown and Millar (1989) Brown P. D. and Millar T. J. (1989) MNRAS, 237, 661–671.
- Burke and Hollenbach (1983) Burke J. R. and Hollenbach D. J. (1983) ApJ, 265, 223–234.
- Caselli (2006) Caselli P. (2006) ArXiv Astrophysics e-prints.
- Caselli et al. (1993) Caselli P., Hasegawa T. I., and Herbst E. (1993) ApJ, 408, 548–558.
- Caselli et al. (1999) Caselli P., Walmsley C. M., Tafalla M., Dore L., and Myers P. C. (1999) ApJ, 523, L165–L169.
- Caselli et al. (2002a) Caselli P., Stantcheva T., Shalabiea O., Shematovich V. I., and Herbst E. (2002a) Planet. Space Sci., 50, 1257–1266.
- Caselli et al. (2002b) Caselli P., Walmsley C. M., Zucconi A., Tafalla M., Dore L., and Myers P. C. (2002b) ApJ, 565, 331–343.
- Caselli et al. (2002c) Caselli P., Walmsley C. M., Zucconi A., Tafalla M., Dore L., and Myers P. C. (2002c) ApJ, 565, 344–358.
- Caselli et al. (2003) Caselli P., van der Tak F. F. S., Ceccarelli C., and Bacmann A. (2003) A&A, 403, L37–L41.
- Cazaux et al. (2003) Cazaux S., Tielens A. G. G. M., Ceccarelli C., Castets A., Wakelam V., Caux E., Parise B., and Teyssier D. (2003) ApJ, 593, L51–L55.
- Cazaux and Tielens (2004) Cazaux S. and Tielens A. G. G. M. (2004) ApJ, 604, 222–237.
- Ceccarelli (2004a) Ceccarelli C. (2004a) in The Dense Interstellar Medium in Galaxies (S.Pfalzner et al., eds.), pp. 473–481
- Ceccarelli (2004b) Ceccarelli C. (2004b) in Astronomical Society of the Pacific Conference Series, pp. 195–207.
- Ceccarelli et al. (1996) Ceccarelli C., Hollenbach D. J., and Tielens A. G. G. M. (1996) ApJ, 471, 400–432.
- Ceccarelli et al. (1998) Ceccarelli C., Castets A., Loinard L., Caux E., and Tielens A. G. G. M. (1998) A&A, 338, L43–L46.
- Ceccarelli et al. (1999) Ceccarelli C., Caux E., Loinard L. et al. (1999) A&A, 342, L21–L24.
- Ceccarelli et al. (2000a) Ceccarelli C., Castets A., Caux E., Hollenbach D., Loinard L., Molinari S., and Tielens A. G. G. M. (2000a) A&A, 355, 1129–1137.
- Ceccarelli et al. (2000b) Ceccarelli C., Loinard L., Castets A., Tielens A. G. G. M., and Caux E. (2000b) A&A, 357, L9–L12.
- Ceccarelli et al. (2001) Ceccarelli C., Loinard L., Castets A., Tielens A. G. G. M., Caux E., Lefloch B., and Vastel C. (2001) A&A, 372, 998–1004.
- Ceccarelli et al. (2003) Ceccarelli C., Maret S., Tielens A. G. G. M., Castets A., and Caux E. (2003) A&A, 410, 587–595.
- Ceccarelli and Dominik (2005) Ceccarelli C. and Dominik C. (2005) A&A, 440, 583–593.
- Ceccarelli et al. (2005) Ceccarelli C., Dominik C., Caux E., Lefloch B., and Caselli P. (2005) ApJ, 631, L81–L84.
- Chandler et al. (2005) Chandler C. J., Brogan C. L., Shirley Y. L., and Loinard L. (2005) ApJ, 632, 371–396.
- Chang et al. (2005) Chang Q., Cuppen H. M., and Herbst E. (2005) A&A, 434, 599–611.
- Charnley et al. (1992) Charnley S. B., Tielens A. G. G. M., and Millar T. J. (1992) ApJ, 399, L71–L74.
- Charnley et al. (1997) Charnley S. B., Tielens A. G. G. M., and Rodgers S. D. (1997) ApJ, 482, L203–L207.
- Charnley (2001) Charnley S. B. (2001) ApJ, 562, L99–L102.
- Crapsi et al. (2004) Crapsi A., Caselli P., Walmsley C. M., Tafalla M., Lee C. W., Bourke T. L., and Myers P. C. (2004) A&A, 420, 957–974.
- Crapsi et al. (2005a) Crapsi A., Caselli P., Walmsley C. M., Myers P. C., Tafalla M., Lee C. W., and Bourke T. L. (2005a) ApJ, 619, 379–406.
- Crapsi et al. (2005b) Crapsi A., Devries C. H., Huard T. L. et al. (2005b) A&A, 439, 1023–1032.
- Cuppen and Herbst (2005) Cuppen H. M. and Herbst E. (2005) MNRAS, 361, 565–576.
- Dartois et al. (2003) Dartois E., Thi W.-F., Geballe T. R., Deboffle D., d’Hendecourt L., and van Dishoeck E. (2003) A&A, 399, 1009–1020.
- De Witt et al. (1980) De Witt J., van der Straaten C., and Mook W. (1980) Geostand. Newsl., 4, 33–36.
- D’Hendecourt et al. (1982) D’Hendecourt L. B., Allamandola L. J., Baas F., and Greenberg J. M. (1982) A&A, 109, L12–L14.
- D’Hendecourt et al. (1986) D’Hendecourt L. B., Allamandola L. J., Grim R. J. A., and Greenberg J. M. (1986) A&A, 158, 119–134.
- Di Francesco et al. (2001) Di Francesco J., Myers P. C., Wilner D. J., Ohashi N., and Mardones D. (2001) ApJ, 562, 770–789.
- Dominik et al. (2005) Dominik C., Ceccarelli C., Hollenbach D., and Kaufman M. (2005) ApJ, 635, L85–L88.
- Evans et al. (2001) Evans N. J., Rawlings J. M. C., Shirley Y. L., and Mundy L. G. (2001) ApJ, 557, 193–208.
- Evans et al. (2005) Evans N. J., Lee J.-E., Rawlings J. M. C., and Choi M. (2005) ApJ, 626, 919–932.
- Flower et al. (2005) Flower D. R., Pineau Des Forêts G., and Walmsley C. M. (2005) A&A, 436, 933–943.
- Flower et al. (2006) Flower D. R., Pineau des Forets G., and Walmsley C. M. (2006) ArXiv Astrophysics e-prints.
- Frerking et al. (1982) Frerking M. A., Langer W. D., and Wilson R. W. (1982) ApJ, 262, 590–605.
- Galli et al. (2002) Galli D., Walmsley M., and Gonçalves J. (2002) A&A, 394, 275–284.
- Geiss (1993) Geiss J. (1993) in Origin and Evolution of Elements (N. Pranzos, E. Vangioni-Flam, and M. Casse, eds.), pp. 89–106, Cambridge Univ. press, Cambridge.
- Geppert et al. (2004) Geppert W. D., Ehlerding A., Hellberg F. et al. (2004) ApJ, 613, 1302–1309.
- Giannini et al. (2001) Giannini T., Nisini B., and Lorenzetti D. (2001) ApJ, 555, 40–57.
- Gibb et al. (2000) Gibb E. L., Whittet D. C. B., Schutte W. A. et al. (2000) ApJ, 536, 347–356.
- Gomes et al. (2005) Gomes R., Levison H. F., Tsiganis K., and Morbidelli A. (2005) Nature, 435, 466–469.
- Green et al. (2001) Green N. J. B., Toniazzo T., Pilling M. J., Ruffle D. P., Bell N., and Hartquist T. W. (2001) A&A, 375, 1111–1119.
- Guélin et al. (1977) Guélin M., Langer W. D., Snell R. L., and Wootten H. A. (1977) ApJ, 217, L165–L168.
- Hasegawa et al. (1992) Hasegawa T. I., Herbst E., and Leung C. M. (1992) ApJS, 82, 167–195.
- Hasegawa and Herbst (1993) Hasegawa T. I. and Herbst E. (1993) MNRAS, 261, 83–102.
- Herbst (2005) Herbst E. (2005) in The Dusty and Molecular Universe: A Prelude to Herschel and ALMA (A. Wilson, ed.), pp. 205–210, ESA SP-577, Noordwijk, Netherlands.
- Hidaka et al. (2004) Hidaka H., Watanabe N., Shiraki T., Nagaoka A., and Kouchi A. (2004) ApJ, 614, 1124–1131.
- Hirota et al. (2001) Hirota T., Ikeda M., and Yamamoto S. (2001) ApJ, 547, 814–828.
- Horn et al. (2004) Horn A., Møllendal H., Sekiguchi O. et al. (2004) ApJ, 611, 605–614.
- Johnson et al. (1991) Johnson R. E., Donn B., Pirronello V., and Sundqvist B. (1991) ApJ, 379, L75–L77.
- Jørgensen et al. (2002) Jørgensen J. K., Schöier F. L., and van Dishoeck E. F. (2002) A&A, 389, 908–930.
- Jørgensen et al. (2004) Jørgensen J. K., Schöier F. L., and van Dishoeck E. F. (2004) A&A, 416, 603–622.
- Jørgensen et al. (2005a) Jørgensen J. K., Bourke T. L., Myers P. C., Schöier F. L., van Dishoeck E. F., and Wilner D. J. (2005a) ApJ, 632, 973–981.
- Jørgensen et al. (2005b) Jørgensen J. K., Lahuis F., Schöier F. L., et al. (2005b) ApJ, 631, L77–L80.
- Jørgensen et al. (2005c) Jørgensen J. K., Schöier F. L., and van Dishoeck E. F. (2005c) A&A, 437, 501–515.
- Jørgensen et al. (2005d) Jørgensen J. K., Schöier F. L., and van Dishoeck E. F. (2005d) A&A, 435, 177–182.
- Kuan et al. (2004) Kuan Y.-J., Huang H.-C., Charnley S. B. et al. (2004) ApJ, 616, L27–L30.
- Kurtz et al. (2000) Kurtz S., Cesaroni R., Churchwell E., Hofner P., and Walmsley C. M. (2000) Protostars and Planets IV (V. Mannings et al., eds.) , pp. 299–315.Univ. of Arizona, Tucson.
- Langer et al. (2000) Langer W. D., van Dishoeck E. F., Bergin E. A., Blake G. A., Tielens A. G. G. M., Velusamy T., and Whittet D. C. B. (2000) Protostars and Planets IV (V. Mannings et al., eds.), pp. 29–43.Univ. of Arizona, Tucson.
- Leger (1983) Leger A. (1983) A&A, 123, 271–278.
- Leger et al. (1985) Leger A., Jura M., and Omont A. (1985) A&A, 144, 147–160.
- Linsky (2003) Linsky J. L. (2003) Space Science Reviews, 106, 49–60.
- Lipshtat and Biham (2004) Lipshtat A. and Biham O. (2004) Physical Review Letters, 93, 1706–1710.
- Lis et al. (2002) Lis D. C., Roueff E., Gerin M., Phillips T. G., Coudert L. H., van der Tak F. F. S., and Schilke P. (2002) ApJ, 571, L55–L58.
- Lis et al. (2006) Lis D. C., Gerin M., Roueff E., Vastel C., and Phillips T. G. (2006) ApJ, 636, 916–922.
- Liszt (2003) Liszt H. (2003) A&A, 398, 621–630.
- Loinard et al. (2000) Loinard L., Castets A., Ceccarelli C., Tielens A. G. G. M., Faure A., Caux E., and Duvert G. (2000) A&A, 359, 1169–1174.
- Loinard et al. (2001) Loinard L., Castets A., Ceccarelli C., Caux E., and Tielens A. G. G. M. (2001) ApJ, 552, L163–L166.
- Loinard et al. (2002) Loinard L., Castets A., Ceccarelli C. et al. (2002) Planet. Space Sci., 50, 1205–1213.
- Looney et al. (2003) Looney L. W., Mundy L. G., and Welch W. J. (2003) ApJ, 592, 255–265.
- Loren et al. (1990) Loren R. B., Wootten A., and Wilking B. A. (1990) ApJ, 365, 269–286.
- Mangum and Wootten (1993) Mangum J. G. and Wootten A. (1993) ApJS, 89, 123–153.
- Marcelino et al. (2005) Marcelino N., Cernicharo J., Roueff E., Gerin M., and Mauersberger R. (2005) ApJ, 620, 308–320.
- Maret et al. (2002a) Maret S., Caux E., and Ceccarelli C. (2002a) Ap&SS, 281, 139–140.
- Maret et al. (2002b) Maret S., Ceccarelli C., Caux E., Tielens A. G. G. M., and Castets A. (2002b) A&A, 395, 573–585.
- Maret et al. (2004) Maret S., Ceccarelli C., Caux E. et al. (2004) A&A, 416, 577–594.
- Maret et al. (2005) Maret S., Ceccarelli C., Tielens A. G. G. M. et al. (2005) A&A, 442, 527–538.
- Meier et al. (1998) Meier R., Owen T. C., Matthews H. E. et al. (1998) Science, 279, 842–846.
- Millar (2005) Millar T. J. (2005) Astronomy and Geophysics, 46, 29–32.
- Millar et al. (1989) Millar T. J., Bennett A., and Herbst E. (1989) ApJ, 340, 906–920.
- Millar et al. (1991) Millar T. J., Herbst E., and Charnley S. B. (1991) ApJ, 369, 147–156.
- Nagaoka et al. (2005) Nagaoka A., Watanabe N., and Kouchi A. (2005) ApJ, 624, L29–L32.
- Nisini et al. (2002) Nisini B., Giannini T., and Lorenzetti D. (2002) ApJ, 574, 246–257.
- Nomura and Millar (2004) Nomura H. and Millar T. J. (2004) A&A, 414, 409–423.
- Osamura et al. (2004) Osamura Y., Roberts H., and Herbst E. (2004) A&A, 421, 1101–1111.
- Ossenkopf (1993) Ossenkopf V. (1993) A&A, 280, 617–646.
- Owen and Bar-Nun (1995) Owen T. and Bar-Nun A. (1995) Icarus, 116, 215–226.
- Pagani et al. (1992) Pagani L., Wannier P. G., Frerking M. A. et al. (1992) A&A, 258, 472–478.
- Pagani et al. (2003) Pagani L., Lagache G., Bacmann A. et al. (2003) A&A, 406, L59–L62.
- Pagani et al. (2004) Pagani L., Bacmann A., Motte F. et al. (2004) A&A, 417, 605–613.
- Pagani et al. (2005) Pagani L., Pardo J.-R., Apponi A. J., Bacmann A., and Cabrit S. (2005) A&A, 429, 181–192.
- Parise et al. (2002) Parise B., Ceccarelli C., Tielens A. G. G. M., Herbst E., Lefloch B., Caux E., Castets A., Mukhopadhyay I., Pagani L., and Loinard L. (2002) A&A, 393, L49–L53.
- Parise et al. (2003) Parise B., Simon T., , Caux E., Dartois E., Ceccarelli C., Rayner J., and Tielens A. G. G. M. (2003) A&A, 410, 897–904.
- Parise et al. (2004) Parise B., Castets A., Herbst E., Caux E., Ceccarelli C., Mukhopadhyay I., and Tielens A. G. G. M. (2004) A&A, 416, 159–163.
- Parise et al. (2005a) Parise B., Caux E., Castets A. et al. (2005a) A&A, 431, 547–554.
- Parise et al. (2005b) Parise B., Ceccarelli C., and Maret S. (2005b) A&A, 441, 171–179.
- Parise et al. (2006) Parise B., Ceccarelli C., Tielens A. et al. (2006) A&A, in press.
- Pickles and Williams (1977) Pickles J. B. and Williams D. A. (1977) Ap&SS, 52, 443–452.
- Raymond et al. (2004) Raymond S. N., Quinn T., and Lunine J. I. (2004) Icarus, 168, 1–17.
- Redman et al. (2002) Redman M. P., Rawlings J. M. C., Nutter D. J., Ward-Thompson D., and Williams D. A. (2002) MNRAS, 337, L17–L21.
- Roberts et al. (2002) Roberts H., Fuller G. A., Millar T. J., Hatchell J., and Buckle J. V. (2002) Planet. Space Sci., 50, 1173–1178.
- Roberts et al. (2003) Roberts H., Herbst E., and Millar T. J. (2003) ApJ, 591, L41–L44.
- Roberts et al. (2004) Roberts H., Herbst E., and Millar T. J. (2004) A&A, 424, 905–917.
- Rodgers and Charnley (2003) Rodgers S. D. and Charnley S. B. (2003) ApJ, 585, 355–371.
- Roueff and Gerin (2003) Roueff E. and Gerin M. (2003) Space Science Reviews, 106, 61–72.
- Roueff et al. (2000) Roueff E., Tiné S., Coudert L. H., Pineau des Forêts G., Falgarone E., and Gerin M. (2000) A&A, 354, L63–L66.
- Roueff et al. (2005) Roueff E., Lis D. C., van der Tak F. F. S., Gerin M., and Goldsmith P. F. (2005) A&A, 438, 585–598.
- Ruffle and Herbst (2000) Ruffle D. P. and Herbst E. (2000) MNRAS, 319, 837–850.
- Sandell and Knee (2001) Sandell G. and Knee L. B. G. (2001) ApJ, 546, L49–L52.
- Schöier et al. (2002) Schöier F. L., Jørgensen J. K., van Dishoeck E. F., and Blake G. A. (2002) A&A, 390, 1001–1021.
- Schöier et al. (2004) Schöier F. L., Jørgensen J. K., van Dishoeck E. F., and Blake G. A. (2004) A&A, 418, 185–202.
- Schutte et al. (1999) Schutte W. A., Boogert A. C. A., Tielens A. G. G. M., et al. (1999) A&A, 343, 966–976.
- Shah and Wootten (2001) Shah R. Y. and Wootten A. (2001) ApJ, 554, 933–947.
- Shen et al. (2004) Shen C. J., Greenberg J. M., Schutte W. A., and van Dishoeck E. F. (2004) A&A, 415, 203–215.
- Shirley et al. (2002) Shirley Y. L., Evans N. J., and Rawlings J. M. C. (2002) ApJ, 575, 337–353.
- Shu (1977) Shu F. H. (1977) ApJ, 214, 488–497.
- Stantcheva and Herbst (2003) Stantcheva T. and Herbst E. (2003) MNRAS, 340, 983–988.
- Stantcheva and Herbst (2004) Stantcheva T. and Herbst E. (2004) A&A, 423, 241–251.
- Stark et al. (1999) Stark R., van der Tak F. F. S., and van Dishoeck E. F. (1999) ApJ, 521, L67–L70.
- Tafalla et al. (1998) Tafalla M., Mardones D., Myers P. C., Caselli P., Bachiller R., and Benson P. J. (1998) ApJ, 504, 900–908.
- Tafalla et al. (2002) Tafalla M., Myers P. C., Caselli P., Walmsley C. M., and Comito C. (2002) ApJ, 569, 815–835.
- Tafalla et al. (2004) Tafalla M., Myers P. C., Caselli P., and Walmsley C. M. (2004) A&A, 416, 191–212.
- Tafalla and Santiago (2004) Tafalla M. and Santiago J. (2004) A&A, 414, L53–L56.
- Tielens (1983) Tielens A. G. G. M. (1983) A&A, 119, 177–184.
- Tielens (2005) Tielens A. G. G. M. (2005) The Physics and Chemistry of the Interstellar Medium, Cambridge University Press.
- Tielens and Hagen (1982) Tielens A. G. G. M. and Hagen W. (1982) A&A, 114, 245–260.
- Tiné et al. (2000) Tiné S., Roueff E., Falgarone E., Gerin M., and Pineau des Forêts G. (2000) A&A, 356, 1039–1049.
- Turner (1990) Turner B. E. (1990) ApJ, 362, L29–L33.
- van der Tak et al. (2002) van der Tak F. F. S., Schilke P., Müller H. S. P., Lis D. C., Phillips T. G., Gerin M., and Roueff E. (2002) A&A, 388, L53–L56.
- van der Tak et al. (2005) van der Tak F. F. S., Caselli P., and Ceccarelli C. (2005) A&A, 439, 195–203.
- van Dishoeck et al. (1992) van Dishoeck E. F., Phillips T. G., Keene J., and Blake G. A. (1992) A&A, 261, L13–L16.
- van Dishoeck et al. (1995) van Dishoeck E. F., Blake G. A., Jansen D. J., and Groesbeck T. D. (1995) ApJ, 447, 760–774.
- van Dishoeck and Blake (1998) van Dishoeck E. F. and Blake G. A. (1998) ARA&A, 36, 317–368.
- van Dishoeck et al. (2003) van Dishoeck E. F., Thi W.-F., and van Zadelhoff G.-J. (2003) A&A, 400, L1–L4.
- Vastel et al. (2003) Vastel C., Phillips T. G., Ceccarelli C., and Pearson J. (2003) ApJ, 593, L97–L100.
- Vastel et al. (2004) Vastel C., Phillips T. G., and Yoshida H. (2004) ApJ, 606, L127–L130.
- Vastel et al. (2006) Vastel C., Caselli P., Ceccarelli C. et al. (2006) A&A, submitted.
- Viti et al. (2004) Viti S., Collings M. P., Dever J. W., McCoustra M. R. S., and Williams D. A. (2004) MNRAS, 354, 1141–1145.
- Wakelam et al. (2004) Wakelam V., Caselli P., Ceccarelli C., Herbst E., and Castets A. (2004) A&A, 422, 159–169.
- Wakelam et al. (2005) Wakelam V., Ceccarelli C., Castets A. et al. (2005) A&A, 437, 149–158.
- Walmsley et al. (2004) Walmsley C. M., Flower D. R., and Pineau des Forêts G. (2004) A&A, 418, 1035–1043.
- Watanabe et al. (2003) Watanabe N., Shiraki T., and Kouchi A. (2003) ApJ, 588, L121–L124.
- Watson et al. (1978) Watson W. D., Snyder L. E., and Hollis J. M. (1978) ApJ, 222, L145–L147.
- Williams et al. (2005) Williams S. J., Fuller G. A., and Sridharan T. K. (2005) A&A, 434, 257–274.
- Wootten (1989) Wootten A. (1989) ApJ, 337, 858–866.
- Young and Evans (2005) Young C. H. and Evans N. J. (2005) ApJ, 627, 293–309.
- Young et al. (2004) Young K. E., Lee J.-E., Evans N. J., Goldsmith P. F., and Doty S. D. (2004) ApJ, 614, 252–266.
- Zucconi et al. (2001) Zucconi A., Walmsley C. M., and Galli D. (2001) A&A, 376, 650–662.