Outflow Driven Cavities: Numerical Simulations of Intermediaries of Protostellar Turbulence
Abstract
We investigate the evolution of fossil cavities produced by extinct YSO jets and wide angle outflows. Fossil cavities are ellipsoidal or cylindrical shells of swept-up of ambient (molecular cloud) material moving at low velocities. The cavities form when the momentum in a YSO jet or wide angle outflow decays in time allowing the bowshock or swept-up shell to decelerate to velocities near the turbulent speed in the cloud. It has been suggested in previous studies that cavities provide efficient coupling between the jets/outflows and the cloud and, as such, are the agents by which cloud turbulence is can be re-energized. In this paper we carry forward a series of numerical simulations of jets and outflows whose momentum flux decrease in time. We compare simulations with decaying momentum fluxes to those with constant flux. We show that decaying flux models exhibit deceleration of the outflow head and backfilling via expansion off of the cavity walls. They also have lower density contrast, are longer lived and wider than their continuously driven counterparts. The simulations recover the basic properties of observed fossil cavities. In addition, we provide synthetic observations in terms of P-V diagrams which demonstrate that fossil cavities form both jets and wide angle outflows are characterized by linear “Hubble-law” expansions patterns superimposed on “spur” patterns indicative of the head of a bow shock.
1 Introduction
Energetic outflows from young stellar objects exert a strong effect on their parent molecular clouds. Consideration of the combined energy budget for many outflows in dense star forming regions compared with the energy of the parent molecular cloud’s turbulent motions support notions of feedback by showing an approximate balance between outflow energy input and turbulent support (Bally, 1996; Bally & Reipurth, 2001; Knee & Sandell, 2000; Matzner, 2002; Warin et al., 1996). Outflow momentum must be subsumed and isotropized into the cloud if young stellar object outflows are to drive turbulence in molecular clouds. The explicit mechanisms by which this occurs has yet to be demonstrated.
Quillen et al. (2005) have recently explored the relation between turbulent cloud motions and observed outflow activity in NGC 1333. Their results showed that the location of active outflows did not affect the degree of turbulence in the cloud. In addition recent numerical studies (Cunningham et al., 2005) have shown that direct collisions of active outflows are not effective at transferring jet/outflow momentum to cloud material (by active we mean that the momentum flux of the outflow remains roughly constant through out the interaction). While active outflows did not seem to energize turbulent motions Quillen et al. (2005) were able to identify many sub-parsec size slowly expanding cavities in 13CO observations of NGC 1333 which they identified as dense wind-swept shells of gas that expand into the cloud after the driving source of the outflow has expired. They found that the mechanical energy required to open these cavities represents a significant fraction of that required to drive the cloud turbulence. The authors argued that these cavities were relics of previously active molecular outflows. Because cavities have a longer lifetime than those opened by active and younger outflows, they would be more numerous than higher velocity, younger outflows. These cavities could provide the coupling between outflows and turbulence in molecular clouds. Thus one means of re-energizing turbulence in clouds may be through these “fossil outflow” cavities which are disrupted after they have slowed to speeds comparable to the turbulent velocity of the ambient cloud.
Our simulations focus on outflows whose energy and momentum flux decreases with time. Such behavior is expected from observations which show an exponential decrease in outflow momentum flux with age of central source (Bontemps et al., 1996). We note that most simulations of molecular outflows have focused on continuous momentum injection models (e.g., Suttner et al. 1997; Smith et al. 1997; Micono et al. 2000; Lee et al. 2001; Rosen & Smith 2003; Downes & Cabrit 2003; Raga et al. 2004; Keegan & Downes 2005). As an object ages, the bowshock driven by a previously active outflow continues to expand into the molecular cloud evolving into what Quillen et al. (2005) refer to this as a “fossil cavity”. Theoretical models for expanding spherical cavities i.e. wind blown bubbles, have been applied to cavities opened by outflows in a few cases. Koo & McKee (1992a) applied their wind blown bubble model to the HH 7-11 region, located in the NGC 1333 cloud. In the context of a slow wind, Koo & McKee (1992a) suggested that cavities opened in molecular clouds by outflows were consistent with their estimated mechanical luminosities.
The observational properties of molecular outflows driven by jets and winds have been modeled by many authors. But, as noted above, the emphasis has most often been on active outflows. For example, Raga et al. (2004) recently modeled the limb-brightened cavity associated with HH 46/47 (Noriega-Crespo et al., 2004) as a bow shock driven by a perfectly collimated active jet. Kinematic patterns of the swept-up material is often of particular interest in these studies as these are readily observable and can distinguish between models outflow formation. Linear increases of velocity with distance, so-called Hubble Law patterns, have been identified in some but not all theoretical studies. The bow shock model of Zhang & Zheng (1997) and the numerical simulations of Smith et al. (1997); Downes & Ray (1999); Poludnenko et al. (2004) in which outflows are created by the entrainment of ambient gas by a single bow shock all reproduce the Hubble velocity law. In these models, the Hubble velocity law is partly due to the geometry of the bow shock. An explanation is that the highest forward velocities are found in the apex of the bow shock, which is also the point farther away from the source. The forward velocities decrease toward the wings of the bow shock, and the farthest away from the apex (or closer to the outflow source), the slower will be the entrained gas (see figure 3 of Masson & Chernin 1993, figure 12 of Lada & Fich 1996 & figure 4 of Welch et al. 2000). In other models, however, Hubble laws do not appear as a consequence of either analytical or numerical simulations. In the studies of Ostriker et al. (2001); Lee et al. (2001) jets produce a characteristic “spur” pattern in the swept-up gas. It seems that some combination of entrainment or unstable boundaries may be needed to create Hubble laws in active outflows.
In this paper we carry out a numerical exploration of cavities that are opened in molecular clouds by both jets and wide angle winds (WAW). We compare the morphology and velocity structure of cavities caused by continuously injected momentum with those of extinct outflows. Our first goal is to recover observable properties of cavities. This is the first step in verifying the conjecture that fossil cavities represent the means of transferring outflow energy and momentum into cloud turbulence. By confirming that we can recover the morphology and kinematics of observed fossil shells we can then, in future works, explore cavity-cavity collisions and the energizing of turbulent motions. We also use our simulations to identify physical differences between continually driven and extinct outflow driven structures and their impact on observables such as PV diagrams. In section II we present our method and model for the jet/WAW source. In section III we present our results. Section IV we present a discussion of the results in light of outstanding issues in molecular outflows and issues of protostellar turbulence.
2 Computational Method and Initial Conditions
2.1 Method: Numerical Code
The simulations presented here have been carried out in 2D cylindrical axial symmetry (2.5D) using the AstroBEAR adaptive mesh refinement (AMR) code. AMR allows high resolution to be achieved only in those regions which require it due to the presence of steep gradients in critical quantities such as gas density. The hydrodynamic version of AstroBEAR has been well tested on variety of problems in 1, 2, 2.5D (Poludnenko et al., 2005; Varnie et al., 2005; Cunningham et al., 2005) and 3D (Lebedev et al., 2004).
For the results presented here, AstroBEAR was used to evolve Euler’s equations including the effects of time dependent radiative cooling chemistry, and ionization. The implementation of radiative cooling, chemistry and ionization employed are discussed in detail in Cunningham et al. (2005). A spatial and temporal second order accurate MUSCL scheme using a Roe-average linearized Riemann solver was used to integrate the source-free Euler equations. The MUSCL scheme employed achieves second order spatial accuracy by performing a MINMOD interpolation of the primitive fields (density, velocity and pressure) to grid interfaces. The TVD-preserving time stepping method of Shu & Osher (1988) is used to advance the solution. The micro-physical source terms are handled separately from the hydrodynamic integration using an operator split approach. The source term is integrated using an implicit fourth-order Rosenbrock integration scheme for stiff ODE’s. We have made use of the Local Oscillation Filter method of Sutherland et al. (2003) using a viscosity parameter to eliminate numerical instabilities that can occur near strongly radiative shock fronts.
2.2 Model: Fossil Cavity Simulations
We have performed simulations for the case where the outflow source expires and creates a fossil cavity and also for the case of a continuously driven source. The simulations were carried forward for two outflow sources; the case of a collimated jet and the case of a wide angle wind that was injected into the domain along the surface of a sphere where the density of the driving source varies with polar angle as . For numerical palatability, we have constructed this function to have a limiting value of near the pole. This model has been shown to be a good approximation of X-winds Shu et al. (1995). Furthermore, Matzner & McKee (1999) have argued that this model is characteristic of any radial hydromagnetic wind at distances far from the driving source. Hydrodynamic winds of this form, we have found, produce relatively collimated outflows in both uniform and toroidal density environments. The parameters common to each of the four simulations prescribed here are presented in table 1. For the cases where the driving source expires, the density of the wind is decreased as:
and the velocity of the driving wind is reduced to zero as:
The jet outflow conditions were imposed from within the boundary zones inside of a disk of radius , centered on the origin. Similarly, the wide angle outflow was imposed within a sphere of radius centered at the origin. Reflection boundary conditions were used outside of the outflow source along and and extrapolation boundary conditions were imposed elsewhere.
| Domain Size, , | (jet) |
|---|---|
| (WAW) | |
| Jet Radius, | |
| Computational cells per | |
| Resolution | |
| Outflow Rate, | |
| Outflow Velocity, | |
| Outflow Temperature | |
| Outflow Gas Composition | 75% , 25% by mass |
| Ambient Density | |
| Ambient Temperature | |
| Ambient Gas Composition | 75% , 25% by mass |
| Decaying Wind Shut-off Time, | (jet) & (wide angle wind) |
| Decaying Wind Shut-off Decay Time, | (jet) & (wide angle wind) |
Observations by Bontemps et al. (1996) reveal that the momentum flux supplied to protostellar outflows decreases by two orders of magnitude as the progenitor evolves from and embedded class 0 source to an evolved class I source in a manner that is in rough proportion to the circumstellar envelope mass. Our model for the time dependence of the outflow source is consistent with this observed decrease. The fossil outflow cavity models presented here reduce the density of the driving wind to of its initial value at while maintaining the wind velocity near the escape speed. The driving wind is shut off () for to model the effect of a completely extinct outflow source. While the driving winds in our cavity models cease approximately earlier than the typical age of class I sources, the total momentum flux injected in our fossil cavity modes is characteristic of the net momentum flux inferred from observation of low mass sources (Knee & Sandell, 2000). The combination of detailed microphysics and long simulation time make the simulations computationally demanding. We acknowledge that the radius of the outflow source used in our numerical models of is that of typical collimated outflows. The outflows driven here are therefore very light compared to more collimated models with comparable mass loss rates. We chose to accept this trade-off in order to enable the simulation of large scale outflow cavities over long timescales while resolving the embedded outflow source. Note also that we use only a hydrodynamic version of the code as the magnetic field strengths inferred in jets at these size scales are unlikely to alter the dynamics of the global flow patterns (Crutcher et al., 2004).
3 Results
3.1 Outflow & Cavity Morphology
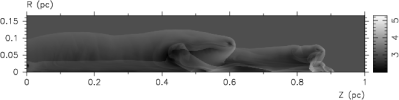
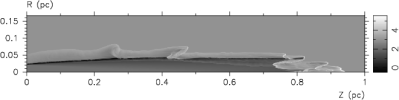
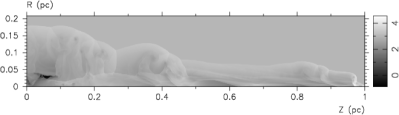
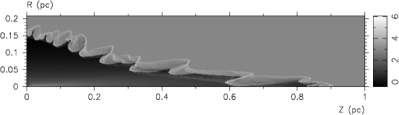
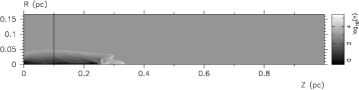
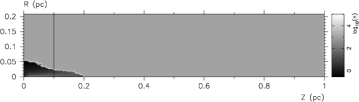
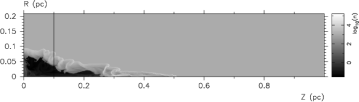
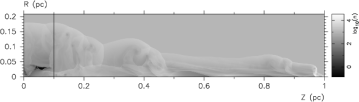
We now present the results of the simulation suite. Figure 1 (top) shows the cylindrically symmetric simulation of a old fossil outflow cavity that has been opened by a collimated jet. The density of the driving source was decreased until the driving source was turned off at . For comparison the simulation where the inflow rate and velocity remain continuous is shown in figure 1 (bottom). Figure 2 shows the wide-angle simulation set with a decaying wind (top) and continuous outflow (bottom). In the wide angle wind case, the driving source was turned of at . As noted earlier, the prescription for the wide angle wind used here produces a relatively collimated outflow structure owing to the divergence in wind density at the poles. The irregular bow shock shape of the jet driven models is due to vortex shedding from the condensed gas at the head of the jet. We note that the condensed layer of strongly cooling wind-swept gas at the head of the jet and along the entire circumference of the wide angle wind continuously driven cases (figures 1 & 2, bottom) are subject to non-linear bending mode instabilities (Vishniac, 1994). We have performed these simulations at lower resolution to assess the convergence of these results. The lower resolution results also feature unstable thin shells and vortex shedding but the details of the small scale features associated with these phenomena are not converged. However, the overall shape and dynamics of the flows that are pertinent to the results presented in this paper are unchanged at lower resolution.
The fossil cavities opened after the driving jet or wind expires have similar spatial extents, and age, . The continuously driven outflows are shown at times of comparable spatial extent to their fossil counterparts () but are considerably younger at the age. The difference is attributable to the rapid deceleration of the leading edge of the fossil outflows after the driving source has expired.
The morphological signatures in terms of aspect ratio of fossil outflow cavities differ from their continuously driven counterparts. The propagation of the head of the outflow quickly decelerated to in less than after the driving source expired (figures 3 & 4, left). We define the outflow aspect ratio as the ratio of the outflow length to the width of the outflow at its half-length. The outflow aspect ratio is plotted as a function of time for the jet and wide angle wind cases in figures 3 & 4, right, respectively. Fossil outflow cavities evolve to be wider, relative to their length than their continuously driven counterparts. After the driving source expires, the rate of increase of the aspect ratio diminishes as the head of the outflow decelerates more rapidly than the lateral edges. This can be seen in figure 4 (top) for the jet driven cavity. The rapid deceleration of the outflow after the driving source has turned off at is apparent in the plot of outflow length shown in figure 3, top left. The length to width ratio plateaus to as the head of the cavity continues to decelerate. For the continuously driven jet case (figure 3, bottom) the propagation of the head of the outflow continues at a roughly constant rate. The length to width radio plateaus to at late time due to an event of vortex shedding at the head of the outflow. If the simulation were to continue, we expect that the the length to width ratio would resume the constant rate of increase as present at earlier times, before .
The propagation of the head of the wide angle wind driven outflow (figure 4) also undergoes rapid deceleration after the driving wind has been turned off at . The length to width ratio of the outflow cavity plateaus to after the driving source has expired. In this case the length to width ratio to undergo a brief periods of reduction after owing to the irregularly shape of the bow shock. This decrease is due to the geometry of the wide angle wind driven cavity. After the driving source expires the outflow cavity, initially wider at the base than at the head, expands to a more cylindrical geometry as the highly supersonic head of the cavity decelerates more rapidly than the radial wall.


3.2 Fossil Cavity Backfilling
The interior walls of an outflow cavity are supported, in the case of a wide angle wind by the ram pressure of outflowing material (Delamarter et al., 2000). In the case of a jet source the interior cavity wall is supported at the head by the ram pressure of the jet and along the radial edges by shock heated gas in the “cocoon” region between the jet beam and bow shock (Blondin et al., 1990). The jet models presented here feature a tenuous, narrow cocoon region between the radial edge of the jet beam and the dense shell of wind-swept ambient gas due to strong radiative cooling (figure 1, bottom). The radiative cooling acts to remove the pressure support of the radial edges of the cavity. The cocoon pressure plays dynamically minor in these models.
When the driving source shuts off the walls of the cavity and will flow back towards the source through an expansion wave. The backfill process can be seen in the fossil cavity as a reduced contrast in the cavity compared with the continuous cases. Figures 5 & 6 plot crosscuts taken transverse to the direction of outflow direction showing , (solid line), (dotted line), and (dashed line) for the jet and wide angle driven fossil cavities respectively. The backfill process is driven by a triplet of waves. 1) An interior or “wind” shock delineating the bounds of the cavity evacuated after the expiration of the wind source, 2) a contact discontinuity separating wind gas from wind-swept ambient gas, and 3) an expansion wave that drives the backfill of the dense shell of wind-swept gas toward the interior of the cavity. The speed of the inward collapse of wind-swept gas is expected to be approximately that that of an expanding rarefaction, . The low-latitude edges of the cavity retain some forward or axial momentum. Therefore the walls of the cavity will diagonally forward with negative and positive .
In the top crosscut panel of figure 5 at , the outflow source is still driving the jet. The density cross cut reveals a density contrast (the ratio of the ambient density to that inside the cavity). As expected the velocity plots reveal that the flow inside the jet beam diving the outflow is hypersonic and forwardly directed with subsonic radial motion in the cocoon between the driving jet and bow shock. At (center panel), the rarefaction that ensues due to the expiration of the driving wind has left an evacuated cavity with a large () density contrast in the region previously occupied by the driving wind. At this time the dense shell of wind swept gas just behind bow shock has begun backfilling into the cavity at . The interior shock that precedes the infall expansion wave has not yet reached the symmetry axis of the cavity. In the lower panel taken at the interior shock has reflected off the symmetry axis. The cavity walls have completely backfilled into the cavity leaving a density contrast of . At this evolved stage, the motion inside the cavity is primarily radial infall. The density contrast of the cavity will become further reduced as the infall of the cavity walls continue at later time.
Figure 6 shows crosscuts for the wide angle wind simulation. In the top panel, taken at , the wide angle wind outflow source is still active. At the polar latitudes intercepted by the crosscut, most of the velocity is forwardly directed. The densest outflowing gas appears in the swept-up shell and the in the “jet” associated with the flow along the pole (high latitudes). The maximum density contrast occurs inside the cavity at lower latitude. At (center panel), the rarefaction that ensues due to the expiration of the driving wind has left an evacuated cavity with a density contrast of . The outer shell of wind-swept gas backfills at . In the lower panel at the interior shock has reflected off the symmetry axis. At this time, the maximum density contrast inside the cavity has dropped to .


|
 |


|


|
 |


|
 |


|
 |


|
3.3 Cavity Deceleration and Protostellar Turbulence
We seek a simple analytic estimate relating the age and momentum carried by fossil cavities to their directly observable properties (size, mass, expansion rate). Consideration of a spherically symmetric impulse carrying total momentum imparted into a thin shell of wind swept gas that propagates into a uniform environment of density leads to a momentum conserving self-similar model for the the observed outflow cavity. The volume, , swept by the shell is given as
where is the velocity of the expanding shell. Momentum conservation yields
where is the mass entrained into the wind swept shell. Substituting for the mass swept into the shell we have
This scaling relation provides a simple model for momentum-driven, self-similar, spherical flows. Quillen et al. (2005) employ this scaling relation to infer that the ensemble of fossil outflow cavities they observed in NGC 1333 contain enough momentum to maintain turbulence in the cloud. This relation applies only to extinct outflows with , due to the explicit assumption of an impulsive driving wind built into the scaling relation. While protostars do not eject outflow momentum instantaneously, this is a reasonable approximation for long-extinct outflows. We emphasize that due to the strong radiative energy loss characteristic of YSO environments, thermal pressure plays a minor role in driving their dynamics. Therefore such flows satisfy the momentum-driven constraint. However, YSO outflows, in general, are not spherical and the backfill of the fossil cavity cannot be described by such a self-similar motion. We therefore express the volume subtended by the bow shock of a YSO outflow cavity more generally as
where is an arbitrary function of time that accounts for the deviation of the actual cavity size from that predicted by the approximate scaling relation.
We extract from the simulations by measuring the volume enclosed by the bow shock delineating the fossil cavity at 100 equally spaced intervals in time through out the simulation. The ambient density and net momentum injection used in the fossil cavity models presented here yield for the jet model and for the WAW model. We have taken as the net momentum imparted to the cavity throughout the simulation independent of time. Therefore is the factor by which the impulsive, momentum-driven scaling relation misinterprets the cavity size-age relationship of the simulated fossil cavities. Figure 7 shows
for the jet driven (left) and WAW driven (right) cases. The solid vertical line in the plots is at for the jet and wide angle wind cases respectively and the dotted vertical line in the plots at denotes the time where the radial edge of the fossil cavities have decelerated to . First we note that throughout most of the cavity lifetime. The faster than predicted cavity expansion is likely due to a combination of factors not accounted for in the simple scaling law. First is the effect of the geometry of the flow. The scaling law is essentially a 1D approximation while the simulations show complex 2D motions both at the head of the jet and, in the case of the wide angle wind, along the walls of the cavity where wind material is redirected by an oblique shock. The collapse of the interior walls into the cavity also changes the global dynamics. This effect violates the assumption that a thin, wind swept shell of gas will delineate the cavity perimeter. The ambient gas overrun by the cavity will not, in general, be accelerated to travel with the outer outflow shell, particularly in the case of a jet-driven cavity. Some of the gas entrained into a cavity may be accelerated to a speed that is only some fraction of that of the cavity walls. The scaling law therefore under estimates cavity volume. The most significant observational consequence is that this model may underestimate the net momentum of observed cavities inferred from their volume. In spite of these effects the scaling law retains reasonable predictive capacity for interpreting decelerating cavities. Because the geometry of the driving wind of an observed cavity is often unknown, the scaling relation provides a reasonable rough approximation for interpreting observational data, particularly when the exact geometry of the cavity is obfuscated.


Figures 5 & 6 show that the expansion of the radial edges of the simulated cavities decelerated to considerably less than the turbulent speed typical of star forming environments of a few (Vazquez-Semadeni et al., 2000) by . Therefore, the cavities can continue to expand for no more than a few more turbulent crossing times. By the time several turbulent crossing times have elapsed, the cavity will have entrained enough of the turbulent ambient gas to be subsumed into and become indistinguishable form the turbulent motions of the cloud. Its momentum will act to feed the turbulence that will ultimately destroy it. Quillen et al. (2005) reach the same conclusion for cavities observed in NGC 1333 using the scaling relation that is in rough agreement with our simulation models. This picture of outflow driven turbulence is also supported by recent 3D numerical MHD simulations of Li & Nakamura (2006). They model protostellar outflow ejection from dense condensations that form the evolution of an initially Jeans-unstable, rotating, magnetized cloud. The initially seeded “interstellar turbulence” decays rapidly, allowing the formation of gravitationally bound condensations. They find that “protostellar turbulence” replenishes turbulent motion and inhibits further collapse in the cloud by imposing that 10% of each core mass is ejected at speeds characteristic of protostellar outflows. We note in that study the “fossil” nature of the driving outflows was not addressed.
The velocity of the wind in the simulations was reduced from to zero rather abruptly. A protostellar outflow would likely expire less dramatically. The ensuing rarefaction and cavity infall would proceed with less voracity than in these models and the deviation of the cavity size from the scaling relation should be less than the prediction given by our models. Therefore, the net momentum inferred from the size of an observed cavity at using the scaling relation should be accurate to within a factor of a few. By , the radial edges of both the jet and wide angle wind driven cavities have decelerated to . At later time, a real fossil cavity would be disrupted by the ambient turbulence of its parent cloud. The cavity would become observationally confused with the ambient turbulence. Figure 7 shows that the scaling relation provides a prediction of the cavity volume that is accurate to within a factor of a few for . Thus we conclude that the scaling laws capture a reasonable approximation of the cavity behavior and the conclusions of Quillen et al. (2005) relating to the momentum injection, outflow dynamics and turbulent energy balance in NGC 1333 are supported by our simulations.
3.4 PV diagrams
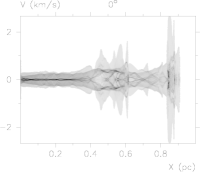
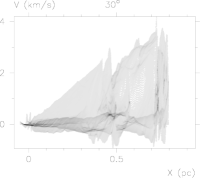
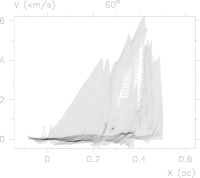
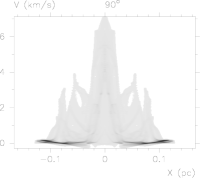
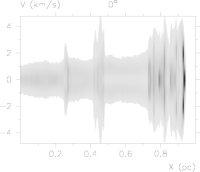
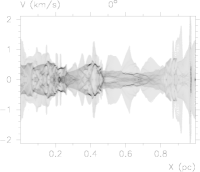
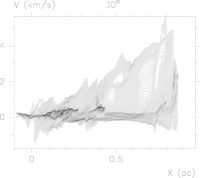
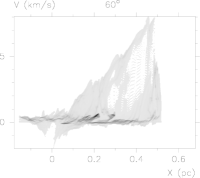
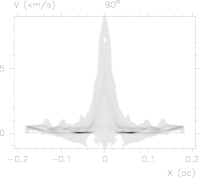
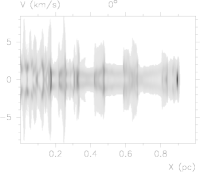
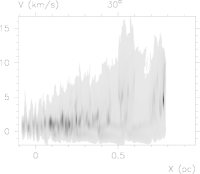
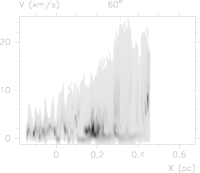
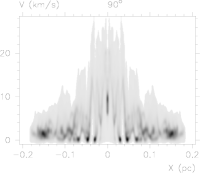
In this section we present synthetic Position Velocity (PV) diagrams of our simulations. In particular, we seek characteristics of fossil outflows that are readily distinguished by observation. PV diagrams are commonly used to visualize observational data of molecular outflows. Specifically, PV diagrams represent the distribution of molecular gas at each velocity in the direction of the line of sight at each position along a slit placed across a molecular outflow. We construct PV diagrams for each of the simulations presented here at four angles of inclination to the plane of the sky, , , and . The synthetic PV data presented below have been processed through a Gaussian filter with half-width and .
In figure 8 synthetic PV diagrams of molecular gas in the simulation domain have been taken along the z-axis at four angles of inclination to the plane of the sky for the jet driven fossil cavity. The densest gas along the outer wall of the cavity appears as a horizontal bell-shaped distribution of gray scales when the fossil cavity is oriented with its symmetry axis parallel to the plane of the sky (upper left). Note that gas expelled radially from the head of the outflow subsequently decelerates as it flows backwards (in the frame of the outflow head). The gas that is closest to the outflow source has decelerated the most. At these positions gas appearing at higher velocity than the cavity walls is backfilling from the inner cavity wall into the cavity. By the end of the simulation the speed of the radial infall exceeds the radial expansion of the cavity walls.
At oblique orientations (figure 8, upper right and lower left), we identify a distinct right triangle-shaped feature. The vertical leg of the triangle represents the fastest moving gas at the head of the outflow. The horizontal leg appears due to the subsonic backfill of the cavity walls. The hypotenuse is the Hubble law flow formed through velocity segregation as material closest to the head of the flow propagates fastest and material closest to the source has decelerated the most.
When the line of sight with the outflow axis is oriented perpendicular to the plane of the sky (lower right) only the axial velocity contributes to the PV diagram. Now the fastest moving material appears within the observed central spike and the most decelerated material appears furthest from the central source.
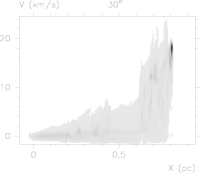
We can contrast the PV distribution of the jet driven fossil cavity with its continuously driven counterpart (figure 9). Again, the densest gas delineates a bell shape when the outflow axis is oriented parallel to the plane of the sky. In this case there is no stationary material in contrast to the fossil cavity. Because the outflow is driven from the boundary of the grid is initially atomic and hence not revealed in the PV data and the continuous driving does not allow backfilling into the cavity, there is no transition between the radial expansion and infall within the outflow structure and hence no stationary gas. Also, in contrast to the fossil cavity at oblique inclinations, the velocity of gas follows a faster than linear increase in velocity with distance from the source. Gas that is radially expelled from the head of the outflow is highly supersonic with . The propagation of the head of the fossil cavity is nearly an order of magnitude lower. The continuously driven jet is subject to greater radiative energy loss and hence a lower cocoon pressure than the fossil jet. The greater loss of this pressure support causes radially expanding gas to undergo a more rapid deceleration than in the fossil cavity case, yielding the faster increase in velocity from the outflow source.
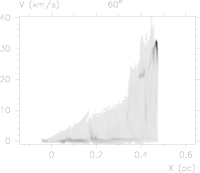
Most of the features of the PV data for jet driven fossil cavities applies to the PV data of the wide angle wind driven cavity (figure 10). One notable difference is that the densest gas along the cavity wall, delineated by a bell shape at zero inclination to the plane of the sky, retains some radial expansion close to the outflow source. The wide angle wind applies ram pressure driving to the entire perimeter of the cavity walls rather than solely at the head of the outflow as in the jet driven case. This prevents the stall of radial expansion of the base of the outflow.
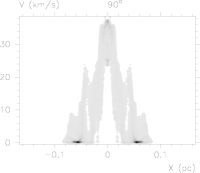
Similarly, the features present in the PV data for continuously driven jets apply also to the continuously driven wide angle wind (figure 11). In this case, however, the radial expansion of the outflow near the source exceeds the radial expansion at the tip of the outflow. This is due to the isotropic ram pressure of the driving wind that prohibits the stall of the cavity expansion near the base of the source.
In each configuration, jet, wide angle, fossil and driven, the condensed gas at the head of the cavity has retained most of the momentum injected by the wind. This appears as a central spike in the PV diagrams where the outflow axis is oriented directly toward the observer. The wide angle wind cases reveal greater rates of radial expansion near the base of the outflow than their jet driven counterparts. Because the wide angle winds used in these simulations produce a relatively collimated outflow structure, this is only easily distinguished when the outflow axis is oriented along the plane of the sky. In the simulations of continuously driven winds (figures 9 & 11), most of the gas entrained in the outflow is concentrated at velocities that follow a slightly faster than linear increase in velocity with position from the driving source at oblique inclinations. This result was also noted in the jet driven outflow models of Lee et al. (2001). Molecular gas that has backfilled into the cavity after the driving source has expired appears at each position in the PV diagram at low and intermediate velocity.
4 Conclusions
In this paper we have presented AMR simulations of molecular outflows driven into an ambient molecular cloud. We have compared simulations of a fossil cavity driven by a previously active jet, and that of a continuously driven jet. We also have compared simulations of a fossil cavity driven by a previously active wide angle wind to that of a continuously driven wind. Previous numerical simulations of molecular outflow have focused only on outflows driven by active sources. We find that the fossil cavities reach similar length scales as their continuously driven counterparts at much later times. Their aspect ratios approach a constant value, wheres those of the continuously driven outflows continue to increase. Hence the fossil cavities are wider than their continuously driven counterparts. We find that the density contrast (the ratio of the density outside the cavity to that inside) drops with time, due to backfill of wind-swept ambient gas into the cavity. At later times fossil cavities can have low density contrasts of order unity.
We have shown that a scaling law for self-similar flow derived from momentum conservation roughly predicts the volume of the fossil cavity. The fossil cavities expand somewhat faster than predicted from the scaling law. The success of the scaling law implies that observed sizes and velocities of cavities can be used to estimate the total momentum input required to create them. This point is crucial when using outflows as sources in energy budget arguments for re-energizing molecular cloud turbulent motions.
We find that synthetic position velocity plots of the fossil cavities exhibit Hubble law expansion patterns at intermediate viewing angles, whereas both fossil and active outflows contain spur patterns caused by the head of a bow shock. Our simulations of continuously driven outflows lack Hubble law patterns in the PV plots. It is tempting to consider the possibility that cavities that exhibit Hubble flows are fossil cavities rather than continuously driven outflows. However, previous simulations that have enhanced entrainment have also succeeded in showing Hubble laws. Furthermore some observed Hubble law flows have high velocities and so are likely to be actively driven (see figure 2 of Arce & Goodman 2001).
The interpretation of slowly expanding cavities in NGC 1333 as the relics of past outflow activity is supported by our simulations. The simulated fossil outflow cavities have a lifetime that of the duration of their driving source. Therefore, we expect fossil cavities to appear with the frequency of active outflows in molecular star forming regions. Quillen et al. (2005) arrived at a similar estimate from statistical considerations of the frequency of cavities they observed in NGC 1333 compared to the frequency of active outflows.
The outflow swept cavities that remain as relics of previous YSO outflow activity provide a link between outflow activity and the turbulent support of some molecular clouds. Fossil outflows retain speeds above the turbulent velocity of their parent cloud on a timescale greater than the lifetime of the driving source. Therefore, the fossil relic stage of an outflow’s lifetime will result in the entrainment of a considerable amount of ambient molecular material in addition to that which was swept up during the lifetime of the driving source. As ambient gas entrained into the cavity flow, the expansion of cavities will decelerate to speeds comparable to the turbulent speed of the ambient could. The coupling of the momentum carried by cavities will couple to the turbulent motions in the could via their disruption by the preexisting turbulent media into which they are injected, by the slow collision and overlap of two or more cavities or both. Future work should study the details of the mechanisms by which fossil cavities can re-energize a turbulent media through such coupling.
References
- Arce & Goodman (2001) Arce, H. G., & Goodman, A. A. 2001, ApJ, 551, L171
- Arce & Sargent (2005) Arce, H. G., & Sargent, A. I. 2005, ApJ, 624, 232
- Arce & Sargent (2004) Arce, H. G., & Sargent, A. I. 2004, ApJ, 612, 342
- Bachiller (1996) Bachiller, R. 1996, ARA&A, 34, 111
- Bally (1996) Bally, J., Devine, D., & Alten, V. 1996, ApJ, 473, 921
- Bally & Reipurth (2001) Bally, J, & Reipurth, B. 2001, ARA&A, 39, 403
- Bally et al. (1999) Bally, J., Reipurth, B., Lada, C. J., & Billawala, Y. 1999, AJ, 117, 410
- Beuther et al. (2004) Beuther, H., Schilke, P., & Gueth, F. 2004, ApJ, 608, 330
- Blondin et al. (1990) Blondin, J. M., Fryxell, B. A., & Konigl, A. 1990, ApJ, 360, 370
- Bontemps et al. (1996) Bontemps, S., Andre, P., Terebey, S., & Cabrit, S. 1996, A&A, 311, 858
- Cabrit et al. (1997) Cabrit S., Raga A., Gueth F., 1997, In: Reipurth B., Bertout C. (eds.) Herbig-Haro Outflows and the Birth of Low Mass Stars. IAU Symposium No. 182, Kluwer Academic Publishers, 163
- Crutcher et al. (2004) Crutcher, R. M., Nutter, D. J., Ward-Thompson, D., & Kirk, J. M. 2004, ApJ, 600, 279
- Cunningham et al. (2005) Cunningham, A., Frank, A., & Hartmann, L. 2005, ApJ, 631, 1010
- Davis et al. (2002) Davis, C. J., Stern, L., Ray, T. P., & Chrysostomou, A. 2002, A&A, 382, 1021
- Delamarter et al. (2000) Delamarter, G., Frank, A., & Hartmann, L. 2000, ApJ, 530, 923
- Downes & Ray (1999) Downes, T. P., & Ray, T. P. 1999, A&A, 345, 977
- Downes & Cabrit (2003) Downes, T. P., & Cabrit, S. 2003, A&A, 403, 135
- Gibb et al. (2003) Gibb, A. G., Hoare, M. G., Little, L. T., & Wright, M. C. H. 2003, MNRAS, 339, 1011
- Keegan & Downes (2005) Keegan, R., & Downes, T. P. 2005, A&A, 437, 517
- Knee & Sandell (2000) Knee, L. B. G., & Sandell, G. 2000, A&A, 361, 671
- Koo & McKee (1992a) Koo, B.-C., & McKee, C. F. 1992, ApJ, 388, 93
- Koo & McKee (1992b) Koo, B.-C., & McKee, C. F. 1992, ApJ, 388, 103
- Lada & Fich (1996) Lada, C. J., & Fich, M. 1996, ApJ, 459, 638
- Lebedev et al. (2004) Lebedev, S. V., et al. 2004, ApJ, 616, 988
- Lee et al. (2002) Lee, C.-F., Mundy, L. G., Stone, J. M., & Ostriker, E. C. 2002, ApJ, 576, 294
- Lee et al. (2001) Lee, C.-F., Stone, J. M., Ostriker, E. C., & Mundy, L. G. 2001, ApJ, 557, 429
- Lee & Ho (2005) Lee, C.-F., & Ho, P. T. P. 2005, ApJ, 624, 841
- Li & Nakamura (2006) Li, Z.-Y., & Nakamura, F., 2006, (astro-ph/0512278)
- Masson & Chernin (1993) Masson, C. R., & Chernin, L. M. 1993, ApJ, 414, 230
- Matzner (2002) Matzner, C. D. 2002, ApJ, 566, 302
- Matzner & McKee (1999) Matzner, C. D., & McKee, C. F. 1999, ApJ, 526, L109
- Micono et al. (2000) Micono, M., Bodo, G., Massaglia, S., Rossi, P., & Ferrari, A. 2000, A&A, 364, 318
- Noriega-Crespo et al. (2004) Noriega-Crespo, A., Morris, P., Marleau, F. R., Carey, S., Boogert, A., van Dishoeck, E., Evans, N. J., II, Keene, J., Muzerolle, J., Stapelfeldt, K. et al. 2004, ApJS, 154, 352
- Ostriker et al. (2001) Ostriker, E. C., Lee, C.-F., Stone, J. M., & Mundy, L. G. 2001, ApJ, 557, 443O
- Poludnenko et al. (2004) Poludnenko, A. Y., Frank, A., & Mitran, S. 2004, ApJ, 613, 387
- Poludnenko et al. (2005) Poludnenko, A., Varniere, P., Frank, A., & Mitran S, 2005, Springer’s Lecture Notes in Computational Science and Engineering, Vol. 41
- Quillen et al. (2005) Quillen, A., Thorndike, S., Cunningham, A., Frank, A., Gutermuth, R., Blackman, E., Pipher, J., & Ridge, N. 2005, ApJ, 632, 941
- Raga et al. (2004) Raga, A. C., Noriega-Crespo, A., Gonzalez, R. F., & Velazquez, P. F. 2004, ApJS, 154, 346
- Rosen & Smith (2003) Rosen, A., & Smith, M. D. 2003, MNRAS, 343, 181
- Rosen & Smith (2004) Rosen, A., & Smith, M. D. 2004, A&A, 413, 593
- Shu et al. (1995) Shu, F. H., Najita, J., Ostriker, E. C., & Shang, H. 1995, ApJ, 455, L155
- Shu & Osher (1988) Shu, C.W . & Osher, S. 1988, J. Comput. Phys., 77, 439
- Sutherland et al. (2003) Sutherland, R. S., Bisset, D. K., & Bicknell, G. V. 2003, ApJS, 147, 187
- Suttner et al. (1997) Suttner, G., Smith, M. D., Yorke, H. W., & Zinnecker, H. 1997, A&A, 318, 595
- Smith et al. (1997) Smith, M. D., Suttner, G.; & Yorke, H. W. 1997, A&A, 323, 223
- Varnie et al. (2005) Varniere, P., Poludnenko, A., Cunningham, A., Frank, A., & Mitran S, 2005, Springer’s Lecture Notes in Computational Science and Engineering, Vol. 41
- Vazquez-Semadeni et al. (2000) Vazquez-Semadeni, E., Ostriker, E. C., Passot, T., Gammie, C. F., & Stone, J. M. 2000, Protostars and Planets IV, 3
- Vishniac (1994) Vishniac, E. T. 1994, ApJ, 428, 186
- Warin et al. (1996) Warin, S., Castets, A., Langer, W. D., Wilson, R. W., & Pagani, L. 1996, A&A, 306, 935
- Welch et al. (2000) Welch, W. J., Hartmann, L., Helfer, T., & Briceño, C. 2000, ApJ, 540, 362
- Zhang & Zheng (1997) Zhang, Q., & Zheng, X. 1997, ApJ, 474, 719