Multiwavelength Observations of 1ES 1959+650, One Year After the Strong Outburst of 2002
Abstract
In April-May 2003, the blazar 1ES 1959+650 showed an increased level of X-ray activity. This prompted a multiwavelength observation campaign with the Whipple 10 m -ray telescope, the Rossi X-ray Timing Explorer, the Bordeaux Optical Observatory, and the University of Michigan Radio Astrophysical Observatory. We present the multiwavelength data taken from May 2, 2003 to June 7, 2003 and compare the source characteristics with those measured during observations taken during the years 2000 and 2002. The X-ray observations gave a data set with high signal-to-noise light curves and energy spectra; however, the -ray observations did not reveal a major TeV -ray flare. Furthermore, we find that the radio and optical fluxes do not show statistically significant deviations from those measured during the 2002 flaring periods. While the X-ray flux and X-ray photon index appear correlated during subsequent observations, the apparent correlation evolved significantly between the years 2000, 2002, and 2003. We discuss the implications of this finding for the mechanism that causes the flaring activity.
1 Introduction
Blazars are a class of Active Galactic Nuclei (AGN) with collimated plasma outflows (jets) directed along the line of sight. The jets give rise to a continuum emission extending from the radio to X-rays, sometimes even into the MeV and GeV/TeV energy range. The blazar 1ES 1959+650 is one of ten blazars detected so far in the GeV/TeV energy range with ground based Cherenkov telescopes (Krawczynski, 2005; Tavecchio, 2004). With a redshift 0.047 (Schachter et al., 1993), it is further away from us than the two strongest TeV -ray sources Mrk 421 ( 0.031) and Mrk 501 ( 0.034) but substantially closer than the recently detected TeV emitters H 2356-309 ( 0.165) and 1ES 1101-232 ( 0.186).
In the year 2002, 1ES 1959+650 went into a state of high TeV -ray activity (Holder et al., 2003; Aharonian et al., 2003) and was observed intensively with good multiwavelength coverage (Krawczynski et al. (2004), called “Paper I” in the following). The source showed very hard X-ray energy spectra with 3-25 keV photon indices () between 1.6 and 2.4 (Paper I). The fact that its spectral energy distribution peaks sometimes at energies well above 15 keV makes the source one of the most extreme synchrotron blazars, similar to Mrk 501 (Pian et al., 1998) and 1H 1426+428 (Falcone et al., 2004).
The time-averaged TeV -ray energy spectrum from the flaring period of 2002 has been fitted with a power law model, giving a photon index of 2.8 over the energy range from 316 GeV to 10 TeV (Aharonian et al., 2003; Daniel et al., 2005). Although the TeV -ray spectrum of 1ES 1959+650 is steeper than that of Mrk 501 in its high state () (Aharonian et al., 1999), the difference may be entirely caused by the larger redshift of the source and hence the larger extent of extragalactic absorption in pair production processes of the TeV -rays with photons from the Cosmic Infrared Background (CIB) (Schroedter, 2005).
Interestingly, the source showed an “orphan” flare (a flare in the TeV -ray band without a corresponding flare in the X-ray band) on June 4, 2002. While the TeV flux increased from 0.260.21 times the flux to the Crab Nebula to about 4 times the flux of the Crab Nebula within 5 hrs, the X-ray flux, X-ray photon index, and the optical brightness stayed approximately constant. This 2002 observation challenges simple one-zone Synchrotron Self-Compton (SSC) models where the X-rays originate as synchrotron emission of a single relativistic electron population and the TeV -rays are produced from inverse Compton scattering of the synchrotron photons by the same population of electrons. Paper I discusses several possible explanations for the orphan flare: multiple emission zones contributing to the observed radiation, time variable external seed photons fields for inverse Compton processes, an ordered magnetic field aligned with the jet axis, and hadronic rather than leptonic emission models. In a more recent paper, Böttcher (2005) studied the possibility that the orphan flare originated from relativistic protons () in and processes inside the jet as the protons interacted with jet photons backscattered into the jet by a cloud several parsecs from the central engine. He finds that reasonable variations in the values of the model parameters explain all the data satisfactorily. A recent twist in the story of the orphan flare is its possible association with a TeV neutrino detected by the AMANDA neutrino telescope from the direction of 1ES 1959+650 in temporal coincidence, however, the statistical significance cannot be reliably estimated (Halzen & Hooper, 2005). If 1ES 1959+650 indeed emitted high energy neutrinos, purely leptonic synchrotron-Compton models would be ruled out.
In this paper we report on multiwavelength observations of 1ES 1959+650 performed between May 2, 2003 and June 7, 2003. During the week preceding our observations, the All Sky Monitor on board of the Rossi X-ray Timing Explorer (RXTE) satellite measured an elevated 2-12 keV flux on the order of 10 mCrab. We therefore invoked pointed RXTE observations and accompanying observations with the Whipple 10 m Cherenkov telescope, the Bordeaux optical telescope, and the University of Michigan Radio Astrophysical Observatory (UMRAO). While the TeV -ray observations did not reveal any major TeV -ray flare and the radio and optical data did not show significant flux variability, we did acquire an X-ray data set with light curves and energy spectra with high signal-to-noise ratio. We will discuss the data sets in Section 2, and present the multiwavelength light curves in Section 3. We study the secular evolution, i.e. long term evolution, of the X-ray/TeV -ray flux correlation and the X-ray flux versus X-ray spectral hardness correlation in Section 4. We study the spectral energy density (SED) and fit it with a SSC model in Section 5. We summarize and discuss the results in Section 6, focusing on a very interesting result from the X-ray observations: a secular evolution of the possible X-ray flux versus X-ray photon index correlation. Throughout the paper we will compare results from 2003 with those obtained in 2002 (Paper I) and in earlier observations in 2000 (Giebels et al., 2002). In the following, fit results are given in the text and in the tables with 90% confidence interval errors; in figures, we show 1 error bars and 90% confidence level upper limits computed with the method described in Helene (1983).
2 Data Sets and Data Reduction
Observations were taken with the University of Michigan Radio Astrophysical Observatory (UMRAO) between May 2 and June 29, 2003, with the Bordeaux optical telescope between June 7 and October 18, 2003, and with the X-ray satellite RXTE and the Whipple 10 m Cherenkov telescope between May 2 and June 7, 2003. Our X-ray observations added 34.5 ks of integration time to the 2000 data from Giebels et al. (2002) and the 2002 data from Paper I which we reanalyzed here. The TeV -ray data comprise 13.1 hrs. Detailed descriptions of the data cleaning and analysis procedures are given in Paper I and in Charlot & Le Campion (2004).
For the X-ray analysis, we use here the FTOOLS v5.3.1 package for
data cleaning and the Sherpa v.3.0.1 package for spectral fitting.
Power law and broken power law models were fitted over the energy range
from 4 to 15 keV, using a galactic neutral hydrogen column density of
1.01 cm-2 111This value was
obtained at http://heasarc.gsfc.nasa.gov/cgi-bin/Tools/w3nh/w3nh.pl
We exclude here the 3-4 keV data, as past experience has shown that
it has a somewhat lower reliability than the 4-15 keV data.
We limit the analysis of individual RXTE pointings to 15 keV
(rather than to 25 keV as in Paper I), as the 15-25 keV band
is dominated by Poissonian background fluctuations for
the “low flux” data sets from 2000 and 2003.
We quote TeV fluxes as integral fluxes in units of the flux from the Crab Nebula. Given the zenith angle range of the observations, the peak energy222The peak energy is defined as the energy at which the differential -ray detection rate peaks, assuming a source with the same spectrum as the Crab Nebula. of the flux measurements lies at 600 GeV. Based on the Whipple measurements of the energy spectrum from the Crab Nebula (Hillas et al., 1998), a flux of 1 Crab corresponds to a 1 TeV flux of (5.120.27stat) ergs cm-2 s-1.
3 Light Curves
We briefly discuss here the light curves proceeding from short wavelengths to long wavelengths.
The TeV -ray data (Figure 1a) shows mostly upper limits.
The observations did not reveal strong flares. Analyzing the entire TeV
-ray data set, the significance of the -ray signal over the 2 months
observation was 3.3 with a -ray rate of Crab units.
Thus even on the longest accessible time scales, we have only marginal evidence
for TeV -ray emission from the source. The large “gap” in the -ray light
curve corresponds to the full moon period when Cherenkov telescopes cannot be
operated in standard mode and some additional down-time owing to bad weather.
The 10 keV X-ray flux (Figure 1b) varies by a factor of 3.4 over
the course of the observations.
The X-ray flux seems to be correlated with the 4–15 keV photon
index (Figure 1c) in the sense that higher fluxes are
accompanied by harder energy spectra.
We do not show the optical data in Figure 1 as only one observation
was taken during the multiwavelength campaign. During this one observation,
the V-band optical magnitude was mag. The majority of optical
observations were taken after the multiwavelength campaign. The flux measured during
54 nights between Jun. 7 and Oct. 18, 2003, varied between 14.89 mag and 15.67 mag with
an average of mag. During the 2002 flaring phase, the V-band
magnitudes varied between 15.4 mag and 15.7 mag (Paper I).
The combined 2002 and 2003 data thus show no evidence for correlation between the
major X-ray/TeV -ray flaring phases and emission levels in the optical.
The 14.5 GHz and 4.8 GHz radio data are shown in Figs. 1d and 1e respectively.
We do not show here the 8 GHz data as it consists only of two data points.
The radio data do not show significant evidence for flux variability and the observed
values are consistent with those measured earlier (Paper I, Gregory & Condon (1991); Becker et al. (1991)).
The data show that the fractional flux variability of 1ES 1959+650 in the radio band
is 10% or less. Radio observations with higher sensitivity are needed to access
any correlation between the radio fluxes and the X-ray or TeV -ray fluxes.
4 Secular Evolution of the X-Ray/TeV Flux Correlation and the X-Ray Flux/Spectrum Correlation
The correlation between simultaneously measured TeV -ray and X-ray fluxes
during the 2002 and 2003 observation campaigns are shown in Figure 2.
The 2002 X-ray points are from our re-analysis of the data presented in Paper I.
While the TeV -ray points are the same as in Paper I, we converted here
all fluxes with a statistical significance below 1.6 (90% confidence) into upper limits.
One can recognize that the main difference between the 2002 and 2003 observations
is a lack of strong X-ray and TeV -ray flares during the 2003 observations.
Since both the X-ray and TeV -ray fluxes were lower in 2003 than in 2002,
the data also do not show evidence for a correlation.
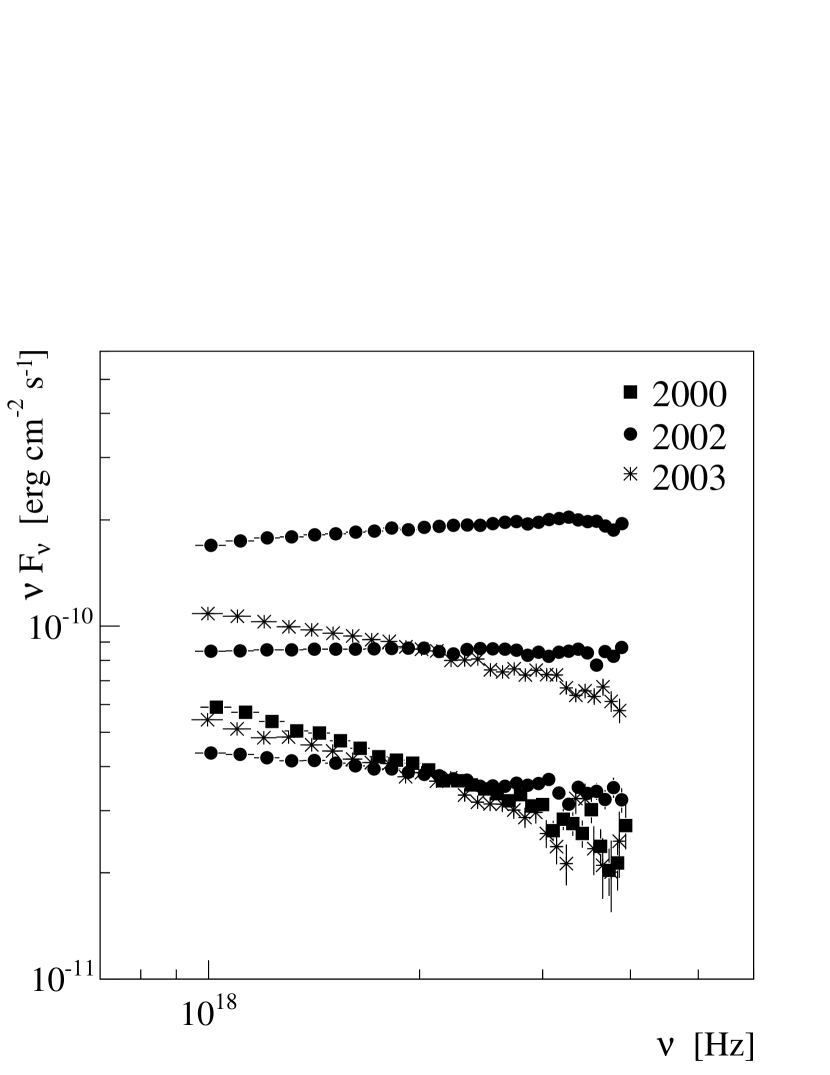
The X-ray flux versus X-ray photon index correlation is shown for the 2000, 2002,
and 2003 data sets in Figure 3. The fluxes and photon indices appear to be
correlated for the 2002 data set, and to
a lesser extend in the 2003 data set; however, a secular evolution
of the “correlation” can be recognized. For the same X-ray flux level, the
energy spectrum was hardest during 2002, the year of the large X-ray and
TeV -ray flares. We studied this effect further with a detailed spectral analysis
in three flux bands. The June 2003 data, the entire 2000 data set, and a significant part of
the 2002 data fit within a low 10 keV flux band of
0.1-0.4 cm-2 s-1 keV-1. A medium flux band was chosen
similarly and encompasses the May 2003 data and a portion of the 2002 data. Finally, a
high flux state represents the
flaring data in 2002.
Details of the combined spectra in these flux bands is given in
Table 1
For the 2003 medium and 2002 high flux states the reduced
values are significantly better for either a cutoff power-law
or log-parabolic model than a simple power law.
Log-parabolic fits provide a direct way of
calculating the peak in the total synchrotron spectrum.
Figure 4 shows the 4-15 keV
spectral energy distributions from Table 1
after applying a log-parabolic fit.
The 2003 low and medium flux state give a peak synchrotron energy of 1.210.64 keV and
1.090.41 keV.
5 Spectral Energy Distribution and SSC Modeling
In Figure 5 we show the radio to -ray SED of 1ES 1959+650 together with results from simple one-zone SSC calculations. The SSC code333The code can be downloaded on http://jelley.wustl.edu/multiwave/ Krawczynski et al. (2004) assumes a spherical emission volume of radius moving with bulk Lorentz factor toward the observer. The emission volume is filled with an isotropic electron population and a randomly oriented magnetic field . The energy spectrum of the electrons is assumed to be a broken power law from energy to with differential spectral indices ( from ) of 2 and 3 below and above the break energy . We use the CIB model of Kneiske et al. (2002) to calculate extragalactic absorption of the TeV -rays in pair production processes.
Figure 5 shows our SSC model with three different sets of parameter values, (i) the set of model parameter values from Paper I that describes an SED observed during 2002 at intermediate flux levels, (ii) the same model parameter values adapted to fit the 2003 SED by reducing the and values; and (iii) an alternative fit to the 2003 data allowing free variation of the parameter values. Note that (i) and (ii) produce almost identical Inverse Compton components. The parameter values are summarized in Table 2. Explaining the differences between the 2002 and 2003 SED with a change of and alone results in a rather low predicted TeV -ray flux. However, both (ii) and (iii) are consistent with the data. We will discuss the SSC model fits further in the next section.
6 Summary and Discussion
In this paper, we have presented the results of a multiwavelength
campaign on the blazar 1ES 1959+650 carried out in May and June 2003,
one year after the major flaring phase of 2002.
Our campaign did not reveal a statistically significant TeV -ray flare and
the highest X-ray fluxes observed during the 2003 campaign were lower by a factor
of five than the highest fluxes observed in 2002.
Contrasting the behavior of the source at high energies (X-rays and -rays),
the optical and radio flux levels did not change from 2002 to 2003.
The lack of a correlation between the high-energy (X-ray and -ray)
and low-energy (radio and optical) flux levels observed in the years
2002 and 2003 suggest that the
high-energy radiation is produced close to the central engine, and the
low-energy radiation further downstream of the jet. Indeed radio emission
produced
closer to the source
would be self-absorbed and hence not visible. It is also possible
that optical emission may come from “old”
components that do not shine in X-rays anymore, but could in fact be closer to
the central engine.
The examination of a possible correlation between the TeV -ray flux
and X-ray flux will benefit greatly from more sensitive Cherenkov telescopes such as
VERITAS or MAGIC (MAGIC detected 1ES 1959+650 in September and October 2004
in a state of low activity with a significance of 8.2 after
6.0 hours of observations (Albert et al., 2005).)
An interesting result from our campaign is that the 10 keV fluxes and 4-15 keV photon
indices appear correlated during individual observation periods, but that the
apparent correlation evolves on a time scale on the order of a year.
In an initial attempt to identify whether a single model parameter might be responsible for
the secular evolution, we varied individual SSC model parameters and studied the effect on a
correlation between X-ray flux and photon index.
Comparing the correlations resulting from varying individual model parameters (Figure 6)
with the apparent observed correlations (Figure 3), one may speculate that individual flares
on a time scale of days are caused by a variation of the Doppler factor , the magnetic field ,
and/or and that
the secular evolution of the source on a time scale of months is caused by a shift of the maximum energy
to which electrons are accelerated. In a similar study of the blazar Mrk 501 (an object in
many aspects similar to 1ES 1959+650), Tavecchio et al. (2001) also identified
as a likely parameter to cause long-term variations
of the fluxes and energy spectra.
The results discussed here should be taken with caution, as we cannot exclude that
several jet parameters change simultaneously from flare to flare and on longer time scales.
Recently, Uttley et al. (2005) interpreted the flaring activity of AGN as a red-noise process with significant power at low frequencies and a log-normal amplitude distribution. In this context, hourly and daily variations are considered high frequency noise, and yearly variations low-frequency noise. As the discussion above shows, secular evolutions of the emission characteristics may be able to shed light on the physical origin of the “power at low frequencies”. Long-term monitoring on time scales of years may thus be equally crucial for understanding the inner workings of AGN jets as intensive observations on time scales of several weeks.
Acknowledgments: This research is supported by the U.S. Department of Energy, the National Science Foundation, the Smithsonian Institution, by NSERC in Canada, by Science Foundation Ireland and by PPARC in the UK. K. G.and H. K gratefully acknowledge support by NASA through grant NAG 13770 and support by the Department of Energy through the Outstanding Junior Investigator program. The University of Michigan Radio Astronomy Observatory (UMRAO) is partially supported by funds from the Michigan Department of Astronomy.
References
- Aharonian et al. (1999) Aharonian, F., et al. 1999. A&A, 342, 69
- Aharonian et al. (2003) Aharonian, F., et al. 2003. A&A, 406, L9
- Albert et al. (2005) Albert, J., et al. 2005. astro-ph/0508543
- Böttcher (2005) Böttcher, M. 2005. ApJ, 621, 176
- Becker et al. (1991) Becker, R. H., White, R. L., & Edwards, A. L. 1991. ApJS, 75, 1
- Charlot & Le Campion (2004) Charlot, P. & Le Campion, J.-F. 2004. In Combes, F., Barret, D., Contini, T., Meynadier, F., & Pagani, L., eds., Société Française d’Astronomie et d’Astrophysique – Scientific Highlights 2004, 425. Observatoire de Paris, Paris, Francaise
- Daniel et al. (2005) Daniel, M. K., et al. 2005. ApJ, 621, 181
- Falcone et al. (2004) Falcone, A. D., Cui, W., & Finley, J. P. 2004. ApJ, 601, 165
- Giebels et al. (2002) Giebels, B., et al. 2002. ApJ, 571, 763
- Gregory & Condon (1991) Gregory, P. C. & Condon, J. J. 1991. ApJS, 75, 1011
- Halzen & Hooper (2005) Halzen, F. & Hooper, D. 2005. Astroparticle Physics, 23, 537
- Helene (1983) Helene, O. 1983. Nuclear Instruments and Methods in Physics Research, 212, 319
- Hillas et al. (1998) Hillas, A. M., et al. 1998. ApJ, 503, 744
- Holder et al. (2003) Holder, J., et al. 2003. ApJ, 583, L9
- Kneiske et al. (2002) Kneiske, T. M., Mannheim, K., & Hartmann, D. H. 2002. A&A, 386, 1
- Krawczynski (2005) Krawczynski, H. 2005. In Proceedings of Blazar Variability Workshop II: Entering the GLAST Era. Blazar Variability Workshop II, Miami, Florida, USA. Astro-ph/0508621
- Krawczynski et al. (2000) Krawczynski, H., Coppi, P. S., Maccarone, T., & Aharonian, F. A. 2000. A&A, 353, 97
- Krawczynski et al. (2004) Krawczynski, H., et al. 2004. ApJ, 601, 151
- Pian et al. (1998) Pian, E., et al. 1998. ApJ, 492, L17
- Schachter et al. (1993) Schachter, J. F., et al. 1993. ApJ, 412, 541
- Schroedter (2005) Schroedter, M. 2005. ApJ, 628, 617
- Tavecchio (2004) Tavecchio, F. 2004. In Procs. of ”the X’th Marcel Grossmann Meeting on General Relativity”
- Tavecchio et al. (2001) Tavecchio, F., et al. 2001. ApJ, 554, 725
- Uttley et al. (2005) Uttley, P., McHardy, I. M., & Vaughan, S. 2005. MNRAS, 359, 345


| Year | aa 10 keV flux in units of ( photons keV-1 cm-2 s-1) | bb Reduced -value from 26 degrees of freedom for a power-law fit | cc Reduced -value from 25 degrees of freedom for a cutoff power-law fit | dd Reduced -value from 25 degrees of freedom for a log-parabolic fit | ee Photon index for a log-parabolic fit | ff Curvature term for a log-parabolic fit | gg Flux normalization for a log-parabolic fit in | hh Peak energy from the log-parabolic fit in units of keV | iifootnotemark: |
|---|---|---|---|---|---|---|---|---|---|
| 2000 | 0.1-0.4 | 1.62 | 2.38 | 1.09 | 2.16 0.12 | 0.28 0.07 | 6.05 0.63 | 0.51 0.27 | 1.02 0.13 |
| 2002 | 0.1-0.4 | 1.12 | 1.09 | 0.97 | 2.03 0.08 | 0.11 0.05 | 3.16 0.23 | 0.71 0.62 | 0.51 0.04 |
| 0.4-0.7 | 1.47 | 0.96 | 0.92 | 1.77 0.06 | 0.13 0.03 | 4.32 0.24 | 6.76 4.80 | 0.86 0.12 | |
| 0.7-2.5 | 2.02 | 1.03 | 0.97 | 1.62 0.04 | 0.14 0.02 | 7.07 0.31 | 20.4 13.9 | 2.00 0.36 | |
| 2003 | 0.1-0.4 | 1.87 | 1.39 | 1.43 | 1.93 0.17 | 0.38 0.10 | 4.27 0.63 | 1.21 0.64 | 0.68 0.10 |
| 0.4-0.7 | 2.00 | 1.02 | 1.04 | 1.98 0.07 | 0.23 0.04 | 8.16 0.57 | 1.09 0.41 | 1.30 0.09 |
| eV | eV | eV | ||||||
|---|---|---|---|---|---|---|---|---|