22institutetext: Dpt. Cassiopée, UMR 6202, Observatoire de la Côte d’Azur, B.P. 4229, F-06304 Nice Cedex 4, France
Abundance anomalies in hot horizontal branch stars of the Galactic globular cluster NGC 2808. ††thanks: Observations collected at the ESO VLT.
We present metallicity measurements of 25 stars in the blue horizontal branch of the Galactic globular cluster NGC 2808. Our measurements are based on moderate–resolution spectra taken with the multi–object fiber facility FLAMES–UVES, mounted on Kueyen at the Very Large Telescope. We confirm that stars hotter than a threshold temperature have super–solar abundance, while the cooler ones respect the nominal metallicity of the cluster, i.e. [Fe/H]-1.1. The threshold temperature is estimated to be about 12 000 K, corresponding to the so called –jump, and coincides with the sudden departure of the cluster horizontal branch from the models. The metallicity increases with temperature for star hotter than the jump, confirming the hypothesis that the process responsible for this abrupt metallic enhancement is the levitation due to the strong radiation field in absence of a significative convective envelope. A metallicity dependence of the abundance enhancement is also suggested, with more metal poor clusters having a higher increase in metal content. The slope in the temperature vs. abundance diagram is higher than the errors involved, and the metal content of the cluster plays possibly a role in determining the amplitude of the jump (more metal poor clusters show more enhancement after the jump), although other parameters, such as clusters’ characteristics and even the atomic species involved, may also someway contribute.
1 Introduction
Stars in the Horizontal branch (HB) have already passed the red giant branch (RGB) phase and are now burning helium in their core (Hoyle & Schwarzschild, 1955). The wide colour distribution of the HB, called the HB morphology, is the result of large differences in the envelope mass of stars having the same core mass, at the same evolutionary stage. HBs in metal–rich clusters are usually populated mostly in the red part of the RR–Lyrae instability strip, whereas metal–poor ones tend to have an extension on the blue side, as first recognised by Sandage & Wallerstein, (1960). It soon became also clear that clusters metallicity is not the only parameter governing the HB morphology (Sandage & Wildey, 1967; van den Bergh, 1967). As a matter of fact, in several globular clusters (GCs) with intermediate and metal–rich content, a consistent or even dominant fraction of the HB stars is located blueward of the RR–Lyrae instability strip, locus to which we refer as BHB for the remainder of the paper.
Various issues that have arisen about the HB of GCs from the observational point of view are seriously challenging the HB standard models:
-
some clusters have HB blue tails that extend very far to the blue, up to 30 000 K or more (see Castellani & Castellani, 1993, for a theoretical explanation);
-
the stellar distribution of the HB is characterised by different gaps, i.e. different underpopulated areas (see e.g. Piotto et al., 1999, and reference therein) and luminosity jumps, i.e. discrepancies between the observed and the modeled distribution of stars in the colour–magnitude diagram (Grundahl et al., 1999; Momany et al., 2002);
-
the rotation–velocity distribution also shows peculiarities: some HB stars do not rotate as slow as expected for low–mass stars and even a few fast rotators ( km/sec) have been found in several clusters redward of the first luminosity jump at 11 500 K (Peterson, 1983; Behr, 1999; Recio–Blanco et al., 2004)
Gradually, some scenarios have been proposed in order to elucidate these facts which could be all intertwined (see e.g. Behr, 2003a , and reference therein). Still, the unresolved puzzles outnumber the answered questions.
The HB luminosity jump was first discovered in M 13, in an intermediate–band photometric study made by Grundahl et al., (1998). It was seen as a sudden departure of the observed location of the HB stars in the vs. diagram from the model track. Soon after (Grundahl et al., 1999), this feature was recognised to be ubiquitous, occurring at the same colour, i.e. at the same temperature within the errors, in all the surveyed clusters, no matter what their metallicity and morphology is, provided, of course, that they extend both blueward and redward of the jump. At a temperature higher than 20 000 K, the horizontal branch position on the colour–magnitude diagram becomes again consistent with the model track. This photometric jump corresponds with that in the Teff vs. log g diagram of M 15 discovered by Moehler et al., (1995). The mechanism suggested to be most likely responsible for both features is the radiative levitation of heavy metals, that increases the atmospheric abundance of the star. As a result the opacity due to the metallicity rises with respect to the hydrogen opacity. Hence there is an energy redistribution in which the Balmer jump is partially filled in, but the bolometric emission remains unchanged, and it is therefore seen as an increase in luminosity in the Strömgren and Johnson magnitudes (that is why Bedin et al., (2000) find the gap also in the vs. diagram). The occurrence of levitation was already argued by Michaud at al, (1983). They predicted that, if the outer envelope of hot HB stars is stable enough to allow helium gravitational settling, which was hypotesised by Greenstein et al., (1967) in order to explain observed helium underabundances, then there should be no such a mechanism like convection able to prevent the metal enhancement caused by the radiation. Caloi, (1999) used radiative levitation of metals to explain the presence of a gap at 8 500 K seen in several clusters (but not in NGC 2808). Hui-Bon-Hoa et al. (2000) made the only attempt to our knowledge to model the atmosphere of the HB stars taking into account radiative levitation and gravitational settling. They managed to reproduce the main observational features, such as the photometric jump, since the luminosity in each bandpass depends on the total opacity and not on the detailed abundance pattern. However these authors warn that the element abundances can only be reproduced with more sophisticated models.
The advent of the new generation telescopes made possible to check in a more direct way whether radiative levitation is at work and to make quantitative analysis. Chemical abundances on blue HB stars have been more extensively revisited by Behr, 2000a ; Behr, 2000b , further extended in Behr, 2003a ; Behr, 2003b ; Moehler et al., (2000); Fabbian et al., (2005). New detailed measurements of several elements confirmed that blue HB stars cooler than 11 000-12 000 K in general show no deviation from the globular cluster abundances derived from red giants. On the contrary, stars hotter than 11 000-12 000 K, depart from the general globular cluster abundances. In particular, iron, titanium and chromium enrichments to solar or even super–solar values are detected. In addition, some metals, such as phosphorus and manganese, display significantly larger enhancements than iron. On the other hand, the abundances of magnesium, silicon and calcium, both below and above the critical temperature of 11 000 K, are consistent with very little or no enhancement, even though a large, likely real scatter of silicon abundance is observed. Finally, underabundances of helium for stars hotter than 11 000 K are measured.
Stellar rotation could be tightly connected to the HB chemical anomalies. In particular, an abrupt change in the rotational velocity distribution along the HB at the level of the jump at 11 500 K (Recio–Blanco et al., 2002, 2004; Behr, 2003a ; Behr, 2003b ) can possibly be associated to the onset of radiative levitation. Angular momentum transfer prevented by a gradient in molecular weight (in a picture a la Sills & Pinsonneault, 2000) or removal of angular momentum due to enhanced mass loss (Recio–Blanco et al., 2002; Vink & Cassisi, 2002) could be responsible for that discontinuity. In any case, the average rotation rate is surprisingly high, considered that braking mechanisms should have spun down the progenitors of these HB stars, ever since their entrance on the main sequence, and the overall observed rotation distribution is far from being understood.
In summary, the observational results of the recent years are unveiling the details of a complicated puzzle of physical parameters (see e.g. Moehler et al., 2002; Recio–Blanco et al., 2005) and open a number of new questions. Is there a dependence of the chemical enhancements with the original metallicity of the stellar population? How is stellar rotation influencing the chemical abundance anomalies or vice versa? The answer to these questions will not only help to our fine–tuning of stellar evolution. Hot HB stars play an important role in population synthesis of extragalactic non resolved systems; as these old hot stars can be easily confused with young hot stellar population. For the same reason, they can also affect the modeling of the star formation history in dwarf galaxies of the Local Group which tries to reproduce their colour–magnitude diagrams (Tolstoy, 1998). New theoretical models with diffusion and radiative levitation on HB stars, supported by appropriate measurements, are essential to reconstruct the general picture.
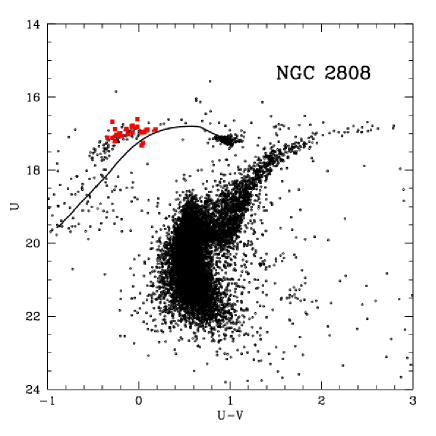
This work is intended to study the radiative levitation in the HB of NGC 2808. With that purpose, a sample of 32 stars belonging to the HB of this cluster, in the range of effective temperatures from 11 000 to 16 000 K, has been observed. NGC 2808, with its relatively high metallicity, ([Fe/H]=-1.14 according to Carretta et al, 2004), is one of the most peculiar examples of second–parameter GCs. It has a very extended blue tail, a marked bimodal distribution (Harris, 1974), being the loci both redward and blueward of the instability strip very well populated (see Bedin et al., 2000, for a recent high–precision photometry). The RR–Lyrae variables are very sparse: Clement & Hazen, (1989) found only two, while 16 of them could only recently be found by Crowin et al., (2004) by using new image–subtraction techniques that allowed the analysis of central crowded field. There are two additional significant gaps in the BHB star distribution at 18 000 and 25 000 K (Sosin et al, 1997). Moreover, enhancement and spread of helium among cluster stars has been recently suggested as a way to explain its HB morphology (D’Antona et al., 2005). Finally, NGC 2808 is about 20% younger than metal poor clusters of our Galaxy (Rosenberg et al., 1999; De Angeli, 2005).
Section 2 of this paper presents the observations and the data reduction. In Section 3, the atomic data and the derivation of the atmospheric parameters are addressed. The results are presented in Section 4 and discussed in Section 5 through a comparison with previously analysed clusters. The related topic of the rotation velocity will be treated in a separate work (Paladini et al., in preparation ), with a much wider dataset than the one used herin, to compensate with a rich statistic the projection of the rotational velocity, and with many more stars cooler than the luminosity jump, where most fast rotators have been found in other clusters.
2 Observations and data reduction
We have observed, in the ESO observing run 072.D-0742(A), a total of 32 stars, selected from the ground based wide field photometry by Momany et al., (2003, 2004). Due to their faintness (their visual magnitude is between 16 and 17.5 mag) and to the fact that they were collected within a more general programme aimed at the measurement of radial velocity of many hundreds of stars (Piotto et al., 2004), some of the spectra have a limited S/N ratio, ranging from few units to a few tens. Therefore, not all the observed stars were suitable for a reliable measurement of their abundance. Our final sample contains 24 stars, 18 of which are hotter than 12 000 K. The homogeneity of the star distribution in a temperature range that extends to over 16 000 K and the considerable number of the targets, make our sample unique among those so far observed in a single cluster for the same purpose.
Targets lie in the low–crowded outskirts of the GC, to avoid contamination from other stars. The spectra were obtained in service mode in December 2003 and February 2004. The data have been collected with the FLAMES fiber facility connected to the UVES spectrograph at the focus of the Unit 2, Kueyen, of the Very Large Telescope. The resolution was of R=47 000 and the exposure times ranged between 2 400 s and 3 000 s. The spectra have been reduced with the FLAMES–UVES pipeline (Modigliani et al., 2004), and then analysed both with MIDAS and IDL routines.
3 Abundance measurements
The abundance measurements were performed using the program WIDTH3, developed by R. G. Gratton and adapted by D. Fabbian to temperatures up to 20 000 K (Fabbian, 2004; Fabbian et al., 2005). The procedure establishes the abundances of chemical species by reproducing the observed equivalent widths. Once a starting set of values for the effective temperature, surface gravity, and model metal abundance is derived, an appropriate spectrum for each star is obtained from the grid of model atmospheres by Kurucz, (1994) by interpolating linearly in the temperature and logarithmically to get the Rosseland opacity, electronic and gaseous pressure, and density. Continuum opacity was obtained taking into account all important continuum opacity sources for stars as hot as K. Collisional damping constants were computed with the Unsld formula. The equation of transfer was then integrated through the atmosphere at different wavelengths along the line profile and theoretical equivalent widths of the lines computed and compared with the observed ones (see Fabbian et al., 2005, for further details).
3.1 Oscillator strengths, line selection, and solar abundances
Only lines clean from blends were considered in the analysis. In order to properly identify the spectral lines, we have used a line list suitable for our stars. The list assembled and used by Fabbian et al., (2005) was completed, for wavelength values larger than 5 000 Å, thanks to the DREAM line data base (Biemont et al., 1999), accessible via VALD (Kupka et al., 1999, and references therein). For the determination of the oscillator strengths (gfs), laboratory values were considered whenever possible. For Fe i lines they were taken from papers of the Oxford group (Simmons & Blackwell, 1982; Bard & Kock, 1994). The gfs for the Fe ii lines were taken from Heise & Kock, (1990) and Biemont et al., (1999). The solar abundances were taken from Grevesse & Sauval, (1998).
3.2 Equivalent Widths
The use of a FORTRAN program (courtesy of Patrick Francois) to automatically detect lines and measure their equivalent widths was attempted, but due once again to the rather low S/N ratio of the spectra, a more interactive procedure turned out to be more effective. Namely, we have manually detected the presence of lines and then fitted those lines that were identified (see next Section) with a Gaussian. We have then finally measured the equivalent width. The two latter steps were performed with IDL.
Due to the quality of the spectra, the uncertainties were the most important source of errors in the abundance determinations. This error was evaluated by comparing the equivalent width measurements of the Fe ii line at 4 923.93 Å in the five following stars: 37456, 41077, 41388, 46386 and 8072, namely, the stars before the jump for which this line was detected. These stars have almost equal atmospheric parameters, with differences just slightly larger than the internal errors. An analysis of the line measured in the five spectra, indicates that the standard deviation of the equivalent width measurements is mÅ. We expect this value to marginally overestimate the equivalent width errors, since the stars Are not identical. The value calculated through the Cayrel, (1988) formula:
with being the full width at half maximum (FWHM) typical of the lines, in this case 0.12 Å, and being the pixel size, about 0.03 Å, we get mÅ(assuming a 10). As expected, this value is lower than the standard deviation of the line in the five stars considered, but only by a small amount. This result implies that identification of the correct continuum level (that is neglected in the Cayrel formula) is not an issue here, as expected since the spectra of blue HB stars have very few absorption lines.
Consequently, we calculated the abundance errors, derived from an equivalent width uncertainty of 10.4 mÅ.
3.3 Atmospheric parameters
| STAR | R.A. | dec | U | B | V | ||
|---|---|---|---|---|---|---|---|
| [mag] | [K] | ||||||
| 8072 | 9:11:52.3843 | -64:49: 3.953 | 17.25 | 17.39 | 17.21 | 11684 | 12113 |
| 10277 | 9:12:32.7088 | -64:46:58.837 | 16.98 | 17.32 | 17.19 | 14725 | 15077 |
| 13064 | 9:11:35.8157 | -64:49:42.433 | 17.32 | 17.50 | 17.29 | 11802 | 12587 |
| 14923 | 9:11:27.8279 | -64:46:22.480 | 17.21 | 17.58 | 17.47 | 15475 | 15738 |
| 31470 | 9:11:42.4870 | -64:54: 1.044 | 17.06 | 17.34 | 17.25 | 14400 | 13985 |
| 37289 | 9:11:50.1411 | -64:57:33.778 | 16.89 | 16.95 | 16.80 | 11218 | 11201 |
| 37456 | 9:11:58.2345 | -64:57:13.008 | 16.97 | 17.05 | 16.92 | 11645 | 11444 |
| 39354 | 9:12:25.9222 | -64:55:12.385 | 16.84 | 17.00 | 16.89 | 12603 | 12253 |
| 39744 | 9:11:46.3567 | -64:54:57.860 | 17.11 | 17.46 | 17.40 | 15943 | 15314 |
| 40169 | 9:11:44.7537 | -64:54:44.000 | 17.01 | 17.23 | 17.13 | 13514 | 13179 |
| 41077 | 9:12:7.7814 | -64:54:43.751 | 16.90 | 16.94 | 16.82 | 11363 | 10947 |
| 41388 | 9:12:10.3543 | -64:54:10.584 | 16.95 | 16.99 | 16.88 | 11531 | 11060 |
| 45309 | 9:11:50.5199 | -64:52:56.754 | 17.03 | 17.34 | 17.27 | 15186 | 14504 |
| 46386 | 9:12:12.7009 | -64:52:38.390 | 16.97 | 17.08 | 16.94 | 11862 | 11683 |
| 47485 | 9:11:46.2764 | -64:52:20.187 | 16.88 | 17.19 | 17.14 | 15475 | 14544 |
| 47759 | 9:11:46.9302 | -64:52:16.032 | 16.79 | 16.96 | 16.87 | 12971 | 12440 |
| 49334 | 9:12:19.4986 | -64:51:51.615 | 16.82 | 17.09 | 16.83 | 12275 | 14060 |
| 53685 | 9:12:17.6106 | -64:50:42.834 | 16.61 | 16.75 | 16.62 | 12275 | 12210 |
| 53926 | 9:12:5.4170 | -64:50:39.279 | 16.79 | 17.00 | 16.85 | 12831 | 13033 |
| 54373 | 9:11:52.5314 | -64:50:32.329 | 16.98 | 17.23 | 17.05 | 12900 | 13585 |
| 54411 | 9:12:0.1819 | -64:50:31.816 | 16.67 | 17.01 | 16.96 | 15943 | 15120 |
| 55983 | 9:12:15.3646 | -64:50: 4.984 | 17.11 | 17.47 | 17.45 | 16914 | 15647 |
| 56118 | 9:12:10.9329 | -64:50: 2.593 | 16.87 | 17.10 | 17.01 | 13699 | 13311 |
| 56998 | 9:12:10.2714 | -64:49:47.545 | 17.04 | 17.31 | 17.25 | 14665 | 13911 |
| STAR | |||
|---|---|---|---|
| [K] | [km/sec] | ||
| 8072 | 11899 294 | 3.99 0.04 | 1.75 1 |
| 10277 | 14901 289 | 4.25 0.03 | 0.0+1.0-0.0 |
| 13064 | 12194 501 | 4.01 0.05 | 0.0+1.0-0.0 |
| 14923 | 15606 265 | 4.31 0.03 | 0.0+1.0-0.0 |
| 31470 | 14193 354 | 4.19 0.03 | 0.0+1.0-0.0 |
| 37289 | 11209 77 | 3.91 0.03 | 1.87 1 |
| 37456 | 11545 176 | 3.95 0.03 | 1.81 1 |
| 39354 | 12428 244 | 4.04 0.03 | 0.0+1.0-0.0 |
| 39744 | 15628 487 | 4.31 0.04 | 0.0+1.0-0.0 |
| 40169 | 13346 306 | 4.12 0.03 | 0.0+1.0-0.0 |
| 41077 | 11155 284 | 3.91 0.04 | 1.88 1 |
| 41388 | 11295 307 | 3.92 0.04 | 1.85 1 |
| 45309 | 14845 479 | 4.25 0.04 | 0.0+1.0-0.0 |
| 46386 | 11773 168 | 3.97 0.03 | 1.77 1 |
| 47485 | 15009 626 | 4.26 0.05 | 0.0+1.0-0.0 |
| 47759 | 12705 479 | 4.06 0.04 | 0.0+1.0-0.0 |
| 49334 | 13168 991 | 4.11 0.09 | 0.0+1.0-0.0 |
| 53685 | 12243 134 | 4.02 0.03 | 0.0+1.0-0.0 |
| 53926 | 12932 195 | 4.08 0.03 | 0.0+1.0-0.0 |
| 54373 | 13243 453 | 4.11 0.04 | 0.0+1.0-0.0 |
| 54411 | 15531 572 | 4.30 0.04 | 0.0+1.0-0.0 |
| 55983 | 16280 864 | 4.36 0.05 | 0.0+1.0-0.0 |
| 56118 | 13505 371 | 4.13 0.03 | 0.0+1.0-0.0 |
| 56998 | 14288 549 | 4.20 0.04 | 0.0+1.0-0.0 |
Model atmospheres appropriate for each star were extracted from the grid of Kurucz, (1994). values were determined from the colour of the stars in the Johnson vs. diagram by Momany et al., (2004, see Fig. 1 therein) and in the a vs. () diagram of the same authors. The models of Zero Age Horizontal Branch (ZAHB) by Cassisi et al., (1999) were used. Hereinafter, we adopt a reddening value of , from the Harris, (1996) compilation in its revised version of 2003.
To derive the final effective temperature of the programme stars, we calculated the mean of the derived temperatures using the (U-V) and the (U-B) colours. Table 1 presents the photometric parameters for all the observed stars in NGC 2808, with the corresponding temperature values derived from the colour–magnitude diagram of Momany et al., (2004), labelled and . Internal errors in the adopted temperatures were derived in the following way: we have derived four values of the temperature, two for each of the two photometries, respectively adding and subtracting the errors on the colours. We have then computed the half of the difference between the largest and the smallest values obtained. Clearly, this kind of procedure relies on present ZAHB models without radiative levitation unable to reproduce the observed horizontal branches between T 12 000 K and 20 000 K. This introduce external errors that are difficult to evaluate. In particular, the temperature determination relies on the criterion adopted to choose the point on the model track that represents our sample star, which, if enhanced, is far from being on the track. In the present analysis we have taken, for each star, the point on the model track that has the same colour as the star, according to the fact that temperatures are more colour sensitive in this region. Another approach is to choose the closest point of the ZAHB to the star. On the other hand, one of the objectives of this work is also to help the developing of the models. Nevertheless, in order to compare the effective temperatures adopted throughout this paper with those adopted in other abundance analysis of blue HB stars, we plotted (see Fig. 2) the runs of against the dereddened Johnson colour for both our program stars in NGC 2808 and the stars in NGC 288 analyzed by Behr, 2003a . NGC 288 was chosen because it has the same metallicity as NGC 2808. The reddenings here adopted are those from Harris, (2003) compilation.

As in Fabbian et al., (2005), gravities are not well constrained by our spectra: in fact equilibrium of ionization is subject to possible departures from LTE, and the Balmer lines are too broad for reliable determinations of their profile from our echelle spectra. We have then determined the gravities of our target stars from their corresponding effective temperatures, using the same method that Fabbian et al., (2005): a mean relation between and gravity (), from Behr, 2003a measurements of blue HB stars in NGC 288, that were expected to be very similar to those in NGC 2808 on the basis of the colour–magnitude diagram:
| (1) |
Errors in the gravities have been derived from the errors in the temperatures using Equation 1.
Microturbulent velocities might be derived by eliminating trends of the derived abundances with expected line strength for some given species. However, given the quality of our spectra, generally too few lines could be measured, and with too large scatter, to significantly constrain microturbulent velocity. For the cooler stars, we relied on Behr’s analysis of M 13 stars (as no cool HB stars have been already analysed in NGC 288). From his analysis, we derived the following relation between and the microturbulence velocity:
| (2) |
Uncertainties in these values for the microturbulent velocities can be obtained from the scatter of individual values around this mean relation: this is km/s. For the warmer stars, which have a very stable atmosphere, still enough to let helium sink and heavy metals levitate, we adopted 0 microturbulent velocity, in agreement with the values derived by Behr, 2003a in NGC 288.
A check on the accuracy of the chosen atmospheric parameters is given in Figure 3. The plot of excitation potential () vs. and Equivalent Width() vs. is shown for all the stars with eight or more Fe ii line detections. The number of Fe ii lines is never bigger than 13, hence we cannot use this method, as already stated, to determine directly atmospheric parameters. But the fact than in none of the 5 stars analysed a significant slope appears, suggests that and are properly chosen. This is actually a check on the =0 assumption for the stars after the jump, since all of the five stars in Figure 3 are on its blue side.
 |
 |
Finally, metallicities were obtained varying the metal abundance [A/H] of the model until it was close enough, namely within 0.01 dex, to the derived [Fe/H] value.
Table 2 presents the atmospheric parameters of the analysed stars with their corresponding internal errors. Once , , and atmospheric [Fe/H] were determined, we calculated the mean abundance and dispersion for each element. Since the abundances for each element depend upon the adopted parameters, we recalculated the abundances while varying each of these parameters in turn, in order to test the stability of our results.
4 Results
Table 3 contains the abundances of iron, titanium, and chromium derived for each of our target stars. The values are relative to the solar abundances of Grevesse & Sauval, (1998). The scatter of the measurements for the corresponding lines gives the quantity , which is added quadratically to the error contributions in , , , and [A/H] described in the previous Section, to get the final error for each element in each target star. The values for the dominant ionization stage (usually singly–ionized metals) were used as a best indicator of the actual chemical abundance, since these stages are least susceptible to non-LTE effects.
Figure 4 shows the iron abundances as a function of the effective temperature derived for our targets in NGC 2808. It is clear that a pattern of radiative levitation is present for blue HB stars, with iron abundances increasing gradually as temperature increases along the HB, up to a value of [Fe/H] dex. One more remarkable feature, not so clearly observed in previously analysed clusters, is the smooth ascending metallicity trend with temperature after the jump: the levitation becomes more and more efficient at high temperatures, hence for stronger radiation fields. Such a trend could only be discovered because of the richness of our sample and the uniformity of the temperature distribution of the stars in a very wide range, that goes from 1 000 K before the jump up to over 16 000 K. These qualities are unprecedented for single–cluster samples observed in this kind of studies. The trend can be either real or result from an incorrect temperature scale. On the one hand, there are to date no available model atmospheres that take into account radiative levitation. The discrepancy between the predictions of the model and the photometric data increases with the temperature, as clearly noticeable in Figure 1. Consequently, abundance overestimations could be stronger for stars at larger temperatures, thus producing a spurious trend in the abundance vs. diagram. On the other hand, the slope that we find in Figure 4 is too large to be easily dismissed as an effect of systematic errors and it has, on the contrary, a straightforward physical explanation: stronger radiation fields cause higher enhancements. We will not be able to say the final word on this until models for hot HB stars of stars are refined.
Although the overall trend, whether real or artefact, is unmistakably apparent, the spread of the data points about it is not marginal and there two strong outliers: 14923 at =15 606 and 49334 at =13 168, which are respectively over 1 dex above and almost 1 dex below stars with similar temperatures. The reason could reside in the measurement errors, as they are both stars with only one line detected. In addition, 49334 has also a large error in the temperature evaluation. We also have to remind ourselves that for the hottest stars the non–LTE behaviour of the stellar atmosphere is more and more important, hence our measurements, based on LTE modelling, less precise. This could lead to spurious trends for the few hottest stars of the sample, for which one would be tempted to suggest a saturation effect.
Looking at Figure 4 we notice, in addition, that the onset of levitation is quite abrupt for NGC 2808: in less than 500 K there is a change of more than 1 dex in Fe.
On the other hand, as it can be seen from Figure 4, the iron abundances for the coolest stars are very close to the cluster metallicity obtained here from analysis of red giant branch stars. We obtain an average value of [Fe/H]=, that is compatible with the abundances obtained from analysis of red giants: [Fe/H]=-1.14 on the Carretta & Gratton, (1997) scale (which should be consistent with the present analysis, as the code of Fabbian et al., (2005) for our metallicity measurements is the extension of the software used in the Carretta & Gratton, (1997) paper); and the slightly lower value of [Fe/H]=-1.23 given by Kraft & Ivans, (2003).
| Star | [Fe/H] | ||||||||
|---|---|---|---|---|---|---|---|---|---|
| 8072 | -1.29 | 0.10 | 2 | 0.03 | 0.01 | 0.01 | 0.19 | 0.23 | 0.30 |
| 10277 | 0.83 | 0.20 | 8 | 0.10 | 0.01 | 0.02 | 0.07 | 0.30 | 0.32 |
| 13064 | -0.66 | 0.08 | 2 | 0.05 | 0.01 | 0.01 | 0.07 | 0.32 | 0.33 |
| 14923 | 0.26 | – | 1 | 0.10 | 0.01 | 0.02 | 0.09 | 0.36 | 0.39 |
| 31470 | 0.69 | 0.30 | 5 | 0.10 | 0.01 | 0.01 | 0.09 | 0.30 | 0.33 |
| 37289 | -1.16 | – | 1 | 0.01 | 0.01 | 0.01 | 0.06 | 0.23 | 0.24 |
| 37456 | -1.13 | – | 1 | 0.02 | 0.01 | 0.01 | 0.23 | 0.22 | 0.32 |
| 39354 | 0.11 | 0.49 | 8 | 0.03 | 0.01 | 0.01 | 0.07 | 0.28 | 0.29 |
| 39744 | 1.21 | 0.43 | 5 | 0.19 | 0.01 | 0.06 | 0.04 | 0.34 | 0.39 |
| 40169 | 0.13 | 0.11 | 2 | 0.07 | 0.01 | 0.02 | 0.11 | 0.30 | 0.33 |
| 41077 | -1.07 | 0.70 | 2 | 0.04 | 0.01 | 0.01 | 0.30 | 0.23 | 0.38 |
| 41388 | -1.07 | 0.02 | 2 | 0.04 | 0.01 | 0.01 | 0.28 | 0.21 | 0.35 |
| 45309 | 1.05 | 0.33 | 10 | 0.15 | 0.01 | 0.02 | 0.06 | 0.30 | 0.34 |
| 46386 | -1.21 | 0.05 | 2 | 0.01 | 0.01 | 0.01 | 0.22 | 0.22 | 0.31 |
| 47485 | 1.46 | 0.24 | 7 | 0.20 | 0.01 | 0.01 | 0.11 | 0.28 | 0.36 |
| 47759 | 0.10 | 0.31 | 4 | 0.09 | 0.01 | 0.02 | 0.11 | 0.31 | 0.34 |
| 49334 | 1.23 | – | 1 | 0.03 | 0.01 | 0.02 | 0.05 | 0.28 | 0.29 |
| 53685 | 0.12 | 0.21 | 3 | 0.01 | 0.01 | 0.02 | 0.11 | 0.28 | 0.30 |
| 53926 | 0.64 | 0.04 | 3 | 0.04 | 0.01 | 0.01 | 0.11 | 0.25 | 0.28 |
| 54373 | 0.69 | 0.26 | 13 | 0.09 | 0.01 | 0.01 | 0.08 | 0.30 | 0.32 |
| 54411 | 1.07 | 0.24 | 8 | 0.19 | 0.01 | 0.02 | 0.07 | 0.31 | 0.37 |
| 55983 | 0.96 | 0.13 | 2 | 0.26 | 0.01 | 0.02 | 0.08 | 0.31 | 0.41 |
| 56118 | 0.81 | 0.30 | 7 | 0.10 | 0.01 | 0.01 | 0.08 | 0.28 | 0.31 |
| 56998 | 0.48 | 0.15 | 4 | 0.16 | 0.01 | 0.02 | 0.07 | 0.32 | 0.37 |
| [Ti/H] | |||||||||
| 39354 | 1.30 | 0.76 | 3 | 0.11 | 0.01 | 0.01 | 0.08 | 0.30 | 0.32 |
| 40169 | 2.01 | – | 1 | 0.11 | 0.01 | 0.01 | 0.11 | 0.33 | 0.36 |
| 54373 | 1.13 | 0.23 | 5 | 0.17 | 0.01 | 0.03 | 0.05 | 0.30 | 0.35 |
| 56118 | 1.00 | – | 1 | 0.15 | 0.01 | 0.04 | 0.03 | 0.29 | 0.33 |
| [Cr/H] | |||||||||
| 31470 | 0.11 | – | 1 | 0.12 | 0.01 | 0.05 | 0.02 | 0.45 | 0.47 |
| 40169 | 1.19 | – | 1 | 0.09 | 0.01 | 0.01 | 0.10 | 0.33 | 0.36 |
| 41388 | -0.93 | – | 1 | 0.04 | 0.01 | 0.01 | 0.03 | 0.48 | 0.48 |
| 49334 | 0.68 | – | 1 | 0.32 | 0.01 | 0.03 | 0.05 | 0.29 | 0.44 |

 |
 |
 |
 |
 |
 |
Due to the limited S/N ratio and the presence of cosmics, detections of chromium and titanium lines with a shape smooth enough to reliably measure their equivalent width, could only be made for 4 stars.
5 Comparison with other clusters
The measurement of radiative levitation in clusters with different metallicities is necessary to provide the appropriate data for the development of the models. NGC 2808 offers the opportunity of observing this effect in a cluster with a very particular HB morphology and a younger age (De Angeli, 2005).
An important cross check of the ubiquitous nature of the phenomenon of the levitation comes also from the comparison with NGC 288, a cluster with a metal content very similar to that of NGC 2808.
5.1 Metal enhancements and cluster metallicity
Figure 5, upper panel, shows the iron abundances derived in this paper as a function of the effective temperature, together with those of Behr, 2003a for M 15, M 13 and NGC 288, and those of M 79 from Fabbian et al., (2005). Error bars are not shown in the Figure for a purpose of clearness. The same data are also shown in Table 4, where we have written the abundance range that iron, chromium and titanium spread in five clusters analysed. The clusters in the Table are sorted according to their abundance nominal value, from the most metal poor in the top to the most metal rich in the bottom. It can be noticed, looking at the data about iron, that the most metal poor clusters tend to have larger abundance enhancements, suggesting the idea that all the clusters tend to reach the same value after the jump. The abundance spread within each cluster after the jump is very high, much more than for the coolest stars, because of the trend with temperature, at least in the case of NGC 2808, and possibly because of larger errors. As a consequence we do not see a narrower abundance distribution of the stars of all clusters after the jump. This trend is not confirmed for titanium and chromium, which, however, have a poorer statistic. In any case, also for iron, no firm conclusions can be stated at the moment.
Another apparent feature of Figure 5 is the overlapping of non–enhanced and enhanced region of the various clusters. This is likely due to error in temperature determinations, which, as we have seen in Section 3, are quite large for a given sample studied homogeneously. They must be considerably larger when comparing clusters analysed by different authors, since, as discussed in Section 3, not only differences in photometric zero point are there, but also the way of computing temperatures out of the photometry relies on models that do not match the data points. It therefore certainly introduces errors, which could differ from study to study. We cannot exclude, however, the possibility that the onset of radiative levitation takes place at slightly different temperatures in different clusters. Except for the hottest non–enhanced star in M 15, NGC 2808 has the hottest onset of levitation in any of the clusters in Figure 5. Once again, whether this is real and, in this case, what other properties are related to the onset temperature of the levitation, are questions that can only be answered with sufficient confidence when models that do match the data points become available.
| Cluster | Before jump | After jump | |||
| [M/H] range | Nstars | [M/H] range | [M/H] range | Nstars | |
| IRON | |||||
| M 15 | -2.51/ -2.25 | 12 | -0.12/ 0.25 | 2.24/ 2.61 | 6 |
| M 13 | -1.81/ -1.53 | 5 | -0.71/ 0.70 | 1.03/ 2.44 | 8 |
| M 79 | -1.48/ -1.17 | 3 | 0.36/ 0.60 | 1.70/ 1.94 | 7 |
| NGC 2808 | -1.29/ -1.07 | 6 | -0.66/ 1.46 | 0.50/ 2.62 | 18 |
| NGC 288 | -1.07 | – | 0.17/ 0.66 | 1.24/ 1.73 | 4 |
| Total | -2.51/ -1.07 | 26 | -0.71/ 1.46 | 0.50/ 2.62 | 43 |
| TITANIUM | |||||
| M 15 | -1.98/ -1.69 | 11 | -0.26/ 0.44 | 1.53/ 2.23 | 5 |
| M 13 | -2.16/ -1.24 | 5 | -0.99/ 0.05 | 0.41/ 1.45 | 7 |
| M 79 | -1.30/ -0.70 | 3 | -0.40/ 0.60 | 0.63/ 1.63 | 7 |
| NGC 2808 | – | – | 1.01/ 2.01 | 1.95/ 2.95 | 4 |
| NGC 288 | – | – | -0.36/ 0.64 | 0.50/ 1.50 | 3 |
| Total | -2.16—0.70 | 19 | -0.99/ 2.01 | 0.41/ 2.95 | 26 |
| CHROMIUM | |||||
| M 15 | -2.50/ -1.41 | 9 | -0.35/ 1.33 | 1.71/ 3.39 | 3 |
| M 13 | -1.69/ -1.57 | 4 | -0.95/ 0.42 | 0.70/ 2.07 | 5 |
| NGC 2808 | – | – | -0.93/ 1.19 | 0.12/ 2.24 | 4 |
| NGC 288 | – | – | -0.20/ 0.14 | 0.97/ 1.31 | 2 |
| Total | -2.50—1.41 | 13 | -0.95– 1.33 | 0.12/ 3.39 | 14 |
5.2 The case of NGC 2808
If we now examine the measurements in NGC 2808, it is clear, as pointed out in Section 4, that a pattern of radiative levitation is also present for blue HB stars. Nevertheless, the iron enhancement for stars between 11 500 K and 13 000 K, seems smaller than what is found in other clusters. Even NGC 288, with a very similar metallicity to that of NGC 2808, but with only 4 stars analysed, apparently shows a higher influence of radiative levitation, right after the jump, than NGC 2808 stars. No measurements of titanium or chromium are available for NGC 2808 in that range of temperature.
On the other hand, the hotter stars analysed in NGC 2808 present important signs of radiative levitation, arriving to iron enhancements slightly smaller than those of M 15 at lower temperatures. The enhancements of titanium and chromium for stars with T 13 000 K are also very remarkable and compatible or even slightly higher than those observed in other clusters.
In brief, NGC 2808 seems to have a progressive metal enhancement with temperature after Teff 12 000 K, spanning a larger range of abundances than other clusters, for which there is a more abrupt discontinuity at the level of the jump. Is this behaviour due to the higher metallicity of NGC 2808, to the complexity of its horizontal branch, or, more simply, to the better coverage (in temperature) of the HB in our analysis? In this sense, the comparison with NGC 288, having a similar metal content but a different HB morphology and age, can be very helpful. Unfortunately, up to date only four stars have been analysed in NGC 288 and they are not enough to perform an adequate comparison of the abundance anomalies in both clusters. In the future, it would be very interesting to put in relation the couple of clusters NGC 288 - NGC 2808, at a metallicity of [Fe/H] , with the couple formed by M 79 and M 13 at [Fe/H] .
6 Conclusions
The objective of this investigation was to shed more light on the nature of radiative levitation and diffusion of elements among horizontal branch stars and its connection with the physical properties of the affected stellar population. Globular cluster HB stars come from a coeval population with a very small, if any, initial abundance spread. As a consequence they offer a unique opportunity of tackling this issue. Studies, including the present, made so far on the metallicity of HB stars, lack of appropriate models describing the atmospheres of the enhanced stars. Abundance measurements at this stage, however, point to important conclusions which are unlikely to be a mere artefact of the measurement method: the slope in the temperature vs. abundance diagram is significantly higher than the errors involved and the metal content of the cluster has probably a primary role in determining the amplitude of the jump (more metal poor clusters show more enhancement among stars after the jump). To our knowledge, model atmosphere able to account for the radiative levitation are not yet available, even though a theoretical work on the phenomenon has been made (see Section 1). If, on one hand, the analysis here presented will be considerably improved when more adequate model atmospheres can be adopted, on the other hand the achievement proper models require observational clues regarding the amount of metal enhancement and its dependence on physical parameters and clusters’ properties. This paper is also meant to contribute to the collecting of such observational clues.
Acknowledgements.
We owe special thanks to Santino Cassisi, for he provided us with the HB–stars evolutionary tracks and for very useful discussion via e–mail. In order to retrieve the line list necessary to the chemical analysis, we have used the Vienna Atomic Line Data–base. We are greatly indebted to Raffaele Gratton and Damian Fabbian for having made available to us their code for the abundance measurements and for exhaustive explanations. We also thank Patrick Francois for allowing us to use his code for the automatic detection and equivalent width measurement of the lines, even though, due to the faintness of the stars studied, a more interactive approach had to be eventually adopted. Marco Montalto spent time and patience helping one of the authors with a bash script. The paper benefits from the useful comments of the anonymous referee. G.c. P., G.p. P., & Y. M. acknowledge the support of italian MIUR under the programme PRIN 2003. A. R.–B. acknowledges the support of the European Space Agency.References
- Bard & Kock, (1994) Bard, A., & Kock, M. 1994, A&A 282, 1014
- Bedin et al., (2000) Bedin, L., Piotto, G., Zoccali, M., et al. 2000, A&A 363, 159
- Behr, (1999) Behr, B. B., Cohen, J. G., McCarthy, J. K., & Djorgovski, S. G. 1999, ApJ, 517,L31
- (4) Behr, B. B., Cohen, J. G., & McCarthy, J. K. 2000, ApJ 531L, 37
- (5) Behr, B. B., Djorgovski, S. G., Cohen, J. G., et al. 2000, ApJ 528, 849
- (6) Behr, B. B. 2003, ApJSS 149, 67
- (7) Behr, B. B. 2003, ApJSS 149, 101
- Biemont et al., (1999) Biemont, E., Hibbert, A., Godefroid, M., Vaeck, N., & Fawcett, B. C. 1991 ApJ, 375, 818
- Biemont et al., (1999) Biemont, E., Palmeri, P., & Quinet, P. 1999, Astrophys. Space Sci. 269-270, 635
- Caloi, (1999) Caloi, V. 1999, A&A 343, 904
- Carretta & Gratton, (1997) Carretta, E., & Gratton R. G. 1997, A&AS, 121,95
- Cassisi et al., (1999) Cassisi, S., Castellani, V., degl’Innocenti, S., Salaris, M., & Weiss, A. 1999, A&AS 134, 103
- Clement & Hazen, (1989) Clement, C. M., & Hazen, M. L. 1989, AJ 97, 414
- Carretta et al, (2004) Carretta, E., Bragaglia, A., & Cacciari, C. 2004, ApJ 610, L25
- Carretta, (2005) Carretta, E., 2005, [astro-ph/0511144]
- Cayrel, (1988) Cayrel, R. 1988, The impact of very high S/N spectroscopy on stellar physics, ed. G. Cayrel de Strobel & M. Spite (Kluwer Academic Publishers, Dordrecht), IAU Symp. 132, 345
- Castellani & Castellani, (1993) Castellani, M., & Castellani, V. 1993, ApJ 407, 649
- Crowin et al., (2004) Corwin, T. M., Catelan, M., Borissova, J., & Smith, H. A. 2004, A&A 421, 667
- D’Antona et al., (2005) D’Antona, F., Bellazzini, M., Caloi, V. et al. 2005, ApJ 631, 868
- De Angeli, (2005) De Angeli, F., Piotto, G., Cassisi, S., et al. 2005, AJ 130, 116
- Fabbian, (2004) Fabbian, D., 2004, Graduate thesis, Universitá di Padova
- Fabbian et al., (2005) Fabbian, D., Recio–Blanco, A., Gratton, R. G., & Piotto, G. 2005, A&A 434, 235
- Gratton, (1987) Gratton, N. G. 1987, A&A 179, 181
- Greenstein et al., (1967) Greenstein, G. S., Truran, J. W., & Cameron, A. G. W. 1967, Nature 213, 871
- Grevesse & Sauval, (1998) Grevesse, N., & Sauval, A.J. 1998, SSRv 85, 161
- Grundahl et al., (1998) Grundahl, F., van den Berg, D. A., & Andersen, M. I. 1998, ApJ 500, L179
- Grundahl et al., (1999) Grundahl, F., Catelan, M., Landsman, W. B., Stetson, P. B., & Andersen, M. I. 1999, ApJ 524, 242
- Harris, (1974) Harris, W. E. 1974, ApJ 192, L161
- Harris, (1996) Harris, W. E. 1996, AJ 112, 1487 [H96]
- Harris, (2003) Harris, W. E. 2003, revised version of [H96]
- Heise & Kock, (1990) Heise, C., & Kock, M. 1990, A&A 230, 244
- Hoyle & Schwarzschild, (1955) Hoyle, F., & Schwarzschild, M. 1955, ApJS 2, 1
- Hui-Bon-Hoa et al. (2000) Hui-Bon-Hoa, A., LeBlanc, F., & Hauschildt, P. H. 2000, ApJL, 535, L43
- Kraft & Ivans, (2003) Kraft, R. P. & Ivans, I. I. 2003, PASP 115, 143
- Kupka et al., (1999) Kupka, F., Piskunov, N., Ryabchikova, T. A., Stempels, H. C., & Weiss, W. W., 1999, A&AS 138, 119
- Kurucz, (1994) Kurucz, 1994, CD–ROM No 19
- Michaud at al, (1983) Michaud, G., Vauclair, G., & Vauclair, S. 1983, ApJ 267, 256
- Modigliani et al., (2004) Modigliani, A., Mulas, G., Porceddu, I., Dammiani, F., 2004, VLT-MAN-ESO-19500-3016
- Moehler et al., (1995) Moehler, S., Heber, U., & de Boer, K. S. 1995, A&A 294, 65
- Moehler et al., (2000) Moehler, S., Sweigart, A. V., Landsman, W. B., & Heber, U. 2000, A&A 360, 120
- Moehler et al., (2002) Moehler, S., Sweigart, A. V., Landsman, W. B., & Dreizler, S. 2002, A&A 395, 37
- Momany et al., (2002) Momany, Y., Piotto, G., Recio–Blanco, A., et al. 2002, ApJ 576, L65
- Momany et al., (2003) Momany, Y., Cassisi, S., Piotto, G., Bedin, L. R., Ortolani, S., Castelli, F., & Recio-Blanco, A. 2003, A&A, 407, 303
- Momany et al., (2004) Momany, Y., Bedin, L. R., Cassisi, S., et al. 2004, A&A 420, 605
- (45) Paladini, C., Piotto, G., & Recio–Blanco, A., in preparation
- Peterson, (1983) Peterson, R. C., 1983, ApJ, 275, 737
- Piotto et al., (1999) Piotto, G., Zoccali, M., King, I. R., et al., 1999, AJ 118, 1727
- Piotto et al., (2004) Piotto, G., Bedin, L. R., Cassisi, S., et al. 2004, MSAIS 5, 71
- Recio–Blanco et al., (2002) Recio–Blanco, A., Piotto, G., Aparicio, A., & Renzini, A., 2002, ApJ 572, L71
- Recio–Blanco et al., (2004) Recio–Blanco, A., Piotto, G., Aparicio, A., & Renzini, A., 2004, A&A 417, 597
- Recio–Blanco et al., (2005) Recio–Blanco, A., Piotto, G., de Angeli, F., et al., A&A 432, 851
- Rosenberg et al., (1999) Rosenberg, A., Saviane, I., Piotto, G., & Aparicio, A. 1999, AJ 118, 2306
- Sandage & Wallerstein, (1960) Sandage, A., & Wallerstein, G. 1960, ApJ 131, 598
- Sandage & Wildey, (1967) Sandage, A., & Wildey, R. 1967, ApJ 150, 469
- Sills & Pinsonneault, (2000) Sills, A., & Pinsonneault, M. H. 2000, ApJ 540, 489
- Simmons & Blackwell, (1982) Simmons, G. J., & Blackwell, D. E. 1982, A&A 112, 209
- Sosin et al, (1997) Sosin, C., Dorman, B., Djorgovski, S. G., et al. 1997, ApJ 480, L35
- Tolstoy, (1998) Tolstoy, E., Gallagher, J. S., Cole, A. A. 1998, AJ, 116, 1244
- Vink & Cassisi, (2002) Vink, J. S., & Cassisi, S. 2002, A&A 392, 553
- van den Bergh, (1967) van den Bergh, S. 1967, AJ 72, 70