A method to identify the companion stars of type Ia supernovae in young supernova remnants
Abstract
We propose a method to identify the companion stars of type Ia supernovae (SNe Ia) in young supernova remnants (SNRs) by recognizing distinct features of absorption lines due to Fe I appearing in the spectrum. If a sufficient amount of Fe I remains in the ejecta, Fe I atoms moving toward us absorb photons by transitions from the ground state to imprint broad absorption lines exclusively with the blue-shifted components in the spectrum of the companion star. To investigate the time evolution of column depth of Fe I in the ejecta, we have performed hydrodynamical calculations for SNRs expanding into the uniform ambient media, taking into account collisional ionizations, excitations, and photo-ionizations of heavy elements. As a result, it is found that the companion star in Tycho’s SNR will exhibit observable features in absorption lines due to Fe I at nm and 385.9911 nm if a carbon deflagration SN model (Nomoto, Thielemann, & Yokoi, 1984) is taken. However, these features may disappear by taking another model that emits a few times more intense ionizing photons from the shocked outer layers. To further explore the ionization states in the freely expanding ejecta, we need a reliable model to describe the structure of the outer layers.
Subject headings:
general — supernova remnants: individual(Tycho’s SNR (catalog ))1. Introduction
Type Ia supernovae (SNe Ia), characterized by no but strong Si lines in the spectra at the maximum brightness, are brighter than most of SNe classified into the other types and exhibit uniform light curves. Thus they are used as a standard candle to measure distances to remote galaxies.
A plausible explosion model for SNe Ia is the accreting white dwarf (WD) model, in which a white dwarf in a binary system accretes material from the companion star, increases its mass, usually up to the Chandrasekhar mass limit (), and then explodes (e.g., Nomoto, 1982). There have been significant progresses in the accreting WD model since Hachisu, Kato, & Nomoto (1996) introduced the stellar wind from the WD while it accretes materials from the companion. Their model succeeded in sustaining a stable mass transfer in the progenitor systems of SNe Ia. According to their model, there are two main evolutionary paths leading to SNe Ia, the super soft X-ray source (SSS) channel and the symbiotic channel (Hachisu, Kato, & Nomoto, 1996; Hachisu et al., 1999; Hachisu, Kato, & Nomoto, 1999). Accordingly their model predicts which companion stars lead to SNe Ia.
The above evolutionary scenario for SNe Ia has not been confirmed by observations, which will require the identification of the companion star that should remain in the vicinity of the explosion site. Ruiz-Lapuente et al. (2004) argued that their group identified a G2IV star as the companion of Tycho Brahe’s supernova remnant (SNR) by measuring the velocities and distances of stars in the vicinity of the center of the SNR. They concluded that this G2IV star was moving much faster than the other neighbor stars and that the distance to this star seemed consistent with the distance to Tycho’s SNR. Although Fuhrmann (2005) has argued that the observed velocity of Tycho G might correspond to the velocity of stars belonging to the thick disk population, the expected stellar mass in thick disk stars within the cone with 2.87 arcsec radius (which corresponds to the angular distance from the center of Tycho’s SNR to the Tycho G star), at 3 kpc from Earth, is only 2 , which makes the thick disk star alternative very unlikely. For this estimate we use the density in the vicinity of Tycho’s SNR (Dehnen & Binney, 1998).
Although the coincidence of the kinematic characteristics of Tycho G with its being at the position and distance of the SNR appears significant, confirmation by other means would nonetheless be very useful.
In this paper we propose a direct method to prove that the companion star is located inside the SN ejecta. A hint was dropped by observations for a star called S-M star discovered by Schweizer & Middleditch (1980) near a type Ia SNR 1006. Wu et al. (1993) proved that the S-M star was not the companion of this supernova by investigating features of Fe II absorption lines in the ultraviolet (UV) spectrum. Very broad wings were observed in both blue and red sides of the absorption lines. The line width was a few thousand km/s much larger than the thermal velocity of stellar atmosphere, which is thought to be 10 km/s. The broad wings are likely to be formed by Fe II in the ejecta of SNR 1006; photons in the blue wing are absorbed by the matter ejected toward us, and those in the red wing away from us. Thus it was proved that the S-M star is located behind the SNR 1006 ejecta.
When a star is inside the ejecta of SNe Ia, photons emitted from the star are absorbed only by the ejecta moving toward us. Hence the broad wing must be present only in the blue side. The absorption line with only blue wing enables us to identify companion stars of SNe Ia. Wu et al. (1993) used the UV range to observe the S-M star with the Faint Object Spectrograph on the Hubble Space Telescope. However, in addition to difficulties in UV observations from the ground, companion stars on the evolutionary paths suggested by the above mentioned scenario (Hachisu, Kato, & Nomoto, 1996; Hachisu et al., 1999; Hachisu, Kato, & Nomoto, 1999) may not be bright in the UV range. Then we will focus on absorption lines in the visible range. Furthermore the corresponding transitions need to be from the ground state because most Fe ions in the ejecta are expected to be in the ground state. Thus only Fe I can produce such absorption lines in SNe Ia ejecta.
In this paper, we estimate the amount of Fe I in the ejecta of Tycho’s SNR by taking account of collisional processes in non-equilibrium and ionizations by photons emitted from the shocked ejecta, and calculate spectra of a star located at the center of a SNR and discuss whether we can identify the feature of Fe I absorption lines in the spectrum of the companion star.
| Density of | Fe I | Fe II | Fe III | Fe IV | Fe V |
|---|---|---|---|---|---|
| ambient medium | () | () | () | () | () |
| 1.0 cm-3 | 1.2 | 6.0 | 9.5 | 22 | 18 |
| 0.41 cm-3 | 8.9 | 28 | 16 | 8.4 | 1.9 |
2. Formulations
2.1. Hydrodynamical Model
We calculate the hydrodynamical evolution of a spherically symmetric SN Ia embedded in the ambient medium with a uniform density. The initial structure of freely expanding SN Ia ejecta is taken from W7 in Nomoto, Thielemann, & Yokoi (1984). The mass of the WD at the time of the SN explosion is 1.37 . Our model simplifies the original distribution of elements in W7. That is, the ejecta consist of three layers with different compositions; the innermost layer is consists of pure Fe with the mass of 0.95 , the middle layer consists of 0.15 Si, and the outermost 0.27 C/O . The mass fraction of oxygen in this layer is 50 %. The initial kinetic energy is ergs. The density of the ambient medium is assumed to be 0.41 (Hamilton & Fesen, 1988) or 1.0 (Itoh, Masai, & Nomoto, 1988). These two values refer to two different models of Tycho’s SNR.
To obtain the time evolution of physical states in the ejecta, we solve hydrodynamical equations with the Lagrangian coordinate
| (1) | |||||
where is the specific volume, the velocity, the total energy density per unit mass, the Lagrangian mass coordinate. The internal energy , the mass density , and the pressure are derived from the conserved quantities via
where is the ratio of specific heats and assumed to be for simplicity. Here we have ignored the radiative cooling, because the associated time-scale is significantly longer than the expansion time-scale of a young SNR like Tycho’s SNR (e.g., Sorokina et al., 2004). We numerically integrate the above equations (1) with the PPM (Colella & Woodward, 1984).
2.2. Two Temperature Approximation
for Shocked Plasma
In the shocked ejecta, electrons and ions are not immediately relaxed to an equilibrium state because of their different masses and low densities. Two temperature approximation is used to describe this relaxation process. The time scale for the electron temperature to catch up with the ion temperature is estimated by Spizer (1978). The time scale , which is of the order of years, is longer than the age of Tycho’s SNR. Then we must calculate the electron temperature by solving the equation
| (2) |
2.3. Collisional Processes in the Shocked Region
In the shocked region, the electron temperature becomes higher than K. Thus collisional excitations and ionizations are activated and dominated. To obtain the population of an element in the ionization stage , we solve rate equations written as
| (3) |
where denotes the rate of ionizations out of the th ion stage. The collisional ionization cross section is calculated using the formula introduced in Lotz (1967). The excitation-autoionization (E-A) is taken into account for ions such as Fe3+, Fe4+, Fe10+, Fe11+, Fe12+, Fe13+, Fe14+, Fe15+, Fe23+, Si3+, Si11+, O5+, and C3+ (Arnaud & Rothenflug, 1985). On the other hand, we can ignore recombination rates in the above equations, because the recombination time scale becomes of the order of years much longer than the age of Tycho’s SNR.
Instead of taking into account photo-ionizations in front of the shock, atoms immediately after the shock front in the ejecta are assumed to be automatically ionized to Fe10+, Si7+, O5+, C4+ to account for the detection of Si XIII and Fe XVII lines by the XMM-Newton (Decourchelle et al., 2001). This assumption has been made by Itoh, Masai, & Nomoto (1988). The photo-ionization process is taken into account as a post-process to reduce the computational time.
2.4. Photon Emission
A lot of high energy photons are emitted from ions of Si, Fe, O, and C in the shocked ejecta (Hamilton & Fesen, 1988; Vink et al., 2003). These photons ionize the matter in the pre-shocked ejecta. The number of ionizing photons emitted from ions per unit volume per unit solid angle per unit time is
| (4) |
where is the number density of ions , and is the collisional excitation coefficient for the corresponding transition (Kato, 1976).
2.5. Radiative Transfer
With the source term for ionizing photons discussed in the preceding subsection, we solve the radiative transfer equation for ionizing photons to estimate the ionization states of Fe, Si, O, and C in the pre-shocked ejecta. The intensity of ionizing photons is obtained by solving the transfer equation,
| (5) |
where denotes the distance from the center, the angle between the direction of incident photons and the radial direction, , is the photo-ionization cross section of Fe, Si, O, or C (Verner et al., 1996), and ’el, ’ represents times ionized element el. This equation is integrated along the characteristics to obtain in the freely expanding ejecta as described in textbooks (e.g., Mihalas, 1978). This equation is solved after the optical depth becomes smaller than .
2.6. Ion Fraction
The number of photons incident from all directions per unit time is obtained by integrating the intensity with respect to angle. If the corresponding value for photons that can ionize ions is denoted by , then the ion fraction of element in the th ionization stage evolves with time according to the following equations,
| (6) | |||||
where is the cross section for photo-ionizing th ions of an element and is the collisional ionization rate.
3. Results
3.1. X-ray Surface Brightness
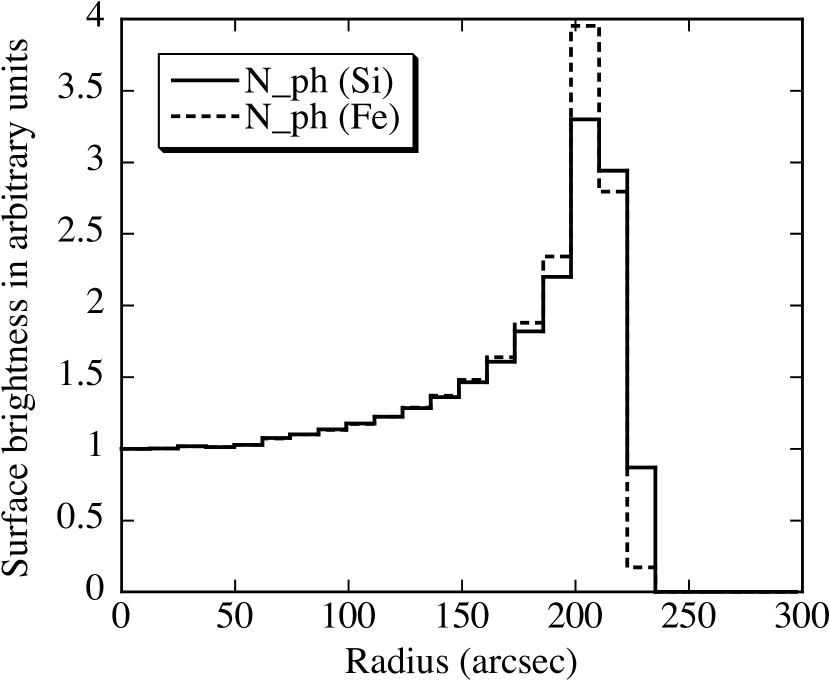
Comparing the calculated X-ray surface brightness profile with that observed for Tycho’s SNR (e.g., Decourchelle et al., 2001), one can constrain the density in the ambient medium. Figure 1 shows the calculated X-ray surface brightness of Si XIII triplet blend (in the range of eV) and Fe XVII line (at ) emitted from a SNR model with cm-3 located at a distance of 2.43 kpc from the earth. The plotted profile has been smoothed by a Gaussian filter of radius 5′′ and binned to a 12.4′′ interval to mimic the observation. The observed radius of the peak is reproduced quite well by this model, while the contrast between the peak brightness and the central brightness is slightly more pronounced in the model. This might be due to a deviation from spherical symmetry in Tycho’s SNR, which will lower the peak brightness when plotted assuming spherical symmetry.
3.2. Column densities of Fe ions
The column densities of Fe ions thus obtained for SNRs at the age of Tycho’s SNR are listed in Table 1.
Comparing with those of Hamilton & Fesen (1988), our results show that ions tend to populate in lower ionization stages in all calculations. There seem to be two differences in these two calculations. The main difference is in the treatment of carbon ions as a source of ionizing photons. Hamilton & Fesen (1988) replaces carbon with oxygen in calculating the number of ionizing photons, while we do calculate the number of ionizing photons from carbon ions. The other is a difference in hydrodynamical models. We use the W7 model, but they use the CDTG7 model constructed by Woosley & Weaver (1986). Because the CDTG7 model has a less centrally condensed density profile, photo-ionizing emission from the outer layers are more intense than in the W7 model. Both of these two differences enhance photo-ionizations in Hamilton & Fesen (1988) as compared with our calculation.
4. Spectra of the Companions
4.1. Radiative Transfer
Some photons emitted in the visible band from the companion star are absorbed by Fe I in the expanding ejecta. Suppose the companion star emits photons with the frequency toward an observer. These photons are absorbed by Fe I moving with the velocity , when
| (7) |
is satisfied as long as is much smaller than the speed of light . Here denotes the frequency of Fe I absorption line in the co-moving frame. Thus the absorbed photons must have a frequency higher than .
The optical depth of the pre-shocked ejecta for photons with the frequency is given by
| (8) |
Here the radius of the inner shock front is denoted by . This integration can be transformed into the integration with respect to frequency as
where denotes the photon frequency in the co-moving frame, i.e., , the absorption cross section, and the number density of Fe I.
Since the velocity of the ejecta (about several thousand km/s) is much larger than the velocity of the thermal motion of particles in the pre-shocked ejecta (less than a ten km/s), applying the Sobolev approximation to the integration above yields,
| (9) |
Here the density and the derivative are evaluated at the point where is satisfied.
We investigate the transfer of photons in the U band absorbed by four transitions of Fe I listed in Table 2.
Though we have assumed that the distribution of Fe is a function of the distance from the center, Fe may be distributed in blobs. We will briefly discuss how these blobs affect the absorption lines discussed in this section. Suppose Fe is distributed in identical blobs with spherical shapes. These blobs fill a fraction of the entire volume of the ejecta. Then the column depth of Fe is reduced when
| (10) |
is satisfied. Otherwise the column depth will not be changed but the shape of the absorption lines will be changed depending on where blobs on the line of sight are located in the ejecta. A 3-dimensional modeling of SNe Ia (Reinecke et al., 2002) demonstrated that a larger number () of bubbles is preferred to accommodate the observed amount of 56Ni (Fe) and explosion energy. Thus a large expected from this 3-dimensional modeling is unlikely to reduce the column depth.
Clumpiness in the ejecta was suggested by recent observations for SN 2004dt (Wang et al., 2004). Spectropolarimetry of this supernova more than a week before its optical maximum reveals that the Si layer is substantially deformed from spherical symmetry while the same observation shows little polarization signature in O lines. Since Si is not a major source of ionizing photons, the influence to the Fe I lines is insignificant. From the theoretical point of view, however, the clumpy distribution of Fe I can not be ignored (e.g. Reinecke et al., 2002). Then we will calculate the spectra from a clumpy distribution of Fe I in the next section though the distribution is rather artificial. To mimic clumpy structures especially in the inner region of the ejecta expected from results of 3-D calculations, the density of the innermost ejecta with velocity 2,000 km/s is reduced by a factor of two and the reduced mass is added to the adjacent outer zones with the velocity range of 2,000-3,000 km/s by increasing the densities thereof by a constant factor. Here we assume that the ion fractions are not affected by the clumpiness.
4.2. Spectra
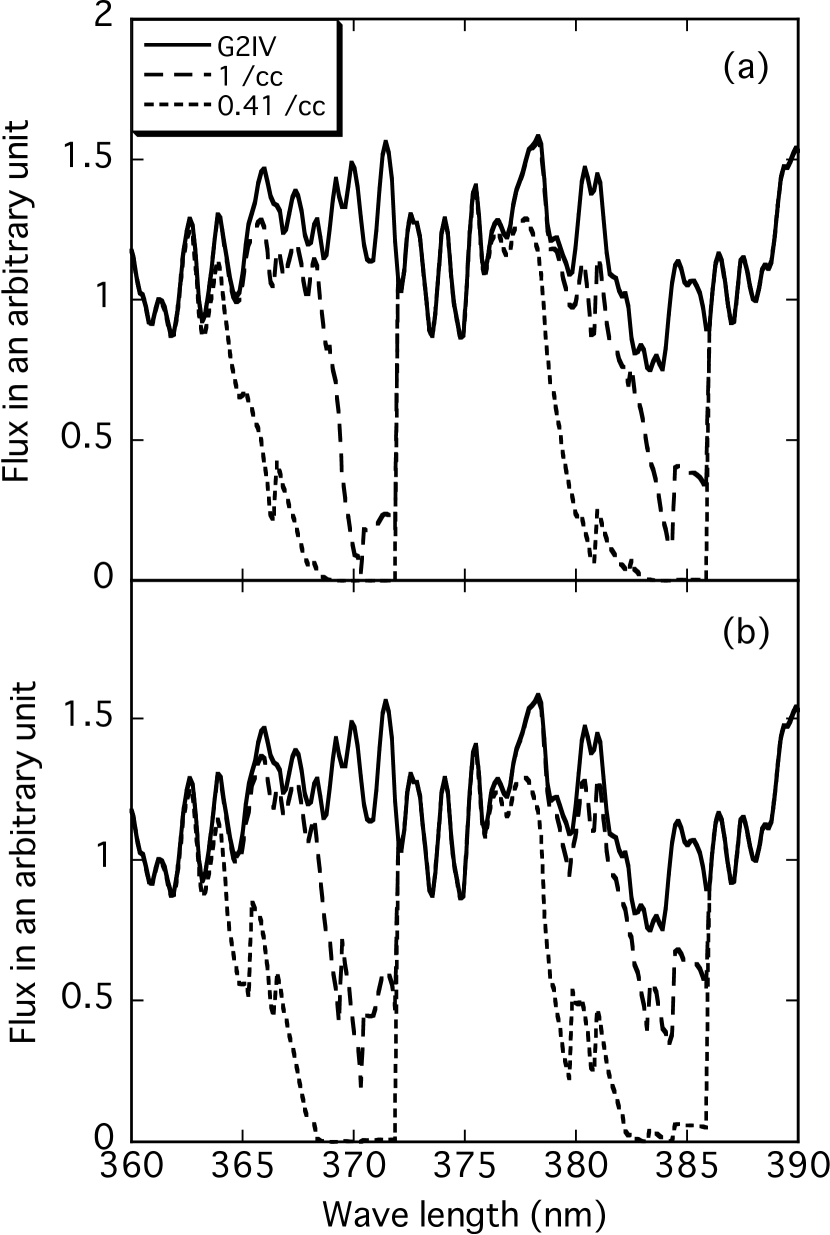
The spectra of a G2IV star located at the center of SNRs embedded in the ambient media with two different densities are calculated and shown in Figure 2 (a). This star has the same spectral type as the candidate star Ruiz-Lapuente et al. (2004) found.
Figure 2(b) shows the spectra of the same star in the ejecta in which the distribution of Fe I is affected by the clumping discussed in the previous subsection. It is clear that the clumpy distribution of Fe I changes the shapes of absorption lines: the lower velocity components of the lines are weaken because of the reduced density in the corresponding layers while the addition of mass to the outer layer hardly affects the line shape because a substantial amount of Fe is already ionized there. The equivalent width of each line exhibited in Figure 2 (a) is listed in Table 2. This particular clumpiness in Fe I distribution reduces the equivalent width by about 30 %. The spectra exhibit strong blue wings both for tenuous and dense ambient media. Results of our calculations indicate that Tycho’s SNR has a sufficient amount of Fe I to identify the companion, even though a companion star as late as G2 has a very complicated spectrum with many absorption features.
| Fe I Line | Equivalent widths | ||
|---|---|---|---|
| Wave Length | (nm) | ||
| (nm) | 1.0 cm-3 | 0.41 cm-3 | |
| 367.9913 | 0.363 | 1.95 | |
| 371.9935 | 2.51 | 4.88 | |
| 382.4444 | 0.633 | 2.86 | |
| 385.9911 | 1.94 | 4.59 | |
Even when we find a star that exhibits the absorption feature discussed in this paper, there is a chance that a star other than the companion star happens to be inside the ejecta. A star existing in the vicinity of a SN Ia gets a fraction of the explosion energy and is accelerated. If the companion star similar to Tycho G star with the mass of 1.2 and the radius of 2 is located at the distance of 5.5 from the progenitor, the size of the Roche lobe is comparable to the size of the companion. Thus the star in this situation will get the maximum velocity after the explosion. Then the orbital velocity before the explosion is km/s. In a 3-D hydrodynamical simulation of SNe Ia by Marietta, Burrows, & Fryxell (2000), they obtain a plausible kick velocity km/s. Therefore, including the orbital velocity, the velocity of the companion star becomes km/s. If the companion star has been moving away from the explosion site at that speed, the companion star is now at the distance of 0.08 pc from the center. The stellar mass density in the neighborhood of Tycho’s SNR estimated from a model of the Galaxy (Dehnen & Binney, 1998) is less than 0.03 . Thus the expected stellar mass inside this volume is only . Therefore if we find a star showing absorption lines with broad blue wings in the spectrum, it is likely that the star is the companion star.
5. Conclusions and Discussions
As a consequence, we have demonstrated that there exhibit very deep absorption lines with unique shapes in the spectrum of the companion star located at the center of a young SNR such as Tycho’s SNR. There are, however, a few factors that might reduce or even erase these distinct absorption features.
First, the number of Fe I in the freely expanding ejecta is very sensitive to the number of ionizing photons emitted from the shocked ejecta. An increase in the number of ionizing photons by a few factors might decrease the number of Fe I by a few orders of magnitude or more. Since the main source of ionizing photons is O in the outer ejecta, the distributions of O and density in the outer ejecta need to be known precisely. Unfortunately, these regions in W7 have some problems to reproduce the observed optical spectra (Branch, 1998, and references therein). Due to this uncertainty in the explosion model, it is not conclusive if the companion star of Tycho’s SN will exhibit unique Fe I absorption features discussed in this paper. Nevertheless, it is true that every SN Ia has a period during which the companion star has the distinct absorption features discussed above because the ejecta become cool enough to have plenty of Fe I for a time after the optical brightening.
Second, it is assumed in our calculations that ions in the shocked region are ionized to Fe10+, Si7+, O5+, C4+ immediately after the shock passes following the procedure taken by Itoh, Masai, & Nomoto (1988). Since ions in lower ionization stages are a strong source of ionizing photons, ionization may be more advanced in real young SNRs.
References
- Arnaud & Rothenflug (1985) Arnaud, M. Rothenflug, R. 1985, A&AS, 60, 425
- Branch (1998) Branch, D. 1998, ARA&A, 36, 17
- Colella & Woodward (1984) Colella, P., Woodward, P. 1984, JCoPh, 54, 174
- Decourchelle et al. (2001) Decourchelle, A., et al. 2001, A&AS, 365, L218
- Dehnen & Binney (1998) Dehnen, W., Binney, J., 1998, MNRAS, 294, 429
- Engstrom et al. (1992) Engstrom, L., et al. 1992, JphB, 25, 2459
- Fuhrmann (2005) Fuhrmann, K. 2005, MNRAS, 359, L35
- Hachisu, Kato, & Nomoto (1996) Hachisu, I., Kato, M., Nomoto, K. 1996, ApJ, 470, L97
- Hachisu et al. (1999) Hachisu, I., Kato, M., Nomoto, K., Umeda, H. 1999, ApJ, 519, 314
- Hachisu, Kato, & Nomoto (1999) Hachisu, I., Kato, M., Nomoto, K. 1999, ApJ, 522, 487
- Hamilton & Sarazin (1984) Hamilton, A., Sarazin, C. 1984, ApJ, 287, 282
- Hamilton & Fesen (1988) Hamilton, A., Fesen, R. 1988, ApJ, 327, 178
- Itoh, Masai, & Nomoto (1988) Itoh, H., Masai, K., Nomoto, K. 1988, ApJ, 334, 279
- Kato (1976) Kato, T. 1976, ApJS, 30, 397
- Reinecke et al. (2002) Reinecke, M., Hillebrandt, W., & Niemeyer, J. C. 2002, A&A, 391, 1167
- Lotz (1967) Lotz, W. 1967, ApJS, 14, 207L
- Marietta, Burrows, & Fryxell (2000) Marietta, E., Burrows, A., Fryxell, B. 2000, ApJS, 128, 615
- Mihalas (1978) Mihalas, D., 1978, Stellar Atmospheres.
- Nomoto (1982) Nomoto, K. 1982, ApJ, 253, 798
- Nomoto, Thielemann, & Yokoi (1984) Nomoto, K, Thielemann, F., Yokoi, K. 1984, ApJ, 286, 644
- Ruiz-Lapuente et al. (2004) Ruiz-Lapuente, P., et al. 2004, nature, 431, 1069
- Schweizer & Middleditch (1980) Schweizer, F. Middleditch, J. 1980, ApJ, 241, 1039
- Sorokina et al. (2004) Sorokina, E. I., et al. 2004, AstL, 30, 737
- Spizer (1978) Spitzer, L. 1978, Physical Processes in the Interstellar Medium.
- Tunklev (1997) Tunklev, M., et al. 1997, PhyS, 55, 707
- Verner et al. (1996) Verner, D., et al. 1996, ApJ, 465, 487
- Vink et al. (2003) Vink, J., et al. 2003, ApJL, 587, L31
- Wang et al. (2004) Wang, L., Baade, D., Höflich, P., Wheeler, J. C., Kawabata, K., & Nomoto, K. 2004, ApJ, 604, L53
- Woosley & Weaver (1986) Woosley, S. E., & Weaver, T. A. 1986, Lecture Notes in Physics, Berlin Springer Verlag, 255, 91
- Wu et al. (1993) Wu, C., et al. 1993, ApJ, 416, 247