Discovery of Ly Pumped Molecular Hydrogen Emission in the Planetary Nebulae NGC 6853 and NGC 3132
Abstract
We report the first observation of Ly pumped molecular hydrogen emission lines in planetary nebulae. The H2 emission observed in the ultraviolet spectra of NGC 6853 and NGC 3132 can be explained by excitation of vibrationally hot H2 by Ly photons. Constraints are placed on the nebular Ly emission profile, as well as the molecular hydrogen temperature, column density and turbulent motion. These parameters are similar for the two nebulae, pointing to similar physical conditions in these objects. The ro-vibrational cascade following Ly pumping is predicted to have low surface brightness signatures in the visible and near infrared.
Subject headings:
ISM:molecules — planetary nebulae:individual (NGC 6853, NGC 3132) — ultraviolet:ISM1. INTRODUCTION
Molecular hydrogen emission is often seen in the infrared (IR) observations of photodissociation regions within planetary nebulae (PNe) (Zuckerman & Gatley, 1988; Kastner et al., 1996). Continuum pumped ultraviolet (UV) fluorescence, as observed in reflection nebulae and star forming regions (Witt et al., 1989; France & McCandliss, 2005), has not been detected in PNe. The observed IR quadrupole emission originates in elevated ro-vibrational levels of the ground electronic state . The distribution of molecules in these levels is characteristic of either shock heating (Zuckerman & Gatley, 1988) or radiative cascade from excited electronic states (Hayashi et al., 1985; Gatley et al., 1987). UV fluorescence can result in the dissociation of the molecule 10 – 15 of the time (Stecher & Williams, 1967), or a non-thermal population in the excited ro-vibrational levels of . Shocks, with specific temperatures of 2000 K, can thermally populate higher ro-vibrational states, resulting in IR transitions without the far-UV cascade (Takami et al., 2000). Detection of the UV fluorescence in conjunction with models of the infrared to ultraviolet scaling of H2 emission can constrain the contribution of each mechanism to the IR flux. The line pumped H2 UV fluorescence described in this paper is consistent with measured IR line ratios and gas temperatures that favor the shock excitation scenario (Zuckerman & Gatley, 1988; Storey, 1984). As shown in § 4.1, this type of UV emission, unlike continuum pumped fluorescence, has little effect on the observed IR spectrum. Weak specific features are expected in the optical.
At typical diffuse ISM temperatures below 100 K (Rachford et al., 2002), only H2 molecules in the v″ = 0 level of make a significant contribution to the UV fluorescence. These molecules are excited by 912 1110 Å radiation into vibrational and rotational levels of higher electronic states (mainly and , Black & van Dishoeck 1987). As the temperature increases, higher ro-vibrational levels of become populated, and the threshold for fluorescent pumping moves to progressively larger wavelengths. Due to the long lifetime of the levels, the molecules can be further pumped to or by a sufficiently strong radiation field before they have time to radiate. This mechanism is predicted to be important for nebular gas densities in the range from 10 n 106 cm-3 and a radiation field (in units of the interstellar average) of 10 G 104 (Sternberg, 1989).
We have found that in both NGC 6853 (M27, The Dumbbell Nebula) and NGC 3132 H2 UV fluorescence is dominated by lines pumped by nebular Ly from the excited v″ = 2 level of to the states. Molecular hydrogen resonance fluorescence with Ly has been previously recognized as an important contributor to the UV flux in collisional environments of photodissociation regions. This effect was first pointed out by Shull (1978), and discussed further by Black & van Dishoeck (1987). Ly pumping was predicted to be significant mainly for T Tauri stars and Herbig-Haro objects, as has been subsequently observed (Brown et al., 1981; Schwartz, 1983; Raymond et al., 1997; Herczeg et al., 2004). Other environments in which Ly pumping was detected include solar system objects (Wolven et al., 1997; Jordan et al., 1977) and accreting systems (Gizis et al., 2005; Wood et al., 2002). In this paper we present for the first time evidence for resonant excitation by Ly of the (1 – 2) P(5) 1216.07 Å and (1 – 2) R(6) 1215.73 Å molecular hydrogen lines in planetray nebulae. The observed resonances and line ratios are a valuable diagnostic tool for molecular gas temperature, Ly line shape, and Doppler shift relative to the H2 absorber.
The first object, NGC 6853, is a 12,700 year old planetray nebula (O’Dell et al., 2002) at a distance of 417 50 pc (Benedict et al., 2003). Its central star has a temperature 108,600 6800 K (Benedict et al., 2003). The distance to NGC 3132 is not well known, varying from 1.63 kpc (Torres-Peimbert & Peimbert, 1977) to 0.51 kpc (Pottasch, 1996), while the temperature of the ionizing star is estimated at 110,000 K (Pottasch, 1996). The extinction, as measured by in this case, is of the order of 0.1 for the central star in both cases (Benedict et al., 2003; Pottasch, 1996). However, McCandliss et al. (2006) argue that in the case of NGC 6853 the extinction is negligible. In both cases, the detected Ly pumped H2 fluorescence requires a temperature of 2000 K and column densities of 1018 cm-2, as well as a Ly profile of 0.4 Å width, with a deep self-reversal. These parameters satisfy both short and long wavelength constraints, pointing to similar conditions of the molecular gas in the two nebulae.
A description of the observations and data is found in Section 2. Data analysis follows in Section 3, and a discussion of the results in Section 4.
| Instrument | Program | Date | RA | Dec | Exp. Time (s) |
|---|---|---|---|---|---|
| FUSE - LWRS | E12001 | 2004-05-26 | 19 59 44.96 | +22 44 50.1 | 4176.0 |
| FUSE - LWRS | E12002 | 2004-05-26 | 19 59 38.93 | +22 44 04.0 | 3071.0 |
| FUSE - LWRS | E12003 | 2004-05-26 | 19 59 32.35 | +22 42 35.1 | 2778.0 |
| FUSE - LWRS | E12004 | 2004-05-26 | 19 59 27.27 | +22 42 10.3 | 3470.0 |
2. OBSERVATIONS
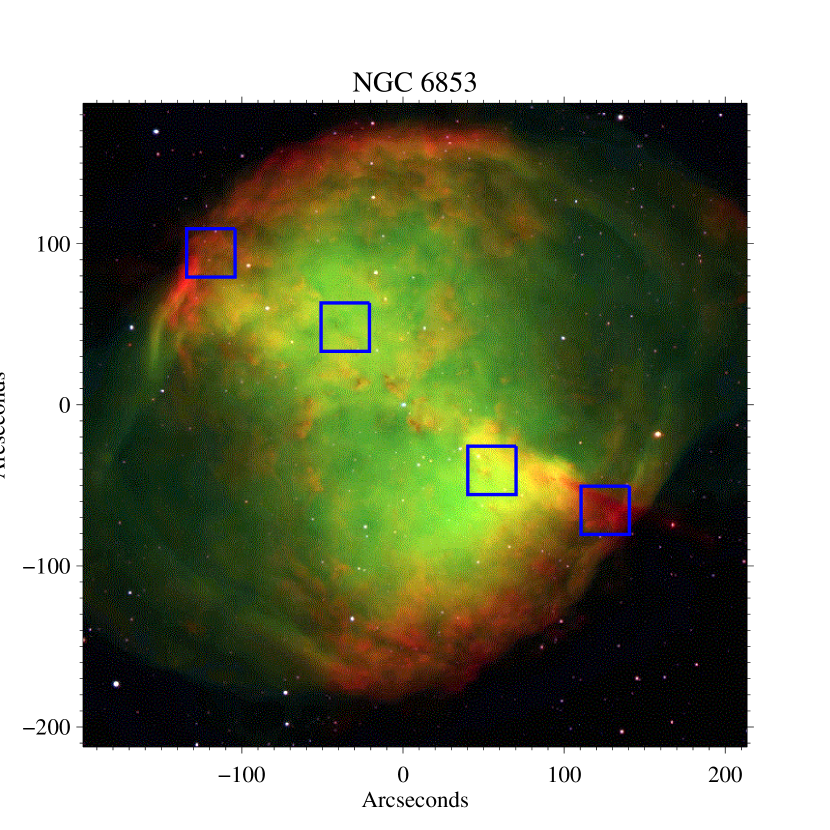
Four nebular observations of NGC 6853 were made by on 2004 May 26 using the low-resolution (LWRS) aperture (30″30″; Figure 1). Spectra were obtained in the 905 – 1187 Å bandpass at a filled aperture resolution of 0.33 Å. A description of the satellite can be found in Moos et al. (2000) and on-orbit performance characteristics are described by Sahnow et al. (2000). The data were acquired as part of the E120 guest observing program. The pointings extend along the bright bar structure of the nebula, from the northeast to the southwest (Figure 1). Data for all four pointings were obtained in “time-tagged” (TTAG) mode, and processed using the CALFUSE pipeline, version 2.4.2. The average exposure time was 3374 seconds. The log of the observations of NGC 6853 is presented in Table 1.
We obtained optical spectra of NGC 6853 on 1999 June 9 using the Double Imaging Spectrograph (DIS) on the Apache Point 3.5m telescope. The observations were taken with the low-resolution gratings, centered at 8000 Å and 4224 Å with a dispersion of 7.0 Å pixel-1 in the red side and 6.1 Å pixel-1 in the blue side, and a resolution of roughly 2 pixels. The 300″09 slit was centered at (19h 59m 36s.20, 22° 43′ 01″.00), and oriented along the bright bar. Three slit positions (about 27 total width) were averaged during the 900 s integration. The observed mean H brightness along the slit was about 4.68 10-3 ergs cm-2 s-1 sr-1, or 19416 R (conversion factor 632 (Å) ).
NGC 3132 was observed by HUT aboard for 946 seconds during orbital night on 1995 March 14. This spectrum, downloaded from the Multi-Mission Archive at the Space Telescope Science Institute (MAST), was acquired through the 10″56″ slit, enclosing a large region of the 28″ nebula, at an offset from the central stars. The exact slit coordinates are uncertain. The resolution of the HUT spectrum is roughly 3 Å. A description of the HUT instrument and data reduction can be found in Kruk et al. (1995). The signature of H2 emission is present in the spectrum of NGC 3132 (D1200401), but at a considerably lower signal-to-noise ratio. We chose to analyze the HUT spectrum because it allowes us to extend our study to longer wavelengths.
3. DATA ANALYSIS
3.1. NGC 6853
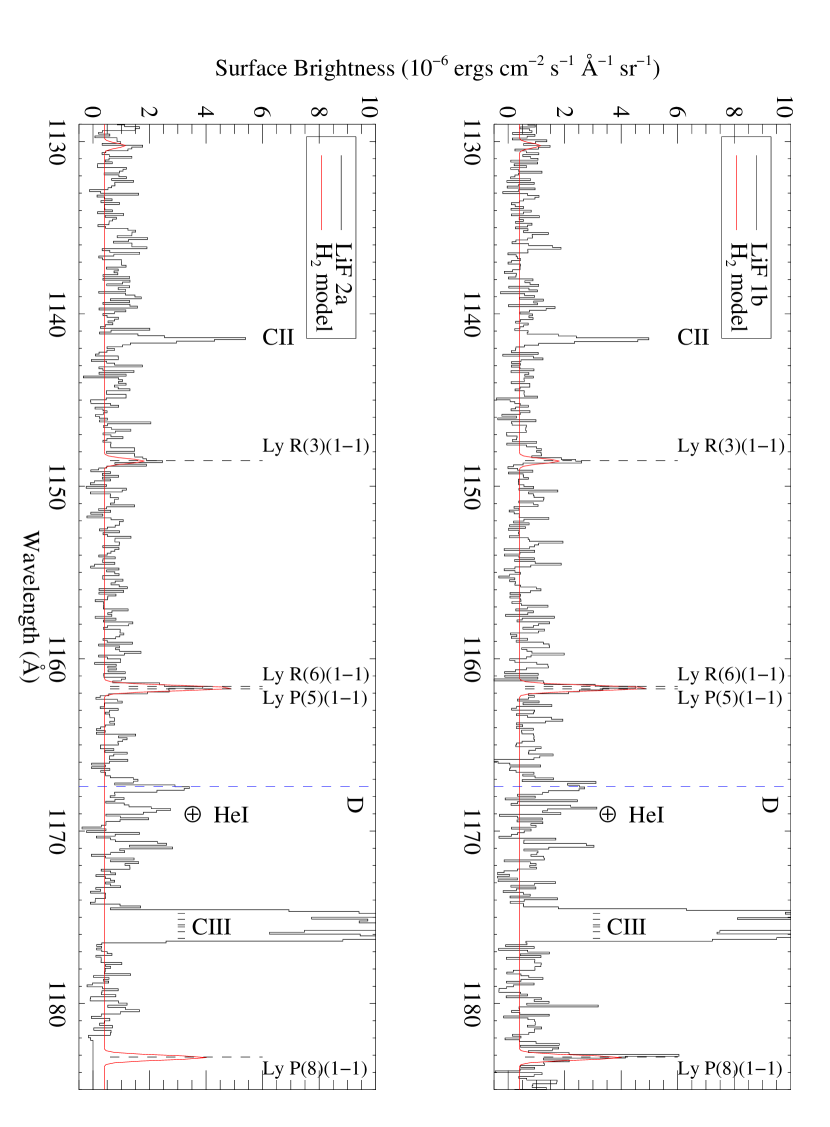
The spectra of NGC 6853 – Position 3 are presented in Figure 2 and Figure 3. The emission from the nebula is dominated by He II, C II, C III and molecular hydrogen lines. The strongest lines observed in all four pointings are summarized in Tables 2-5. The lines denoted by letters are unidentified. Feature is possibly nebular O III (962.425 Å) at a slight velocity offset. The strengths of the lines in the spectrum changes with the pointing. The highly ionized species dominate in the central regions and decline towards the outer shell. Molecular hydrogen lines are present in all four pointings, and are strongest in the third pointing, which coincides with the brightest optical feature.

| Line ID | FWHM | Brightness | |
|---|---|---|---|
| (Å) | (Å) | (10-6 ergs cm-2 s-1 sr-1) | |
| C II | 946.01 | 0.56 | 1.83 0.29 |
| He II | 958.52 | 0.53 | 0.35 0.28 |
| N III + He II | 991.52 | 0.21 | 1.91 0.39 |
| C II | 1036.88 | 0.33 | 1.37 0.22 |
| N II + He II | 1085.50 | 0.34 | 25.75 1.03 |
| C II | 1141.53 | 0.26 | 0.36 0.13 |
| H2(1–1)R(3) | 1148.59 | 0.43 | 0.40 0.14 |
| H2(1–1)P(5) + R(6) | 1161.76 | 0.32 | 0.71 0.16 |
| C III | 1175.53 | 0.48 | 1.97 0.23 |
| H2(1–1)P(8) | 1183.06 | 0.21 | 0.92 0.32 |
Note. — The C III line at 977.03 Å is not listed due to contamination from scattered solar light in the SiC channels.
| Line ID | FWHM | Brightness | |
|---|---|---|---|
| (Å) | (Å) | (10-6 ergs cm-2 s-1 sr-1) | |
| He II | 933.35 | 0.26 | 1.57 0.43 |
| He II | 937.24 | 0.21 | 0.78 0.37 |
| He II | 942.43 | 0.29 | 6.15 0.50 |
| C II | 946.02 | 0.46 | 5.16 0.48 |
| He II | 949.24 | 0.43 | 2.83 0.38 |
| He II | 958.59 | 0.29 | 12.37 0.61 |
| Un-ID (A) | 962.31 | 0.27 | 4.24 0.48 |
| N III + He II | 992.30 | 0.31 | 48.83 1.28 |
| S III | 1015.48 | 0.89 | 1.65 1.08 |
| S III | 1021.32 | 0.68 | 0.72 0.25 |
| C II | 1036.90 | 0.42 | 3.59 0.34 |
| Un-ID (B) | 1062.62 | 0.44 | 0.31 0.28 |
| Un-ID (C) | 1065.84 | 0.47 | 0.98 0.27 |
| N II + He II | 1084.79 | 0.32 | 130.94 2.46 |
| C II | 1141.51 | 0.37 | 1.26 0.23 |
| H2(1–1)R(3) | 1148.63 | 0.23 | 0.62 0.23 |
| H2(1–1)P(5) + R(6) | 1161.75 | 0.40 | 1.62 0.23 |
| Un-ID (D) | 1167.30 | 0.51 | 1.24 0.27 |
| C III | 1175.53 | 1.02 | 45.55 0.78 |
| H2(1–1)P(8) | 1183.26 | 0.35 | 2.01 0.51 |
| Line ID | FWHM | Brightness | |
|---|---|---|---|
| (Å) | (Å) | (10-6 ergs cm-2 s-1 sr-1) | |
| He II | 933.40 | 0.54 | 1.21 0.36 |
| He II | 937.30 | 0.26 | 0.91 0.34 |
| He II | 942.46 | 0.30 | 3.63 0.44 |
| C II | 946.03 | 0.39 | 4.75 0.44 |
| He II | 949.30 | 0.22 | 2.06 0.33 |
| He II | 958.63 | 0.29 | 8.86 0.54 |
| Un-ID (A) | 962.35 | 0.27 | 3.69 0.45 |
| N III + He II | 992.34 | 0.32 | 30.27 1.02 |
| S III | 1015.42 | 0.81 | 1.20 0.32 |
| S III | 1021.16 | 0.52 | 0.57 0.20 |
| C II | 1036.81 | 0.33 | 2.37 0.29 |
| Un-ID (B) | 1062.34 | 0.31 | 0.20 0.25 |
| Un-ID (C) | 1065.79 | 0.30 | 1.40 0.26 |
| N II + He II | 1084.82 | 0.34 | 95.18 2.18 |
| C II | 1141.48 | 0.31 | 1.50 0.22 |
| H2(1–1)R(3) | 1148.48 | 0.42 | 0.68 0.23 |
| H2(1–1)P(5) + R(6) | 1161.70 | 0.42 | 1.33 0.22 |
| Un-ID (D) | 1167.44 | 0.50 | 1.65 0.26 |
| C III | 1175.48 | 1.07 | 28.33 0.65 |
| H2(1–1)P(8) | 1183.05 | 0.26 | 3.17 0.49 |
| Line ID | FWHM | Brightness | |
|---|---|---|---|
| (Å) | (Å) | (10-6 ergs cm-2 s-1 sr-1) | |
| C II | 946.05 | 0.38 | 1.22 0.30 |
| He II | 958.59 | 0.24 | 0.34 0.32 |
| N III + He II | 991.63 | 0.32 | 1.56 0.42 |
| C II | 1037.75 | 0.42 | 0.56 0.22 |
| N II + He II | 1085.54 | 0.34 | 18.76 0.97 |
| C II | 1141.52 | 0.25 | 0.21 0.14 |
| H2(1–1)R(3) | 1148.50 | 0.27 | 0.12 0.14 |
| H2(1–1)P(5) + R(6) | 1161.73 | 0.21 | 0.66 0.17 |
| C III | 1175.56 | 0.29 | 1.29 0.23 |
| H2(1–1)P(8) | 1183.18 | 0.31 | 1.49 0.34 |
We explored the possibility that line-pumped H2 fluorescence is responsible for some of the unidentified lines we observe, computing models with a variety of nebular emission lines as the excitation source. Atomic emission lines of H I Ly-, Ly-, and Ly-; He II 1215, 1085, 1025, 992, and 959; C II 1334/35 and 1036/37; the C III 1175 multiplet and C III 977; N I 1200; the N II 1085 multiplet; the N III 990 multiplet; and the O VI resonance doublet 1032/38 were all considered as possible H2 excitation mechanisms. None of the strongest predicted fluorescent emission lines are observed.
The strongest H2 lines observed are excited by the (1 – 2) P(5) transition at 1216.07 Å in the red wing of Ly. Their wavelengths and branching ratios are listed in Table 6. These transitions are sensitive to the Ly line width and Doppler shift. Although the closest resonance is (1 – 2) R(6) at 1215.73 Å, Lyman-system fluorescence from v′ = 1, J′ = 7 is far weaker than expected. This can be achieved with a deep self-reversal of the Ly profile combined with a blueshifting of the molecular hydrogen lines with respect to the systemic Ly emission. The bueshift is necessary to restore to some extent the intensities of the lines pumped by the (1 – 2) R(6) resonance, which otherwise would fall in the center of the absorption trough (Figure 4).

NGC 6853, as well as NGC 3132, was modeled using a fluorescent H2 emission code similar to the one described in France et al. (2005). The exciting radiation field was assumed to be a Gaussian Ly emission line, with a FWHM of 0.4 Å. In order to mimic self-reversal, absorption by neutral hydrogen with a column density of 1 1014 cm-2 was used to modify the exciting Ly profile (Figure 4). As the nebular Ly line cannot be measured directly due to the opacity of the ISM and contamination from geocoroanal Ly, a total brightness was chosen as 2/3 of the H brightness of 19416.0 R measured using the DIS at APO (see § 2). According to the selection rules, 2/3 of the time the H transitions will result in an atom in the 2 state, which can then radiate a Ly photon during the 2 – 1 transition. The other 1/3 of the time, the hydrogen atom will be left in the 2 state, unable to emit a Ly photon since a direct transition from this state to 1 is forbidden in the dipole approximation (Spitzer, 1978). The total Ly brightness could be higher than derived from H measurements, due to H2 dissociation mechanisms that produce H I in the 2 state (Glass-Maujean, 1986). The continuum flux from the central star of NGC 6853 has not been included because continuum pumped emission lines are not detected in the nebular spectra. The likely explanation for the absence of continuum pumped fluorescence resides in the dominance of Ly photons over the 912 – 1110 Å stellar continuum as well as the small covering factor involved in the absorption of continuum radiation, as will be discussed in § 4.
| Line ID | Wavelength (Å) | Branching Ratio ( 104) |
|---|---|---|
| (1– 0) R(3) | 1096.73 | 76.6116 |
| (1– 0) P(5) | 1109.31 | 100.7527 |
| (1– 1) R(3) | 1148.70 | 389.9806 |
| (1– 1) P(5) | 1161.82 | 492.7111 |
| (1– 2) R(3) | 1202.45 | 778.3324 |
| (1– 2) P(5) | 1216.07 | 926.0875 |
| (1– 3) R(3) | 1257.83 | 693.4022 |
| (1– 3) P(5) | 1271.93 | 742.2661 |
| (1– 4) R(3) | 1314.62 | 168.5805 |
| (1– 4) P(5) | 1329.14 | 124.0794 |
| (1– 5) R(3) | 1372.49 | 48.7069 |
| (1– 5) P(5) | 1387.37 | 123.9049 |
| (1– 6) R(3) | 1431.01 | 580.3754 |
| (1– 6) P(5) | 1446.12 | 825.4512 |
| (1– 7) R(3) | 1489.57 | 944.7024 |
| (1– 7) P(5) | 1504.76 | 1149.4655 |
| (1– 8) R(3) | 1547.34 | 667.8068 |
| (1– 8) P(5) | 1562.39 | 713.7622 |
| (1– 9) R(3) | 1603.25 | 217.7934 |
| (1– 9) P(5) | 1617.89 | 196.6773 |
| (1–10) R(3) | 1655.93 | 23.3209 |
| (1–10) P(5) | 1669.77 | 14.8395 |
| (1–11) R(3) | 1703.59 | 0.0253 |
| (1–11) P(5) | 1716.13 | 0.0397 |
| (1–12) R(3) | 1744.02 | 0.0834 |
| (1–12) P(5) | 1754.61 | 0.0423 |
| (1–13) R(3) | 1774.47 | 0.0090 |
| (1–13) P(5) | 1782.18 | 0.0110 |
| (1–14) R(3) | 1791.53 | 0.0006 |
| (1– 0) R(6) | 1109.86 | 69.9280 |
| (1– 0) P(8) | 1130.40 | 88.4209 |
| (1– 1) R(6) | 1161.95 | 377.8252 |
| (1– 1) P(8) | 1183.31 | 447.6342 |
| (1– 2) R(6) | 1215.73 | 809.8802 |
| (1– 2) P(8) | 1237.87 | 873.5052 |
| (1– 3) R(6) | 1271.02 | 797.9877 |
| (1– 3) P(8) | 1293.87 | 729.6058 |
| (1– 4) R(6) | 1327.56 | 247.0670 |
| (1– 4) P(8) | 1351.04 | 133.2556 |
| (1– 5) R(6) | 1385.01 | 22.8098 |
| (1– 5) P(8) | 1408.96 | 111.5518 |
| (1– 6) R(6) | 1442.87 | 554.2507 |
| (1– 6) P(8) | 1467.08 | 800.3663 |
| (1– 7) R(6) | 1500.45 | 1009.0800 |
| (1– 7) P(8) | 1524.65 | 1111.9502 |
| (1– 8) R(6) | 1556.87 | 743.2822 |
| (1– 8) P(8) | 1580.67 | 653.4937 |
| (1– 9) R(6) | 1610.95 | 236.9584 |
| (1– 9) P(8) | 1633.84 | 152.5215 |
| (1–10) R(6) | 1661.20 | 20.8714 |
| (1–10) P(8) | 1682.49 | 6.1068 |
| (1–11) R(6) | 1705.68 | 0.0395 |
| (1–11) P(8) | 1724.43 | 0.3495 |
| (1–12) R(6) | 1741.95 | 0.0684 |
| (1–12) P(8) | 1756.90 | 0.0004 |
| (1–13) R(6) | 1766.87 | 0.0179 |
| Parameter | NGC 6853 | NGC 3132 |
|---|---|---|
| Excitation Source | H I Ly | H I Ly |
| Ly Doppler shift | 25 km s-1 | 30 km s-1 |
| Ly FWHM | 0.40 Å | 0.45 Å |
| Ly total intensity | 12944 R | 217523 R |
| T(H2) | 2040 K | 2040 K |
| N(H2) | 6.0 1018 cm-2 | 3.0 1018 cm-2 |
| N(H I) | 1.0 1014 cm-2 | 2.0 1016 cm-2 |
| 8 km s-1 | 9 km s-1 |
The model parameters summarized in Table 7 were adjusted to reproduce the 1115 – 1187 Å line strengths observed in the LiF 1B channel. The LiF 2A channel (Figure 2) shows a 20% decrease in the (1–1) R(3) brightness, which we attribute to calibration offsets. The molecular hydrogen temperature of 2040 K was derived from absorption spectra (McCandliss et al., 2006). The H2 absorption is blueshifted with respect to the Ly profile by about –25 km s-1, value supported by recent studies of NGC 6853 (McCandliss et al., 2006), assuming Ly at the systemic velocity. The choosen total Ly brightness constrains the molecular hydrogen column density of 6 1018 cm-2. An H2 column density of few 1016 cm-2, as inferred from absorption spectra (McCandliss et al., 2006) would require a much higher Ly brightness.
3.2. NGC 3132
In analyzing the NGC 3132 spectrum it is important to account for the background. The continuum has a very unusual shape, most likely due to the superposition of the central stars and the inhomogeneous dust distribution within the nebula. A detailed analysis of the continuum is beyond the scope of this work, but a rough baseline is needed for the model H2 spectrum. We set this background by manipulating the original HUT spectrum to extract a smooth continuum curve. A broad (width 75 Å) median filter was applied to the data at wavelengths between 1100 and 1750 Å to remove most of the nebular and geocoronal emission lines. A boxcar smooth (width 20 Å) was then applied, leaving a background continuum spectrum. Measured brightnesses for the strongest lines are given in Table 8. The observed H2 emission lines provide a long wavelength confirmation of pumping by Ly photons.
| Line ID | FWHM | Brightness | |
|---|---|---|---|
| (Å) | (Å) | (10-6 ergs cm-2 s-1 sr-1) | |
| H2(1–3)R(3) | 1259.19 | 4.14 | 8.62 0.48 |
| H2(1–3)P(5) | 1273.38 | 3.57 | 16.81 0.52 |
| H2(1–6)R(3) | 1431.73 | 2.41 | 11.86 0.53 |
| H2(1–6)P(5) | 1446.67 | 4.01 | 26.75 0.62 |
| H2(1–7)R(3) | 1489.85 | 2.27 | 23.12 0.64 |
| H2(1–7)P(5) | 1505.84 | 2.41 | 22.59 0.58 |
| H2(1–8)R(3) | 1548.16 | 2.89 | 15.54 0.64 |
| H2(1–8)P(5) | 1563.10 | 1.92 | 14.35 0.64 |
| H2(1–9)P(5) | 1617.69 | 1.28 | 7.04 0.75 |
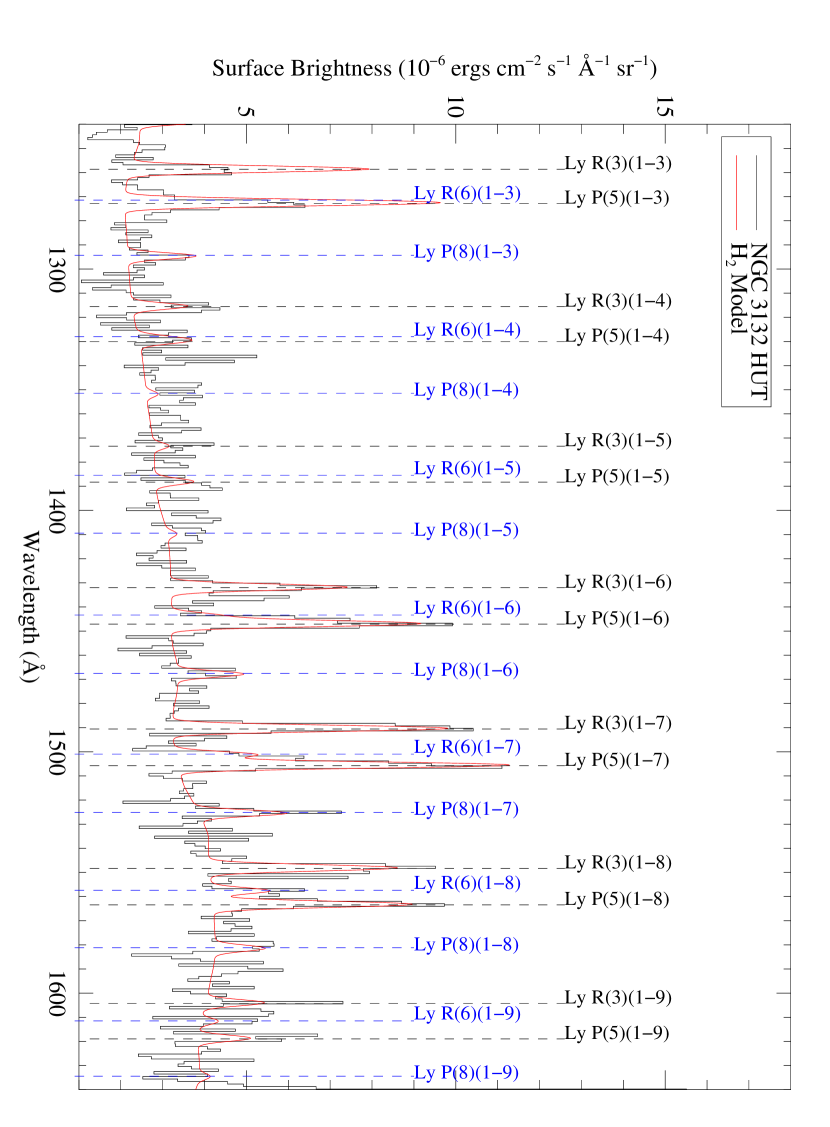
We use the NGC 6853 model as a starting point for NGC 3132 as a detailed study of the molecular structure of NGC 3132 was not available. Previous observations and models of NGC 3132 (Monteiro et al., 2000; Bässgen et al., 1990) estimate the nebular H luminosity at few 1044 photons s-1, too low to predict the observed level of H2 fluorescence. This value was derived using a distance of 670 pc, which might be an underestimate. The estimated total H luminosity of NGC 6853, approximated as an elliptical nebula with semimajor axes of 25 and 4′, at a distance of 417 pc, is 8.55 1046 photons s-1. Using for the NGC 3132 04507 nebula a total H luminosity of 1 1047 photons s-1, closer to the value for NGC 6853, we obtain a reasonable fit with column densities of 3 1018 cm-2 for the molecular component and 2 1016 cm-2 for the atomic hydrogen. The molecular hydrogen absorption is blueshifted with respect to the nebular Ly by –30 km s-1, in agreement with other measurements (Monteiro et al., 2000). A summary of the parameters used is given in Table 7. The overprediction of line strengths in the 1200 1300 Å region (Figure 5) and shortward of 1200 Å (not shown) is caused by an incomplete removal of the combination of geocoronal Ly and the (1 – 3) H2 emission band together with opacity effects. These shorter wavelength lines connect to more populated lower vibrational levels (Table 6), leading to self-absorption (Herczeg et al., 2004; Wood et al., 2002).
4. DISCUSSION
Although H2 absorption was observed in both nebulae (McCandliss et al., 2006; Sterling et al., 2002), continuum pumped molecular hydrogen emission was not detected. Predicted continuum pumped UV fluorescence for an H2 column density of 7.9 1016 cm-2, measured from absorption spectra (McCandliss et al., 2006), is estimated at a level of 0.7 10-6 ergs cm-2 s-1 sr-1 Å-1, consistent with the noise level in Figure 2. However, the larger column density used in the Ly pumping model, would predict a much higher continuum fluorescence, which is not observed. One possible explanation comes from the dominance of Lyman continuum photons over the 912 – 1110 Å photons which contribute to continuum H2 pumping. In the central H II region of a PN, Lyman continuum photons are readily converted into Ly line photons, following a series of ionizations, recombinations and cascades. Integrating a stellar model with Teff = 110,000 K, log() = 6.7, and M⋆ = 0.56 M⊙ (Rauch, 2003), we find that there are over 16 times more photons cm-2 s-1 emitted in the Lyman continuum (5 – 911.7 Å) than in the 912 – 1110 Å region. Additionally, the Lyman continuum photons are concentrated into an emission line (FWHMLyα = 0.4 Å), compared with the far-UV stellar continuum that spans roughly 200 Å. For an H II region with an electron temperature of 12,000 K (i.e.- NGC 6853; Pottasch et al. (1982)) the recombination efficiency for generating Ly photons is roughly 67% (Spitzer, 1978), which gives us 5.5 1045 photons s-1. The total Ly luminosity obtained this way is still low compared to the value of 8.55 1046 photons s-1 derived from the H brightness. This shows that the ratio of Ly photons to 912 – 1110 Å continuum photons might be even higher than estimated.
However, the dominance of Ly photons over the 912 – 1110 Å stellar continuum alone is not sufficient to compensate for the larger ground state populations and higher oscillator strengths contributing to other Lyman and Werner transitions out of v″ = 0. Assuming that molecules reside in high density globules, the covering factor involved in continuum excitation is much smaller than for the diffuse radiation field of scattered Ly. If we let B0 be the surface brightness of the exciting field, the total flux absorbed by an H2 clump will be B, where is the solid angle subtended by the absorber, as seen from the source. The redistributed brightness is then radiated into 4, so that we can define an effective surface brightness seen by the absorber as (B) / 4, where / 4 is the covering factor. For a 10″ 10″ globule at a 50″ separation from the central star, the continuum covering factor is about 0.0032, while for the nebular Ly it is likely to be unity. This estimate takes into account that, while the continuum photons are coming mainly from the star, the Ly photons are produced and scattered in the nebula, so that the globules are effectively embedded in a diffuse Ly radiation field covering all 4 sr.
The broad (98.6 km s-1 FWHM) Ly line required to pump the H2 lines in NGC 6853 is likely to originate in the complex shell structure of the nebula. As shown by Meaburn et al. (2005), in the case of H the wide profile is a result of combining the motions of the outer shell at 35 km s-1, the inner shell at 13 km s-1 and the bulk motion less than 7 km s-1 in the central He II region. We infer a similarly broad velocity structure should be present in NGC 3132 to produce a Ly of comparable width. A narrower velocity distribution would be allowed if we take into account the redistribution of the Ly photons in the line wings for large optical depths.
IR observations of NGC 6853 and NGC 3132 made to date (Storey, 1984; Zuckerman & Gatley, 1988) conclude that the H2 spectrum is shock excited based on the ratios of the S(1) (1–0) and S(1) (2–1) lines. Moreover, this conclusion is supported by the non-detection of continuum pumped UV fluorescence, both in these spectra and in rocket observations of the Dumbbell (McCandliss, 2001). However, recent studies (Hora et al., 1999; Takami et al., 2000) show that in dense enough environments the ratio of the S(1) (1–0) and S(1) (2–1) lines can appear thermal, even if the IR emission is excited via UV pumping. In these cases, the study of transitions from higher energy levels becomes important in order to distinguish between the two mechanisms. The detection of H2 continuum absorption towards the central star of NGC 6853 shows that continuum pumped fluorescence takes place, although at a level allowed by a non-detection in the spectra. This by itself does not rule out a partial UV continuum pumping of the IR lines. However, the thermal processes are thought to be dominant, since absorption out of vibrational levels v″ 2 is not observed, in contrast with reflection nebulae where fourescence is important (Meyer et al., 2001). The possibility of shock excitation in NGC 6853 and NGC 3132 is also revealed here by the high temperature required by the presence of Ly pumping. More in-depth analysis of PNe (Hora et al., 1999; Davis et al., 2003) reveal that in most cases where both the rotational and vibrational temperature of H2 are around 2000 K, shock heating is the dominant excitation mechanism of IR lines. In order to confirm the shock scenario, we need a better understanding of the gas motions in the two objects, in addition to observations shortward of 2 m.
The observed presence of both ionized species and molecules in the same aperture, and the small covering factor necessary to explain the non-detection of continuum pumped lines confirms the current view of molecules residing in globules surrounded by an ionized medium, the source of the exciting Ly radiation (Meaburn & Lopez, 1993; Huggins et al., 2002; Speck et al., 2003). The presence of globules helps the survival of hydrogen molecules, shielded from photodissociation by hard stellar radiation. Overall, the H2 column density derived for the Ly alpha pumping model is much higher than the one derived from absorption spectra (1018 cm-2 vs 1016 cm-2), suggesting different properties of the regions they are probing. Taking into account that the globule size in NGC 6853 is likely to be less than 10”, the observations average between high and low density areas, where the low density regions are thought to have a negligible extinction. The low slit filling fraction for the Ly pumped radiation in both and observations allows us to reconcile the derived value of few1018 cm-2 for the H2 column density with coulmns of 1021 cm-2 suggested for dense globules from visual exctinction arguments (Bohlin et al., 1978; Meaburn & Lopez, 1993).
4.1. Ro-vibrational Cascade Modified by Ly Pumping
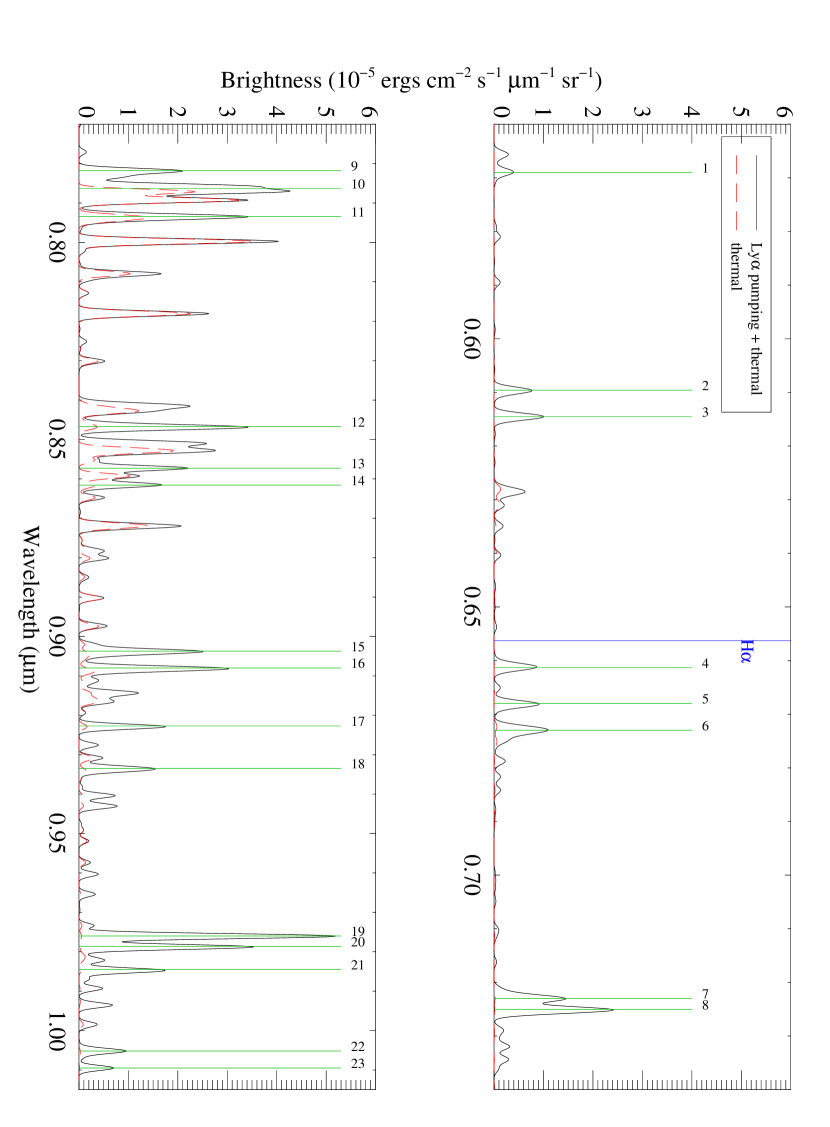

We constructed the ro-vibrational spectrum as a combination of a non-equilibrium cascade following Ly pumping and a steady state emission due to the equilibrium distribution of molecules on the state levels. For the non-equilibrium cascade, we start with the rates at which the levels are populated following Ly pumping, and evaluate the line strengths according to the branching ratios. Collisional effects are ignored for the purpose of this estimate. As a proxy for the equilibrium populations for the steady state case we use the ground state populations measured from absorption spectra and extrapolated to higher vibrational and rotational levels using a 2040 K thermal distribution with a total H2 column density of 7.9 1016 cm-2. For this reason hereafter we will refer to this steady state model as thermal. The transition probabilities from Wolniewicz et al. (1998) are used to derive the output spectrum, shown in Figure 6. The solid black line contains contributions from both thermal and fluorescent pumping, convolved with a 15 Å Gaussian. Overplotted in red is the thermal contribution alone. The lines showing the largest contribution from fluorescent pumping are numbered, and their principal components are listed in Table 9. The line strengths are given as upper limits and will be affected by collisional de-excitation. Collisional excitation is not important for these high lying vibrational states. Using for the thermal model the same total H2 column density of 6 1018 cm-2 used for the Ly pumping, the lines with the highest contribution from fluorescent cascade will be 1,2,3,4,8,9 and 10, as numbered in Figure 6.
The ro-vibrational cascade shows most of the Ly pumping specific features in the visible and near-IR part of the spectrum. We find little deviation from a pure thermal emission longward of 1 m. As a consequence, line pumped UV fluorescence might be present even when the measured IR line ratios around 2 m are consistent with a thermal distribution of the H2 molecules in the ground electronic state.
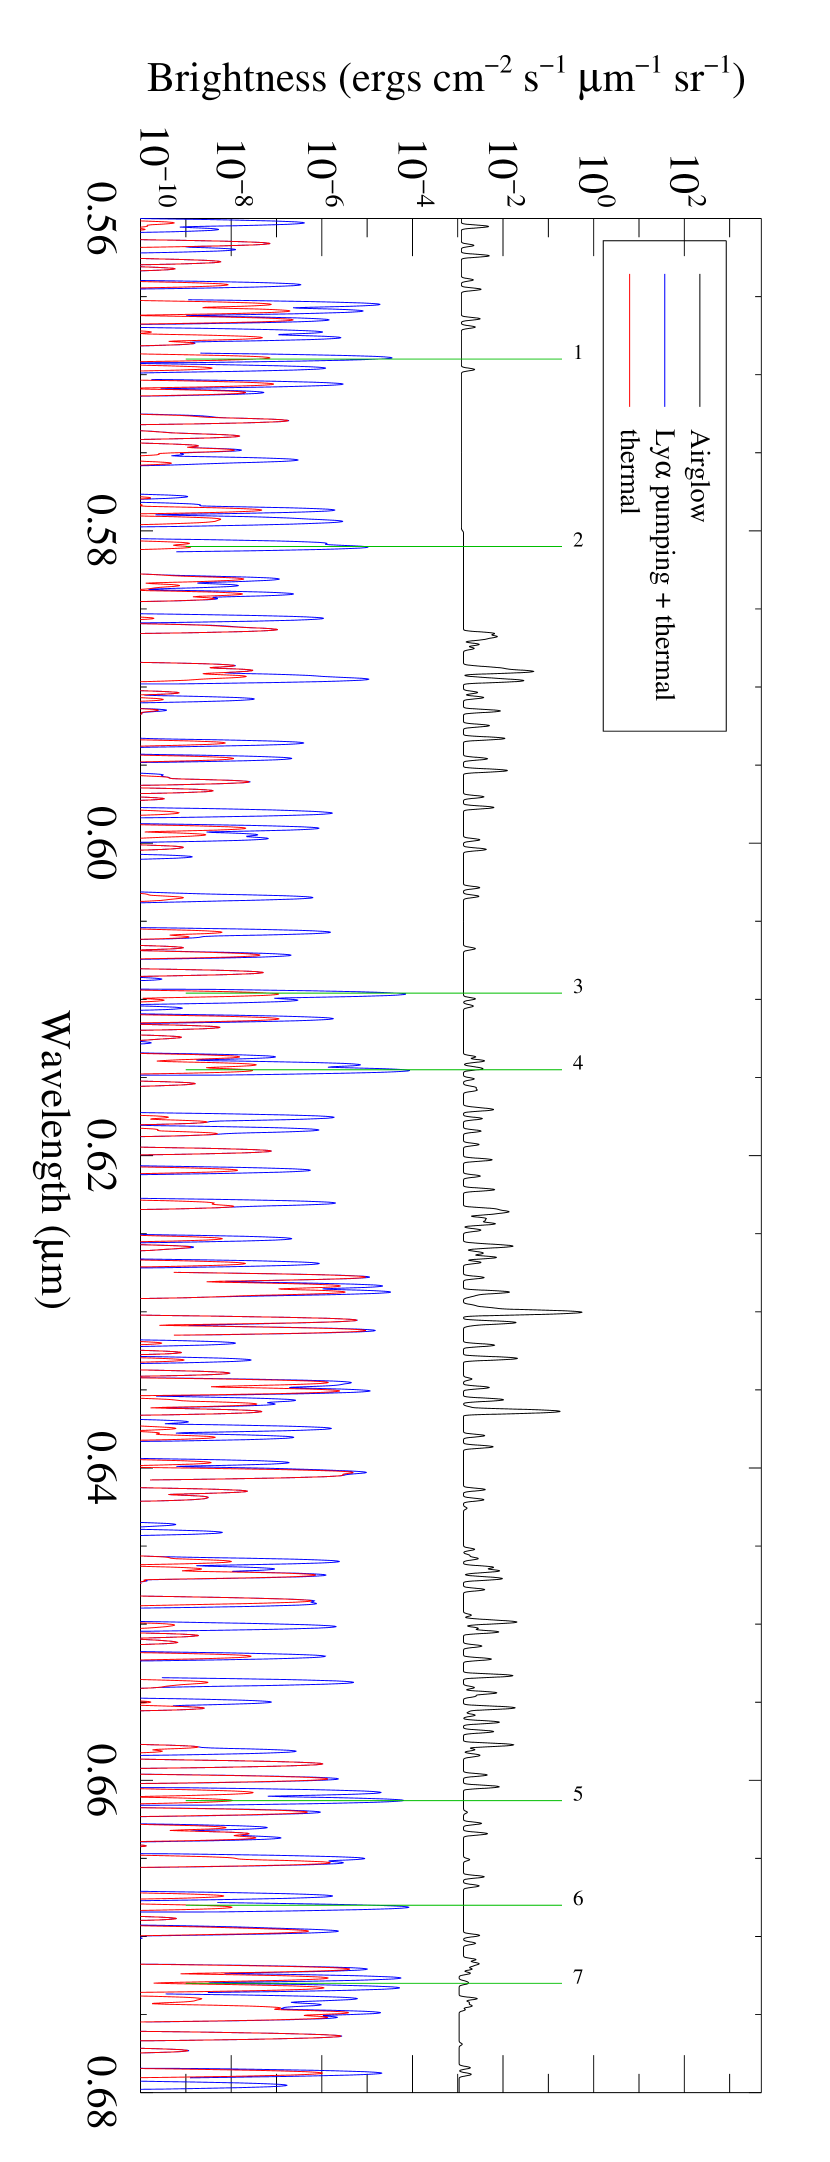
The detection of these lines represents an observational challenge from the ground. In Figure 8 the positions of the strongest predicted lines are indicated on the airglow emission spectrum reconstructed from UVES observations (Hanuschik, 2003) at a resolution of 15 Å to match the resolution of our model. The lack of airglow features in the 0.577 – 0.583 m interval is due to the chip gap in the UVES spectrum. However, Osterbrock et al. (1996) shows that there are no lines identified in this region. The ro-vibrational cascade at a level of few 10-5 ergs cm-2 s-1 sr-1 m-1 is about 1000 times smaller than the typical airglow lines and contiuum in the 0.56 – 1.015 m interval. A much lower background level and a higher spectral resolution ( few Å) may allow the detection of the (9–3) S(4) line at 5810.36 Å and the (8–3) S(6) line at 6681.40 Å (Figure 7).
| Ref No | Line ID | Wavelength (Å) | Brightness (R) |
|---|---|---|---|
| 1 | (6–1) S(6) | 5689.17 | 0.022 |
| 2 | (9–3) S(4) | 5810.36 | 0.007 |
| 3 | (7–2) S(4) | 6096.58 | 0.034 |
| 3 | (7–2) S(3) | 6096.74 | 0.013 |
| 4 | (7–2) S(6) | 6145.49 | 0.058 |
| 5 | (8–3) S(3) | 6607.73 | 0.015 |
| 5 | (8–3) S(4) | 6612.89 | 0.047 |
| 6 | (8–3) S(6) | 6681.40 | 0.061 |
| 7 | (5–1) S(4) | 6726.46 | 0.040 |
| 7 | (5–1) S(6) | 6732.89 | 0.037 |
| 8 | (9–4) S(4) | 7224.75 | 0.024 |
| 8 | (6–2) S(4) | 7231.36 | 0.082 |
| 9 | (6–2) S(3) | 7250.86 | 0.036 |
| 9 | (6–2) S(6) | 7251.65 | 0.134 |
| 10 | (7–3) S(4) | 7818.21 | 0.160 |
| 10 | (7–3) S(3) | 7833.48 | 0.064 |
| 11 | (7–3) S(6) | 7857.03 | 0.240 |
| 11 | (3–0) S(6) | 7871.01 | 0.120 |
| 12 | (3–0) S(4) | 7934.81 | 0.150 |
| 13 | (4–1) S(4) | 8469.30 | 0.255 |
| 14 | (8–4) S(6) | 8572.68 | 0.189 |
| 15 | (4–1) S(2) | 8615.89 | 0.093 |
| 16 | (5–2) S(6) | 9037.36 | 0.203 |
| 17 | (5–2) S(4) | 9081.00 | 0.252 |
| 18 | (4–1) Q(4) | 9228.52 | 0.034 |
| 18 | (5–2) S(2) | 9228.82 | 0.113 |
| 19 | (9–5) S(4) | 9333.02 | 0.069 |
| 19 | (9–5) S(3) | 9333.40 | 0.021 |
| 19 | (5–2) S(1) | 9339.80 | 0.065 |
| 20 | (6–3) S(5) | 9758.45 | 0.019 |
| 20 | (6–3) S(6) | 9760.54 | 0.486 |
| 21 | (6–3) S(4) | 9787.93 | 0.345 |
| 22 | (6–3) S(3) | 9847.38 | 0.170 |
| 23 | (6–3) S(1) | 10052.00 | 0.092 |
| 24 | (5–2) Q(6) | 10095.00 | 0.070 |
Ly pumping redistributes molecules from the (v″,J″) levels (2,6) and (2,5) among the ro-vibrational levels of the ground state. However, at the level of the observed UV fluorescence, a significant deviation from the thermal populations of the (v″,J″) levels (2,6) and (2,5) is not found. Correcting for the ro-vibrational transitions that repopulate these levels, we find that the population decrease relative to the thermal distribution ( NvJ/N) is about 0.0107 and 0.0012 for the (2,6) and (2,5) levels respectively. We find more significant deviations from a thermal population among the rotational levels of the v″=0 state. These are likely to be affected also by collisional redistribution and do not match the deviations measured from UV absorption spectra (McCandliss et al., 2006). Deviations in the populations of higher vibrational levels (v″ 2) are predicted to result in a specific signature in the ro-vibrational spectrum (Figure 6).
5. CONCLUSION
Line pumping by Ly is required to qualitatively explain the H2 emission features in the far UV spectra of NGC 6853 and NCG 3132. The observed H2 fluorescence gives us valuable information about the conditions of the radiation field and dynamics of the molecular gas in planetary nebulae. The input parameters are similar for both objects, suggesting that we do not see an isolated phenomenon. The UV H2 spectrum is likely due to thermally excited molecular hydrogen, shielded from the UV continuum inside globules surrounded by strong nebular Ly emission. We emphasize that while molecular hydrogen pumping by Ly shows strong features in UV spectra, it could remain unobservable in the IR and visible. UV observations are thus a requirement for investigating this process in various environments where hot H2 is exposed to the presence of Ly.
References
- Bässgen et al. (1990) Bässgen, M., Diesch, C., & Grewing, M. 1990, A&A, 237, 201
- Benedict et al. (2003) Benedict, G. F., et al. 2003, AJ, 126, 2549
- Black & van Dishoeck (1987) Black, J. H., & van Dishoeck, E. F. 1987, ApJ, 322, 412
- Bohlin et al. (1978) Bohlin, R. C., Savage, B. D., & Drake, J. F. 1978, ApJ, 224, 132
- Brown et al. (1981) Brown, A., Jordan, C., Millar, T. J., Gondhalekar, P., & Wilson, R. 1981, Nature, 290, 34
- Davis et al. (2003) Davis, C. J., Smith, M. D., Stern, L., Kerr, T. H., & Chiar, J. E. 2003, MNRAS, 344, 262
- France et al. (2005) France, K., Andersson, B.-G., McCandliss, S. R., & Feldman, P. D. 2005, ApJ, 628, 1
- France & McCandliss (2005) France, K., & McCandliss, S. R. 2005, ApJ, 629, L97
- Gatley et al. (1987) Gatley, I., et al. 1987, ApJ, 318, L73
- Gizis et al. (2005) Gizis, J. E., Shipman, H. L., & Harvin, J. A. 2005, ApJ, 630, L89
- Glass-Maujean (1986) Glass-Maujean, M. 1986, Phys. Rev. A, 33, 342
- Hanuschik (2003) Hanuschik, R. W. 2003, A&A, 407, 1157
- Hayashi et al. (1985) Hayashi, M., Hasegawa, T., Gatley, I., Garden, R., & Kaifu, N. 1985, MNRAS, 215, 31P
- Herczeg et al. (2004) Herczeg, G. J., Wood, B. E., Linsky, J. L., Valenti, J. A., & Johns-Krull, C. M. 2004, ApJ, 607, 369
- Hora et al. (1999) Hora, J. L., Latter, W. B., & Deutsch, L. K. 1999, ApJS, 124, 195
- Huggins et al. (2002) Huggins, P. J., Forveille, T., Bachiller, R., Cox, P., Ageorges, N., & Walsh, J. R. 2002, ApJ, 573, L55
- Jordan et al. (1977) Jordan, C., Brueckner, G. E., Bartoe, J.-D. F., Sandlin, G. D., & van Hoosier, M. E. 1977, Nature, 270, 326
- Kastner et al. (1996) Kastner, J. H., Weintraub, D. A., Gatley, I., Merrill, K. M., & Probst, R. G. 1996, ApJ, 462, 777
- Kruk et al. (1995) Kruk, J. W., Durrance, S. T., Kriss, G. A., Davidsen, A. F., Blair, W. P., Espey, B. R., & Finley, D. S. 1995, ApJ, 454, L1
- McCandliss (2001) McCandliss, S. R. 2001, in ASP Conf. Ser. 247: Spectroscopic Challenges of Photoionized Plasmas, 523
- McCandliss et al. (2006) McCandliss, S. R., France, K., Lupu, R. E., Burgh, E. B., Sembach, K., Kruk, J., Andersson, B.-G., & Feldman, P. D. 2006, ApJ, (in preparation)
- Meaburn et al. (2005) Meaburn, J., Boumis, P., Christopoulou, P. E., Goudis, C. D., Bryce, M., & López, J. A. 2005, Revista Mexicana de Astronomia y Astrofisica, 41, 109
- Meaburn & Lopez (1993) Meaburn, J., & Lopez, J. A. 1993, MNRAS, 263, 890
- Meyer et al. (2001) Meyer, D. M., Lauroesch, J. T., Sofia, U. J., Draine, B. T., & Bertoldi, F. 2001, ApJ, 553, L59
- Monteiro et al. (2000) Monteiro, H., Morisset, C., Gruenwald, R., & Viegas, S. M. 2000, ApJ, 537, 853
- Moos et al. (2000) Moos, H. W., et al. 2000, ApJ, 538, L1
- O’Dell et al. (2002) O’Dell, C. R., Balick, B., Hajian, A. R., Henney, W. J., & Burkert, A. 2002, AJ, 123, 3329
- Osterbrock et al. (1996) Osterbrock, D. E., Fulbright, J. P., Martel, A. R., Keane, M. J., Trager, S. C., & Basri, G. 1996, PASP, 108, 277
- Pottasch (1996) Pottasch, S. R. 1996, A&A, 307, 561
- Pottasch et al. (1982) Pottasch, S. R., Gilra, D. P., & Wesselius, P. R. 1982, A&A, 109, 182
- Rachford et al. (2002) Rachford, B. L., et al. 2002, ApJ, 577, 221
- Rauch (2003) Rauch, T. 2003, A&A, 403, 709
- Raymond et al. (1997) Raymond, J. C., Blair, W. P., & Long, K. S. 1997, ApJ, 489, 314
- Sahnow et al. (2000) Sahnow, D. J., et al. 2000, ApJ, 538, L7
- Schwartz (1983) Schwartz, R. D. 1983, ApJ, 268, L37
- Shull (1978) Shull, J. M. 1978, ApJ, 224, 841
- Speck et al. (2003) Speck, A. K., Meixner, M., Jacoby, G. H., & Knezek, P. M. 2003, PASP, 115, 170
- Spitzer (1978) Spitzer, L. 1978, Physical processes in the interstellar medium (New York Wiley-Interscience, 1978. 333 p.)
- Stecher & Williams (1967) Stecher, T. P., & Williams, D. A. 1967, ApJ, 149, L29
- Sterling et al. (2002) Sterling, N. C., Dinerstein, H. L., & Bowers, C. W. 2002, ApJ, 578, L55
- Sternberg (1989) Sternberg, A. 1989, ApJ, 347, 863
- Storey (1984) Storey, J. W. V. 1984, MNRAS, 206, 521
- Takami et al. (2000) Takami, M., Usuda, T., Sugai, H., Kawabata, H., Suto, H., & Tanaka, M. 2000, ApJ, 529, 268
- Torres-Peimbert & Peimbert (1977) Torres-Peimbert, S., & Peimbert, M. 1977, Revista Mexicana de Astronomia y Astrofisica, 2, 181
- Witt et al. (1989) Witt, A. N., Stecher, T. P., Boroson, T. A., & Bohlin, R. C. 1989, ApJ, 336, L21
- Wolniewicz et al. (1998) Wolniewicz, L., Simbotin, I., & Dalgarno, A. 1998, ApJS, 115, 293
- Wolven et al. (1997) Wolven, B. C., Feldman, P. D., Strobel, D. F., & McGrath, M. A. 1997, ApJ, 475, 835
- Wood et al. (2002) Wood, B. E., Karovska, M., & Raymond, J. C. 2002, ApJ, 575, 1057
- Zuckerman & Gatley (1988) Zuckerman, B., & Gatley, I. 1988, ApJ, 324, 501