GRB051210: Swift detection of a short gamma ray burst
Abstract
Context. The short/hard GRB051210 was detected and located by the Swift-BAT instrument and rapidly pointed towards by the narrow field instrumens. The XRT was able to observe a bright X-ray afterglow, one of the few ever observed for this class of bursts.
Aims. We present the analysis of the prompt and afterglow emission of this event
Methods. The BAT spectrum is a power-law with photon index . The X-ray light curve decays with slope and shows a small flare in the early phases. The spectrum can be described with a power law with photon index and absorption cm-2
Results. We find that the X-ray emission is consistent with the hypothesis that we are observing the curvature effect of a GRB occurred in a low density medium, with no detectable afterglow. We estimate the density of the circumburst medium to be lower than cm-3. We also discuss different hypothesis on the possible origin of the flare.
Key Words.:
gamma rays: bursts, gamma-ray bursts: individual (GRB051210)1 Introduction
It has long been known that the T90 duration and hardness ratio of
the population of gamma-ray bursts (GRBs) show a bimodal distribution, where
two classes can be identified: long GRBs, with duration longer than 2 seconds
and short GRBs lasting less than 2 seconds and showing a harder spectrum
(Mazets et al., 1981; Norris et al., 1984; Kouveliotou et al., 1981). While long GRBs have been studied in good detail and
their origin is now
established in the explosion of massive stars leading to very energetic core
collapse supernovae (e.g. Woosley, 1993; Bloom et al., 1999; Hjorth et al., 2003), very little was known about
short GRBs, mainly because of the difficulty to localize them with good
accuracy. A good progenitor candidate for short GRBs has been identified in the
merger of two compact objects in a tight binary (e.g. Eichler et al., 1989)
Thanks to the rapid repointing capability of the Swift satellite (Gehrels et al., 2004),
that allows for an accurate localization of the afterglow within few minutes
from the burst onset, this gap is now being filled, and up to now seven short
GRBs have been localized and their afterglow detected (GRB050509B:
Gehrels et al., 2005; Bloom et al., 2005a; GRB050709: Villasenor et al., 2005; Fox et al., 2006, GRB050724:
Barthelmy et al., 2005b; Campana et al., 2005; GRB050813: Fox et al., 2006; GRB051210 Mangano et al., 2005a,
GRB051221A: Parsons et al., 2005; GRB060121: Arimoto et al., 2006). The association of two of
these events (GRB050509B and GRB050724) with late-type
galaxies and the amount of energy involved (significantly lower than for long
GRBs) support the hypothesis that short/hard bursts are the product of the
merger of two compact objects in a binary system. The lack of any supernova
signature in the identified host galaxies confirms this idea. On the other
hand, the association of GRB050709 and GRB051221A with star forming galaxies is
not at variance with this hypothesis, and merely extends the range of possible
lifetimes of the progenitor system, which can be located both in early-type,
old population galaxies, and in star-forming galaxies.
GRB051210 triggered the Swift-BAT instrument (Barthelmy et al., 2005a) on
December 12 2005 at 05:46:21 UT (Mangano et al., 2005a). The BAT position calculated
on-board was RA=22h 00m 47s, Dec=-57°38′01″(J2000), with a
90% uncertainty of 3′.
The burst was classified as short after the on-ground analysis of the
BAT data (Sato et al., 2005; Barthelmy et al., 2005c) Barthelmy et al. (2005c) report a spectral lag of
, typical of short GRBs Norris & Bonnell (2006). The
spacecraft slewed immediately and the XRT
(Burrows et al., 2005) and UVOT (Roming et al., 2005) began observing the field 79.2 and 70 s
after the trigger, respectively. The XRT onboard centroiding procedure found a
bright fading uncatalogued X-ray source. No source was
detected in any of the UVOT filters (Blustin et al., 2005). Two sources were detected
within the XRT error circle by the 6.5m Clay/Magellan using the LDSS3
instrument: Bloom et al. (2005b) report a clear detection of an apparently extended
(north by north-east) source 2″.9 from the XRT position and a second
marginal detection 1″.1 from the XRT position.
In this paper we report on the analysis of the prompt and afterglow emission of
GRB051210 as observed by the Swift X-ray instruments. Sections 2 and
3 describe the observations, the data reduction and the analysis of the BAT and
XRT data respectively. The results are discussed in Sect. 4.
2 BAT observation
The BAT event data were re-analyzed using the standard BAT analysis software included in the HEASOFT distribution (v. 6.0.3), as described in the Swift BAT Ground Analysis Software Manual (Krimm et al., 2004), that incorporates post-launch updates to the BAT response and to the effective area and includes the systematic error vector to be applied to the spectrum. The light curve showed a double peak with T90= sec (Fig. 1). The average spectrum can be described with a power law with , with a total fluence of erg/cm2 in the 15 150 keV band. A fit with a Band model is unconstrained.

2.1 Data reduction
The XRT is designed to perform observations
in different read-out modes (see Hill et al., 2004 for a detailed description of
the XRT modes), switching automatically among them according to the
count rate level of the source, in order to optimize the collected information
and minimize the pile-up in the data. At present, the Imaging (im), Windowed
Timing (wt) and Photon Counting (pc) modes are fully operating.
XRT began observing the field of GRB051210 in auto state and went through the
correct sequence of read-out modes. The first im frame (lasting 2.5 sec)
allowed for the on-board localization of the burst (Mangano et al., 2005a). This was
followed by 85.1 sec in wt mode and then by 37.0 ksec in pc mode.
They were calibrated, filtered and screened using the XRTDAS (v.2.3)
software package to produce cleaned photon list files.
The position of the source was recalculated on ground using the task xrtcentroid on the pc image and applying the boresight correction through
the updated TELDEF file
provided by the Swift Science Data Center (Angelini et al., 2005). The refined XRT
coordinates are RA=+22h 00m 41.3s, Dec=-57°36′48″.2 (J2000), with 4″.2 uncertainty (Mangano et al., 2005b).
The photons for the timing and spectral analysis were extracted from a region
with 20 and 30
pixels radii for wt and pc data, respectively. In order to account for the
pile-up in the pc data, photons from a radius of 2.5 pixels around the source
centroid were excluded from the analysis, and the remaining photons were then
corrected by the fraction of point spread function lost. The presence of a hot
column crossing the source close to the centroid was accounted for, both in
the wt and pc data using a correction factor derived from the ratio of the
effective areas calculated for the same region with and without the hot column.
The count rate of the source during the im frame was obtained integrating the
DN above the background in a 30 pixel radius circle and then following the
procedure described in Goad et al. (2005).
3 XRT observation
3.1 Data analysis
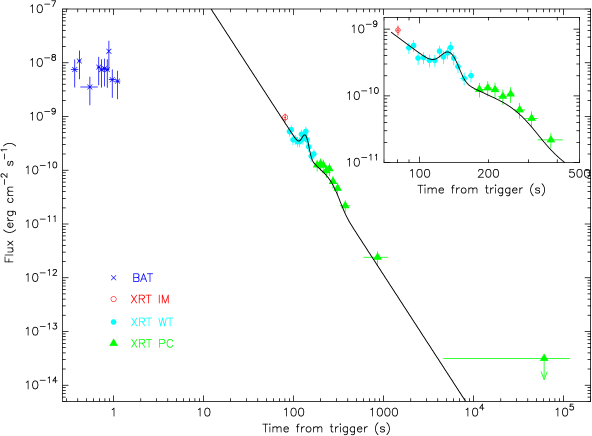
Figure 2 shows the BAT and XRT light curve of GRB051210. The BAT data
(originally in the 15-150 keV band) were extrapolated into the XRT energy band
(0.2-10 keV) and the source observed count rates converted into flux using the
appropriate conversion factor derived from the spectral analysis. The X-ray
afterglow is detected only in the first 1000 s after the onset.
The XRT light curve can be modelled with a single power law with decay index
. The flare in the early afterglow is well described by a Gaussian
centered at sec with s. The inclusion of this component in the fit
improves the (d.o.f.) from 2.17(23) to 1.14(20), with F-test
chance probability of . A second Gaussian centered at
sec yields a further marginal improvement to the fit, with F-test
chance probability of .
In order to compare the decay before and after the flares, we made an estimate
of the decay slope before the flares by comparing the photon arrival times in
the first 26 seconds of the wt mode observation with power laws with different
slopes through a Kolmogorov-Smirnov test. We get
,
where the best value is the one that maximizes the probability
that the photon arrival times follow a power law distribution,
and the quoted errors define the interval of the slope values for
which the test provides an “acceptance” probability higher than
90%. This slope is consistent both with the average decay and
with the late time light curve.
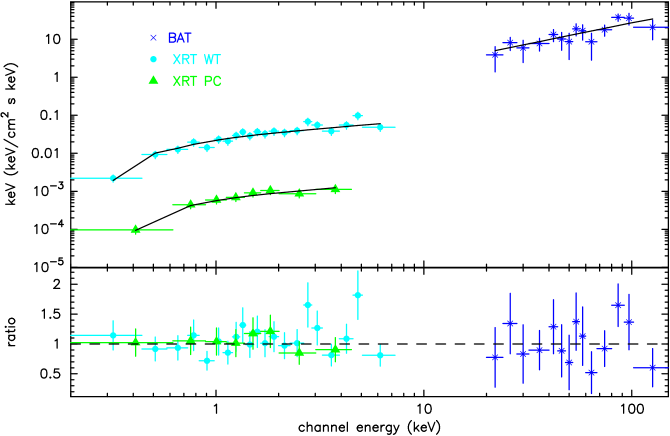
The XRT spectrum (Fig 3, Table 3) is relatively hard and
can be well described with an absorbed power law () with
absorption slightly in excess with respect to the Galactic line of sight value
( cm-2, Dickey & Lockman, 1990).
All quoted errors are at 90% confidence level.
| BAT | XRT | |
|---|---|---|
| Nh (cm-2) | – | |
| (d.o.f.) | 1.0 (57) | 0.78 (25) |
4 Discussion
GRB051210 is one of the few short GRBs for which we have an X-ray detection and
an accurate location. Its X-ray light curve decays rapidly and the X-ray
counterpart is not detectable anymore after 1 ks. The X-ray light curve
decays as a power law with slope . Superimposed on it we
detect a flare peaking at T+134 s, and a less significant bump at T+216 s. The
BAT and XRT spectra can be described with a power law, with photon indexes and respectively.
The shape of the light curve is very similar to that of GRB050421 (Godet et al., 2006).
The rapid fading of the source and the
lack of any flattening in the light curve after the first steep decay may
indicate that the GRB occurred in an extremely low density medium (naked GRB,
Kumar & Panaitescu, 2000; Page et al., 2005) where the radiation emitted by the forward shock, generated by
the impact of the initial shock front with the surrounding interstellar medium,
is expected to be undetectable. The steep decay of the X-ray emission is
fully consistent with the hypothesis that we are observing a low energy tail
of the prompt emission from an internal shock through the so-called
curvature effect (Kumar & Panaitescu, 2000; Dermer, 2004; Zhang et al., 2006): the radiation observed as the tail of
a peak is expected to be the off-axis emission of the shocked surface arriving
at the observer at later times, and would decay as
, where is the photon index of the GRB
emission. In the case of GRB051210 we get , in very good
agreement with the observed slope (). However, the extrapolation
of the XRT light curve back to the burst onset does not match the BAT points
by a few decades. This could well be due to the fact that the XRT light curve
is in fact the tail of a flare peaked at the time before the XRT
observation and too weak to be detected by the BAT. Within such an
interpretation, the zero time point of the rapid decay component
should be shifted to the beginning of the rising segment of the
relevant flare (Zhang et al., 2006; Liang et al., 2006), which marks the reactivation of the
central engine. Visual inspection of the lightcurve suggests that this
time is about 10 s. We then re-fit for the decay index after
such a shift. The temporal decaying slope is changed
, which is still consistent with the theoretical
predicted value .
If we are seeing only the tail of the prompt emission, and the afterglow is not detectable, we can derive an estimation for the density of the interstellar medium in the vicinity of the burst. Assuming erg cm-2 s-1 to be the limiting flux in our observation, and considering that we have no detectable emission at T, we can infer from the expression of the expected afterglow flux according to the standard afterglow models (Sari & Esin, 2001; Sari, Piran & Narayan, 1998). We assume as z the average redshift measured for short GRBs up to now (0.35), and estimate the energy of the afterglow () from the 1-1000 keV fluence of the prompt emission, as indicated by (Frail et al., 2001). We account for the decay of the afterglow at a time T, assuming an electron index p=2.2 and we assume to be at a frequency between the peak frequency and the cooling frequency . With these assumptions, we get , that confirms the trend put in evidence by Soderberg et al. (2006), that short GRBs tend to be in low-density environments. We note that the estimate of is subject to uncertainties of , and (e.g. it increases with and but decreases with ). In any case, the inferred density is lower than the typical values inferred from long GRBs (Panaitescu & Kumar, 2002).
Flaring activity has been previously observed in other short GRBs: GRB050709 (Fox et al., 2006), that shows a flare between 25 and 130 s and a late flare at about 16 d, and GRB050724 (Barthelmy et al., 2005b; Campana et al., 2005), that shows at least four flares. Interestingly, the epoch of the first flare is s for both of those two events and for GRB051210. Moreover, evidence for X-ray emission at this timescale has been reported in the stacked light curves of several BATSE short GRBs (Lazzati et al., 2001). Delayed activity from the inner engine has been generally invoked to interpret flares (Burrows et al., 2005; Zhang et al., 2006; Romano et al., 2006; Falcone et al., 2006). This is less problematic for long duration GRBs since in the collapsar scenario, there is a large reservoir of the fuel and the fragmentation or gravity instability in the collapsing star may form clumps that are accreted at different times, leading to delayed X-ray flares (King et al., 2005). However, this cannot be applied to short GRBs, if we accept the hypothesis that they originate in the merger of two compact objects in a binary system (NS-NS or NS-BH), a scenario supported by the recent observations. Hydrodynamical simulations suggest that the central engine activity of merger events cannot last more than a few seconds (Davies et al, 2005). Perna et al. (2006) suggest a common origin for flares in long and short GRBs: some kind of instability (likely gravitational instability) can lead to the fragmentation of the rapidly accreting accretion disk that forms after the GRB (both in the collapsar and in the merger model), creating blobs of material whose infall into the central object produces the observed flares. Proga & Zhang (2006) suggest that magnetic fields may build up near the black hole and form a magnetic barrier that temporarily block the accretion flow. The interplay between the magnetic barrier and the accretion flow can turn on and off the accretion episodes, leading to erratic X-ray flares at late epochs. This mechanism also applies to both long and short GRBs. Dai et al. (2006) propose that the postmerger product for the NS-NS system may well be a massive neutron star if the neutron star equation of state is stiff enough. The differential rotation of the neutron star would lead to windup of magnetic fields, leading to magnetic reconnection events that power X-ray flares. These scenarios are all consistent with a magnetic origin of the flares based on energetics arguments (Fan et al., 2005). Finally, an alternative hypothesis has been formulated by MacFadyen et al. (2005): the interaction of the GRB outflow with a noncompact stellar object is suggested as a natural explanation for a flare after the burst. This model is restricted to interpret only one flare (and therefore cannot be applied to GRB 050724 but may be relevant for GRB 051210) and the outflow is required to be not collimated. In any case, the presence of a flare at a similar epoch (around 100 s) in three out of five short bursts observed by now, if also confirmed by future short GRBs, is a point that is worth investigating and calls for better understanding.
This work is supported at INAF by funding from ASI, at Penn State by NASA and at the University of Leicester by the Particle Physics and Astronomy Research Council. We gratefully acknowledge the contribution of dozens of members of the XRT team at OAB, PSU, UL, GSFC, ASDC and our subcontractors, who helped make this instrument possible.
References
- Angelini et al. (2005) Angelini L., Hill J.E., Moretti A., et al., 2005, GCN4313
- Arimoto et al. (2006) M. Arimoto, G. Ricker, J.-L. Atteia, N., et al. 2006, GCN4650
- Barthelmy et al. (2005a) Barthelmy, S.D., Barbier, L.M., Cummings J.R. et al. 2005, Space Science Rev., 120, 143
- Barthelmy et al. (2005b) Barthelmy, S.D., Chincarini, G., Burrows, D.N., et al, 2005, Nature,
- Barthelmy et al. (2005c) Barthelmy S., Cummings J., Gehrels N. et al., 2005, GCN4321
- Bloom et al. (1999) Bloom, J.S., Kulkarni, S.R., Djorgovski, S.G., 1999, Nature, 401, 453
- Bloom et al. (2005a) Bloom, J.S., Prochaska, J. X., Pooley, D., et al., 2005, ApJ, in press, astro-ph/0505480
- Bloom et al. (2005b) Bloom, J.S., Modjaz M., Challis P., et al., 2005, GCN4330
- Blustin et al. (2005) Blustin A.J., Mangano V., Voges W., et al., 2005, GCN4331
- Burrows et al. (2005) Burrows, D.N., Romano, P., Falcone A., et al., 2005, Sci, 309, 1833
- Burrows et al. (2005) Burrows, D.N., Hill, J.E., Nousek, J.A., et al., 2005, Space Science Rev., 120, 165
- Campana et al. (2005) Campana S., Tagliaferri G., Lazzati D. et al., 2006, A&A, submitted
- Dai et al. (2006) Dai, Z. G., Wang, X. Y., Wu, X. F., Zhang, B. 2006, Science, in press
- Davies et al (2005) Davies, M.B, Levan, A.J, King, A.R., 2005, MNRAS, 356, 54
- Dermer (2004) Dermer, C.D., 2004, ApJ, 614, 284
- Dickey & Lockman (1990) Dickey, J.M., Lockman, F.J., 1990, ARA&A, 28, 215
- Eichler et al. (1989) Eichler, D., Livio, M., Piran, T., Schramm, D.N., 1989, Nature, 340, 126
- Falcone et al. (2006) Falcone, A., Burrows, D.N., Lazzati, D., et al. 2006, ApJ, in press (astro-ph/0512615)
- Fan et al. (2005) Fan, Y. Z., Zhang, B., Proga, D. 2005, ApJ, 635, L129
- Fox et al. (2006) Fox, D.B., Frail, D.A., Price, P.A., et al., 2005, Nature, 437, 845
- Fox et al. (2006) Fox, D.B., in preparation
- Frail et al. (2001) Frail, D., Kulkarni, S.R., Sari, R. et al. 2001, ApJ, 562, L55
- Gehrels et al. (2004) Gehrels, N., Chincarini, G., Giommi, P., et al., 2004, ApJ, 611, 1005
- Gehrels et al. (2005) Gehrels, N., Sarazin, C.L., O’Brien, P.T., et al., 2005, Nature, 437, 851
- Goad et al. (2005) Goad, M.R., Tagliaferri, G., Page, K.L., et al., 2005, A&A, in press
- Godet et al. (2006) Godet, O., Page, K.L., Osborne, J.P., et al., 2006, A&A, submitted
- Hill et al. (2004) Hill, J.E., et al. 2004, SPIE, 5165, 217
- Hjorth et al. (2003) Hjorth, J., Sollerman, J., Moller, P., 2003, Nature, 423, 847
- King et al. (2005) King, A., O Brien, P.T., Goad, M.R., Osborne, J., Olsson, E., Page, K., 2005, ApJ, 630, 113
- Kouveliotou et al. (1981) Kouveliotou, C., Meegan, C.A., Fishman, G.J., et al., 1993, ApJ, 413, 101
- Krimm et al. (2004) Krimm H.A., Parsons A.M., Markwardt C.B., 2004, Swift-BAT Ground Analysis Software Manual
- Lazzati et al. (2001) Lazzati, D., Ramirez-Ruiz, E., Ghisellini, G., 2001, A&A, 379, 39L
- Liang et al. (2006) Liang, E. W., Zhang, B., O’Brien, P. T., R. Willingale, L. Angelini, D. N. Burrows, et al. 2006, ApJ, submitted (astro-ph/0602142)
- Kumar & Panaitescu (2000) Kumar, P., Panaitescu, A., 2000, ApJ, 541, 51
- MacFadyen et al. (2005) MacFadyen, A.I, Ramirez-Ruiz, E., Zhang, W., 2005, astroph /051192
- Mangano et al. (2005a) Mangano, V., Barthelmy, S.D., Burrows, D., et al., 2005, GCN 4315
- Mangano et al. (2005b) Mangano, V., Cusumano G., La Parola V., et al., 2005, GCN 4320
- Mazets et al. (1981) Mazets, E.P., Golenetskii, S. V., Ilinskii, V. N., et al., 1981, Ap&SS, 80, 3
- Norris & Bonnell (2006) Norris, J.P., Bonnell J.T., 2005, ApJ, in press, astro-ph/0601190
- Norris et al. (1984) Norris, J.P., Cline, T.L., Desai, U.D., Teegarden, B.J., 1984, Nature, 308, 434
- Page et al. (2005) Page, K.L., King, A.R., Levan, A.J., et al., 2006, ApJ, 637, 13
- Panaitescu & Kumar (2002) Panaitescu, A., Kumar, P. 2002, ApJ, 571, 779
- Parsons et al. (2005) Parsons, A., Barthelmy, S., Burrows, D., et al., 2005, GCN 4363
- Perna et al. (2006) Perna, R., Armitage, P.J., Zhang, B., 2005, ApJ, 636, 29L
- Proga & Zhang (2006) Proga, D., Zhang, B. 2006, ApJ, submitted (astro-ph/0601272)
- Romano et al. (2006) Romano, P., Moretti, A., Banat, P., et al. 2006, A&A, submitted
- Roming et al. (2005) Roming, P.W.A., Kennedy T.E., Mason K.O., et al. 2005, Space Science Rev., 120, 95
- Sari & Esin (2001) Sari, R., Esin, A.E., 2001, ApJ, 548, 787
- Sari, Piran & Narayan (1998) Sari, R., Piran, T., Narayan, R., 1998, ApJ, 497, 17
- Sato et al. (2005) Sato G., Angelini L., Barbier L., et al., 2005, GCN 4318
- Soderberg et al. (2006) Soderberg, A.M., Berger, E., Kasliwal, M., et al., 2006, astroph/0601455
- Villasenor et al. (2005) Villasenor, J.S., Lamb, D.Q., Ricker, G.R., et al., 2005, Nature, 437, 855
- Woosley (1993) Woosley, S.E., 1993, ApJ, 405, 273
- Zhang et al. (2006) Zhang, B., Fan, Y.Z, Dyks, J., et al. 2006, ApJ, in press (astro-ph/0508321)