Timing Features of the Accretion–driven Millisecond X-Ray Pulsar XTE J1807–294 in 2003 March Outburst
Abstract
In order to probe the activity of the inner disk flow and its effect on the neutron star surface emissions, we carried out the timing analysis of the Rossi X-Ray Timing Explorer observations of the millisecond X-ray pulsar XTE J1807–294, focusing on its correlated behaviors in X-ray intensities, hardness ratios, pulse profiles and power density spectra. The source was observed to have a serial of broad “puny” flares on a timescale of hours to days on the top of a decaying outburst in March 2003. In the flares, the spectra are softened and the pulse profiles become more sinusoidal. The frequency of kilohertz quasi-periodic oscillation (kHz QPO) is found to be positively related to the X-ray count rate in the flares. These features observed in the flares could be due to the accreting flow inhomogeneities. It is noticed that the fractional pulse amplitude increases with the flare intensities in a range of , comparable to those observed in the thermonuclear bursts of the millisecond X-ray pulsar XTE J1814–338, whereas it remains at about in the normal state. Such a significant variation of the pulse profile in the “puny” flares may reflect the changes of physical parameters in the inner disk accretion region. Furthermore, we noticed an overall positive correlation between the kHz QPO frequency and the fractional pulse amplitude, which could be the first evidence representing that the neutron-star surface emission properties are very sensitive to the disk flow inhomogeneities. This effect should be cautiously considered in the burst oscillation studies.
1 INTRODUCTION
Neutron stars in low-mass X-ray binaries (LMXBs) accrete matter from a companion with a mass of less than via an accretion disk. In many models, the Keplerian accretion disk is supposed to be terminated at an inner radius of a few Schwarzschild radii by e.g. relativistic effects, radiation drag, or neutron-star magnetosphere-disk interactions (see van der Klis 2004 for a review). The motion of the inner disk flow and the geometry of the innermost disk are still uncertain. The observations of the correlated behaviors in X-ray spectral and timing variabilities in LMXBs have provided the important probes of the accretion-flow dynamics and the stellar-disk interactions.
Kilohertz quasi-periodic oscillations (kHz QPOs, in the frequency range of 200 Hz–1300 Hz) have been observed in more than 20 accreting neutron star LMXBs (see van der Klis 2000, 2004 for the recent reviews). Their frequencies are usually regarded to be associated with the Keplerian orbital frequency at some preferred radius related to . An important evidence for the movement of the inner edge of the disk under different mass accretion rate comes from the observation of a positive correlation of frequency vs. count rate on timescales of hours to days in some low-luminosity LMXBs, i.e. “atoll” sources (Méndez et al., 1999). A similar correlation (or in some cases an anti-correlation) has been also found in some high-luminosity LMXBs, i.e. “Z” sources, in the form of the correlations with curve length along the track traced in an X-ray color-color diagram (Wijnands et al., 1997; Yu, van der Klis & Jonker, 2001; Homan et al., 2002). The effect of stellar radiations on the disk movement has also been observed, e.g. in 4U 1608–52, where Yu & van der Klis (2002) found the anti-correlations between the kHz QPO frequency and the X-ray count rate associated with mHz QPO due to nuclear burning on the neutron star surface.
Nearly coherent brightness oscillations have been discovered during thermonuclear X-ray bursts in some LMXBs (see Strohmayer & Bildsten 2003 for a review). Recent observations of the accreting millisecond pulsars, SAX J1808.4–3658 (Chakrabarty et al., 2003) and XTE J1814–338 (Markwardt et al., 2003), confirm that the burst oscillation frequency is extremely close to the spin frequency. It supports the interpretation of the burst oscillation in terms of a “hot spot” on the stellar surface (Chakrabarty et al., 2003; Strohmayer & Bildsten, 2003), which triggers the efforts to investigate X-ray emission properties on the neutron star surface by folded pulse profiles (Strohmayer et al., 2003; Bhattacharyya et al., 2005; Watts, Strohmayer & Markwardt, 2005). The best-fitting parameters of the pulsed fraction and the first harmonic can not only determine the compactness of neutron star, but also help to figure out how the nuclear burning front (the hot spot) propagates on the stellar surface (Bhattacharyya et al., 2005; Watts, Strohmayer & Markwardt, 2005). However, in the burst-oscillation studies, because of the rather limited photon statistics on the short burst timescale, many similar bursts have to be added to improve the statistics of the folded pulse profiles. The underlying problem is that these bursts may occur in different mass accretion rates. Till now, we know little about what effects of the accretion rate fluctuations can make on the neutron-star surface emissions or material depositions.
This situation can be changed with the discovery of the accreting millisecond X-ray pulsars (MXPs, see Wijnands 2005 for a latest review). Their detectable coherent pulsations allow us to get the pulse profile with good statistics over a long observational period when the energy spectrum (or hardness ratios) varies only slightly. According to the detailed spectroscopic and pulse-profile analysis on SAX J1808.4–3658, Poutanen & Gierlinski (2003) constructed a model for X-ray emissions from a hot spot on the surface/boundary layer of a rapidly rotating neutron star in the hard island state. They used it to constrain the compactness of the central star, the position of the emitting region and the size of the hot spot. Their investigations shed a light on further studies of the variations of the surface X-ray emission regions during the evolution of the accretion disk.
Among the discovered 7 millisecond X-ray pulsars, XTE J1807–294 is the best candidate for us to investigate the impact of disk flow activities on the neutron-star surface emission for four reasons: (1) Besides SAX J1808.4–3658, XTE J1807–294 is also a source which has been reported to have twin kHz QPOs 111In completion of our paper, we noted that Linares et al. (2005) used the same data of XTE J1807–294 as we analyzed. Our results are similar in kHz QPOs and different in the low frequency ranges, which might be due to the different choices of the data segments and different data grouping. (Wijnands et al., 2003; Wijnands, 2005; Linares et al., 2005). (2) The binary parameters of it have been calculated by Campana et al. (2003) and Kirsch et al. (2004) based on the XMM-Newton observation, so we are able to correct the photon arrival times for the orbital motions in producing pulse profiles. (3) The time-averaged energy spectrum of the source is found to be dominated by an optically-thin Comptonized component (Falanga et al., 2005), similar to that of SAX J1808.4–3658 (Gierlinski, Done & Barret, 2002), so that we can take the X-ray emission model of SAX J1808.4–3658 as a direct reference. (4) There are no thermonuclear bursts reported in this source; thus we can focus on studying the effect of disk evolutions. In the left 6 MXPs, i.e., SAX J1808.4–3658, XTE J1751–305, XTE J0929–314, XTE J814–338, IGR J002915934 and HETE J1900.1–2455 (see Wijnands 2005 for a review), the above four conditions cannot be satisfied simultaneously. With the knowledge mentioned above, many basic features of XTE J1807–294 have been available as well, such as the shortest orbital period of minutes and a relatively slow spin frequency of 191 Hz (Markwardt et al., 2003). In addition, this source locates at away from the Galactic center, with the best known position reported by Markwardt et al. (2003) based on a Chandra observation. Assumed a distance of 8 kpc, the source luminosity dropped from on February 28, 2003, to on March 22, 2003 (Falanga et al., 2005).
We analyze the evolution of light curves, hardness ratios, pulse profiles and power density spectra of XTE J1807–294, using Rossi X-ray Timing Explorer (RXTE) observations from February 27 to March 31, 2003. Our results firstly show that the positive kHz QPO frequency-count rate correlation on timescales of hours to days is related to some “puny” flares, originated from disk flow inhomogeneities; the behaviors of the pulsed fraction and the first harmonic in the flares are different from those in the non-flares. However, in the whole investigated episode, there is a positive correlation between the pulsed fraction and the kHz QPO frequency, which could be the first evidence that neutron-star surface emissions are very sensitive to the disk flow inhomogeneities. Furthermore, we describe the RXTE observations and data analysis method in Section 2; the results of timing analysis are presented in Section 3 and discussions of the results are shown in Section 4. Finally, we make a brief conclusion of our studies in Section 5.
2 RXTE OBSERVATIONS AND DATA ANALYSIS
We study the data obtained by the Proportional Count Array (PCA) on board RXTE during the March 2003 outburst decay of XTE J1807–294, using FTOOLS 5.3.
To have an overview of the source evolution, we extract light curves from the PCA standard 2 mode data (detector 2 only, all layers), and subtract the background produced by ‘pcabackest’ version 3.0 with the “CM” faint-source model. We define soft color as the ratio of count rates in the and bands and hard color as the ratio of count rates in the and bands. In selecting good time intervals for data analysis, we give a condition of PCU2-on.eq.1 in addition to the standard conditions for faint sources. Then we extract the light curves of PCU 0, 1, 3, 4 separately and compare them with the light curve of PCU2 respectively. Finally, we find the time intervals when PCU 4 meet instrumental flares and delete such bad time intervals, making sure the following analysis are not influenced by instrumental problems.
For Fourier analysis, we construct pulse profiles and power density spectra from the s time-resolution PCA GoodXenon mode data (all available detectors, all layers), correcting the photon arrival times for orbital motions of the pulsar and the spacecraft. When dealing with the GoodXenon mode data, we do not perform background subtraction or deadtime correction.
For pulse-profile fitting we create folded light curves in 32 phase bins for every continuous event file. As a fit function of the pulse profiles we adopt a two-component Fourier function of the form
| (1) |
where is the normalized count rate of the pulse profile; and are the fractional amplitude of the fundamental and the first harmonic component, respectively; and are the corresponding zero phase angles. We fit the pulse profiles and determine the errors of the fit parameters by using . We estimate the real averaged count rate from the net light curve, produced by processing Standard 2 mode data (detector 2, all layers) within the corresponding intervals of every folded pulse profile.
We construct power density spectrum (PDS) per observation using the data segments of 256 s and 1/4096 s time bins, so that the lowest available frequency is 1/256 Hz and the Nyquist frequency is 2048 Hz. We normalize the power spectra by the method of Miyamoto et al. (1991), and subtract the Possion white noise. In order to improve the statistics, we add the observations into groups when these observations are adjacent in time and the power spectra remain the same. The division of the groups can be found in Table 1 and are depicted in the top panel of Fig. 1. Most of our power spectra show a power-law-like component in mHz–Hz frequency range, which could be the very low frequency noise (VLFN). Furthermore, in our PDS, some additional weak noises can be measured with good statistics as shown in Section 3.3.
We use a power law plus multi–Lorentzian function (Belloni, Psaltis & van der Klis, 2002; van Straaten et al., 2002) to fit the spectra. Before fitting the power spectra, we remove frequency bins containing the pulse spike. To visualize the characteristic frequencies () of noises or QPOs, we plot the power spectra in the power times frequency representation (), where is the power spectral density and is the Fourier frequency. In this representation, the Lorentzian’s maximum occurs at (, where is the characteristic frequency, is the centroid frequency and is the half width and half magnitude (HWHM) of the Lorentzian). We represent the Lorentzian relative width by defined as , and the root-mean-square fractional amplitude by .
3 RESULTS
3.1 Broad “Puny” Flares in 2003 March
It has been found that the light curve of XTE J1807–294 drops exponentially from February to the end of March of 2003 (Falanga et al., 2005) and then becomes flattened instead of being much steepened as in SAX J1808.4-3658 (Gilfanov et al., 1998; Gierlinski, Done & Barret, 2002) and XTE J1751–305 (Gierlinski & Poutanen, 2005). Figure 1 shows that in the former exponentially decaying episode, at least four intensity fluctuations occur, each lasting beyond several thousands of seconds, with small X-ray count rate variations. To make quantitative analysis, we fit the light curve by an exponential plus multi-Gaussian model. The full width and half magnitude (FWHM) of each Gaussian and the ratio of the magnitude of the Gaussian to the exponential value at the same time are (, ), (, ), (, ), (, ), respectively. The features of long duration and low amplitude make these fluctuations different from type I thermonuclear bursts and super nuclear outburst (Strohmayer & Brown, 2002; Strohmayer & Markwardt, 2002) on the neutron star surface. We thus call them “puny” flares for convenience. In the following, it can be noticed that these “puny” flares are also featured by the enhanced soft X-ray emissions and increased pulsed fractions.
The second panel of Fig. 1 shows that the soft color drops in the flares, especially at the top of the largest flare of Mach 14–15. By comparing the light curves in the four energy bands (, , and ), we find that this is due to the stronger soft X-ray emissions in the band of . The color-intensity diagram of Fig. 3 indicates that, except of the “puny” flares, the soft color decreases with the decay of the outburst, whereas the hard color changes a little in the whole investigated episode.
We can deduce from the almost invariant hard color that the hard spectral component changes only slightly in the whole episode. The fitting results of the combined spectra of XMM-Newton, RXTE and INTEGRAL observations (Falanga et al., 2005) present that hard emissions from the hot and optically thin Comptonized plasma dominate the energy spectra; the contribution of thermal emissions from the accretion disk at February 28 and March 22 are so small that they are almost negligible in PCA analysis (above 2.5 keV). Therefore, the PCA X-ray emissions can be considered to be mainly generated from the neutron star surface/boundary layer.
3.2 Variations of Pulse Profiles
We fit 86 pulse profiles with a two-component sine function described in Section 2. The fitting is good in most cases, with ranged in . The situations of only occur in three pulse profiles. We plot the evolutions of the best-fitting parameters of and in the fourth and the fifth panel of Fig. 1, respectively. It can be seen that is a rather unambiguous indicator of the “puny” flares than the X-ray intensities and soft colors, not only because of its small errors, but also because increases significantly at the top of the flares despite how weak the flare is.
Figure 2 shows the different behaviors of and with respect to the averaged count rate of the pulse profile. Combining the fourth panel of Fig. 1, we find that in the normal state, the first harmonic is relatively strong, but it becomes weaker (with decreasing from to about ) in the decay of the outburst, whereas keeps at ; in the flares, is positively correlated with the averaged count rate, whereas is generally in a lower level around over the flares. The variational range of is .
3.3 Aperiodic Timing Behavior
We fit the power density spectra by one power-law component plus three to seven Lorentzian components. Errors on the fit parameters are determined using . We list the characteristic parameters of the Lorentzians, e.g. , and in Table 2, the power-law index of the VLFN and the of the fitting in Table 3. In our investigated episode, kHz QPOs have been detected in groups 1-7 and 9-10, and undetectable in the other groups on account of the poor statistics of the power spectra above 10 Hz. The typical power spectra of XTE J1807–294 are shown in Fig. 4, where group 1 is chosen to stand for the non-flare state and group 5 is taken as a representation of the flare state.
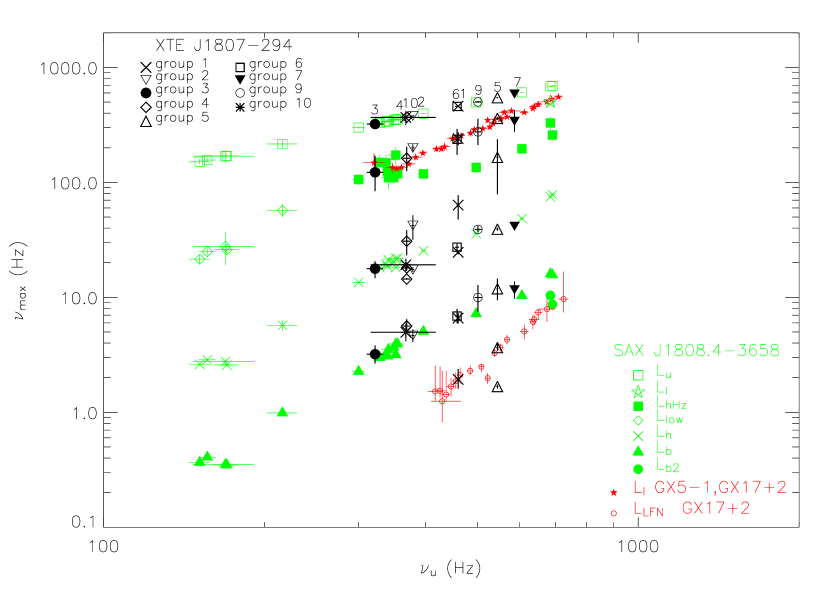
We plot the characteristic frequencies of the Lorentzians versus the upper kHz QPO frequency in Fig. 5. It shows that XTE J1807–294 has a frequency-frequency correlation similar to that of SAX J1808.4–3658 (van Straaten, van der Klis & Wijnands, 2005). Most of the Lorentzian components can then be identified in the scheme of Belloni, Psaltis & van der Klis (2002) and van Straaten, van der Klis & Méndez (2003). In Fig. 5, Lu is the upper kHz QPO; Lℓ is the lower kHz QPO; LhHz is the hectohertz Lorentzian, a broad Lorentzian with a frequency around 150 Hz; Lb is the break Lorentzian, a band–limited noise component; Lh is the low frequency Lorentzian just above Lb. It should be noted that when the frequency of Lℓ approaches the range of Hz, it becomes difficult to be distinguished from LhHz, especially when one of them is not detected in the spectra, e.g. groups 3 and 4 (see Fig. 5). In Table 2 we put ‘?’ on their identifications.
In Fig. 5 we multiply the frequencies of twin kHz QPOs of Z sources GX 51 and GX 17 by a factor of 1/1.5 for comparison. Their shifted frequencies are almost consistent with the frequency–frequency distribution of the twin kHz QPOs of XTE J1807–294. We draw versus for both Lu and Lh in Fig. 6. It proves that the frequency shift exists in the upper kHz QPO frequencies in XTE J1807–294 as in the case of SAX J1808.4–3658 (van Straaten, van der Klis & Wijnands, 2005).
Except of the five major Lorentizans of Lu, Lℓ, LhHz, Lh and Lb, the power spectra of XTE J1807–294 present some additional components (Fig. 5). One of the components is the Lorentizan of Lh2, with frequency nearly double of Lh. If Lh corresponds to the HBO component of Z sources (see van der Klis 2004 for a review), Lh2 would correspond to the HBO harmonic. Such harmonic has never been reported in atoll sources or other accreting millisecond pulsars. Another additional component is the Lorentizan of LLFN, which takes the position of the shifted low-frequency noise (LFN) component of GX in the diagram (Fig. 5). The fitted power law index of vs. is , larger than the index of vs. of 2.7. We use ’Ftest’ to check the probability of the components whose errors are less than . All of the weak noise components listed in Table. 2 have Ftest probabilities less than .
The simultaneous detection of Lb and LLFN in XTE J1807–294 makes it evident that LLFN is a different component from Lb. We infer from this finding that the detected LFN in GX (Homan et al., 2002) should be a different component from those observed in other Z sources. The shift factor of about 1.5 in LLFN as well as in Lu and Lℓ imply that these three components could originate from the same inner disk region.
3.4 Correlations Between Count Rate, Pulse Profile and kHz QPO
We draw in Fig. 7 the upper kHz QPO frequency () versus the averaged count rate and the fractional pulse amplitude () of the group, respectively. The averaged count rate and of every group were calculated using the same methods described in section 3.2.
We can see from Fig. 7 and Fig. 5 that, while the frequencies of the Lorentizans decrease with the count rate in the non-flare state of groups 1–3 and increase with flare intensities in groups 4–6 and 7–10, they do not vary monotonously with the X-ray count rate in the whole episode. The positive frequency–count rate correlations in the rise of the flares seem to be steeper than that measured in the normal outburst decaying state. However, in the whole investigated episode there exists a noticeable positive vs. relation with a linear slop coefficient of (Fig. 7).
4 DISCUSSION
Our motivation to do timing analysis on XTE J1807–294 is to probe the effects on the neutron-star surface X-ray emissions made by the disk flow activities, so we focus on analyzing the variations of pulse profiles and power density spectra during the evolution.
We find several pairs of twin kHz QPOs in the power density spectra of XTE J1807–294. The frequency separation ranges from to , close to the spin frequency of . Several kHz QPO models, considering the coupling of the neutron-star spin to the Keplerian orbit motion of material in the accretion disk, have been put forward to explain this specific feature. We notice that most of these models concern inhomogeneous accretion flow by for example accreting blobs, density fluctuations in the innermost part of the accretion disk, or high-density loops confined along a magnetic field line. In the modified sonic-point beat-frequency model (Lamb & Miller, 2001, 2003), the accreting blobs are introduced to explain the deviation of from the constant value of the spin frequency by considering their relative motions to the neutron star. In the resonant disk oscillation models (Kluźniak et al., 2004; Lee, Abramowicz & Kluźniak, 2004), the twin kHz QPOs are explained by a nonlinear resonance excited by coupling disk oscillation modes to the neutron star spin. Pétri (2005) proved further that a rotating misaligned magnetic field of a neutron star or a rotating non-axially symmetric gravitational potential can provide the coupling; their perturbations on the accretion disk can give rise to very pronounced density fluctuations at the inner edge of the disk. Most recently, Li & Zhang (2005) pointed out an alternative interpretation for the lower kHz QPO in terms of the standing kink modes of magnetic loop oscillations at the inner edge of the disk, where the loops with high-density plasma and small cross section can be produced from the reconnection of the azimuthal magnetic field lines.
The variation of kHz QPO frequencies can be explained by the movement of the inner edge of the accretion disk in the radiative disk truncation model (Miller, Lamb & Psaltis, 1998; van der Klis, 2001). For example, the observed positive frequency-count rate correlations on timescales of hours to days in some atoll sources have been interpreted as the changes in the inner disk radius due to disk accretion rate fluctuations. We find a similar frequency-count rate correlation in XTE J1807–294, but we notice that the shift of the QPO frequency is related to some broad “puny” flares. The observed frequency-count rate correlation in the rise of the flares seems to be steeper than in the normal state. This result means that (1) in the case of the same count rate, the kHz QPO frequency measured in the rise of the flare is larger than that in the normal state; (2) for a certain kHz QPO frequency range, the variation of the count rate is smaller in the flare than in the normal state. A possible explanation is that there are blobs of high mass densities at the inner edge of the accretion disk and the they can persist in time scales of hours to days. The formation and the detailed structure of such a kind of blob are still uncertain. We refer to the hydrodynamic simulation result by Pétri (2005) mentioned in the above paragraph for instance. It might be expected that the relative intensity of the flares to the nearby normal state could be a measure of the mass density of the blob; while the limited time intervals of the flares could be related to the size of the blobs. However, besides the variation of mass accretion rate due to accreting the blobs, there are other mechanisms which can influence the X-ray intensity and kHz QPO frequency, such as nuclear burning on the neutron star surface (Bildsten, 1993; Yu & van der Klis, 2002). To make a further quantitative investigation of the blobs from the observation, we have to distinguish their different effects firstly.
Accreting inhomogeneous flow as one of the possible origins of flares has been suggested by Moon, Eikenberry & Wasserman (2003) for LMC X–4. In the “broad flare” of LMC X–4, the spectrum is softened and the pulse profile becomes simple sinusoids. These features are also observed in the broad “puny” flare of XTE J1807–294. In the massive X-ray binary LMC X–4, the X-ray emission mechanisms of the magnetic neutron star (with surface magnetic field strength ) are too complex to be modelled. However, the spectrum of XTE J1807–294 can be well fitted by an absorbed black-body plus Comptonization model; thus we can hope to learn more about the X-ray emission properties by fitting the pulse profiles of XTE J1807–294 as done by Gierlinski, Done & Barret (2002); Gierlinski & Poutanen (2005) for SAX J1808.4–3658 and XTE J1751–305.
Our preliminary results of the pulse-profile analysis present that both and behave differently in the flares and in the non-flares. As for the latter case, while the X-ray count rate decreases, keeps at about , whereas decreases from to . However, in the former case, is generally in a low level of , whereas increases with the flare intensities. The value of spans in the range of , comparable to those observed in some thermonuclear bursts of XTE J1814–338 (Strohmayer et al., 2003; Watts, Strohmayer & Markwardt, 2005) and some non-pulsing LMXBs (Muno, Özel & Chakrabarty, 2002). According to the X-ray emission model of Poutanen & Gierlinski (2003), the variation of the pulse profile can be determined by the changes of the surface-emission parameters, such as the hot spot size, position, and even emission patterns, e.g. the optical depths of the black-body emission and the Comptonization, respectively. We will put the detailed spectroscopic and pulse-profile modelling analysis in a future work. According to this model, the above results have already shown that the accretion emissions at the neutron star surface/boundary-layer are very sensitive to the accretion flow inhomogeneities. The most direct evidence is the observed positive correlation between kHz QPO frequency and in the investigated episode.
Although we infer from the above results that the broad “puny” flares could be mainly due to accreting blobs, we cannot exclude the possibility of the existence of some special mode of nuclear burning on the neutron star surface. Bildsten (1993) firstly proposed that a time-dependent nuclear burning (slow fires) on patches of the neutron star surface can occur in an intermediate accretion regime, where the accretion rate is sub-Eddington but is still too high to allow type I thermonuclear burst, e.g. for a pure helium burning case (Bildsten, 1995). For XTE J1807–294, the conditions for slow fires seem to be satisfied qualitatively: no type I thermonuclear burst has been observed and the source luminosity drops from to about (assuming the distance of 8 kpc) in the investigated episode (Falanga et al., 2005). However, the property of the companion star is still uncertain. It could be a He dwarf with a low inclination angle () located at , or a C/O dwarf with high inclination angle () at about 3 kPc (Falanga et al., 2005), which makes it difficult to give a quantitative estimation of the ignition and the spreading of the fires on XTE J1807-294. Even though, the observations of the low-level luminosity variations on timescales of and the existence of the very low frequency noise (VLFN) in the mHz–Hz range are all consistent with the features of the slow fires predicted by the theoretical investigations of Bildsten (1995). If the slow fires exist, the position and the size of the black-body radiation on the neutron star surface will certainly be influenced, making impacts on the soft-band pulse profiles and time lags. We will consider this effect in another work.
5 SUMMARY AND CONCLUSION
XTE J1807–294 shows significant variations of pulse profiles and kHz QPO frequencies during the source evolution in March, 2003. It thus provides a good chance to probe the neutron-star surface/boundary layer X-ray emissions, the inner disk flow activities and their correlations.
The main results we get from RXTE data analysis are related to some specific “puny” flares, featured by low-amplitude intensity fluctuations, hours-to-days long timescale, stronger soft emissions and significant increase of fractional pulse amplitude with the flare intensities. A positive kHz QPO frequency–count rate correlation is also found to be connected with the flares: the correlation seems to be steeper in the rise of the flares than in the normal state. However, in the whole investigated episode, the kHz QPO frequency is positively correlated with the fractional pulse amplitude. In the normal state, the fractional pulse amplitude keeps constant and the first harmonic content decreases with the outburst decay.
We propose that accreting high-mass-density blobs could be responsible for all of the above features of the “puny” flares, and conclude that neutron-star surface emissions should be very sensitive to the disk flow inhomogeneities in the hard state. Since the variation of the fractional pulse amplitude in the flare is comparable to that in the thermonuclear burst, the effect of the accretion flow inhomogeneity on material depositions at the neutron star surface should be carefully considered in the study of thermonuclear burst oscillations.
Detailed spectroscopic and pulse-profile analysis on XTE J1807–294 will be done to determine the physical parameters of the surface/boundary-layer emissions in the whole investigated episode in a subsequent work.
References
- Belloni, Psaltis & van der Klis (2002) Belloni, T., Psaltis, D., & van der Klis, M. 2002, ApJ, 572, 392
- Bhattacharyya et al. (2005) Bhattacharyya S., Strohmayer T. E., Miller M. C., Markwardt C. B., 2005, ApJ, 619, 483
- Bildsten (1993) Bildsten, L. 1993, ApJ, 418, L21
- Bildsten (1995) Bildsten, L. 1995, ApJ, 438, 852
- Campana et al. (2003) Campana, S., Ravasio, M., Israel, K. L., et al. 2003, ApJ, 954, L39
- Chakrabarty et al. (2003) Chakrabarty, D., Morgan, E. H., Muno, M. P., et al. 2003, Nature, 424, 42
- Falanga et al. (2005) Falanga, M., Bonnet-Bidaud, J. M., Poutanen, J., Farinelli, R., & Martocchia A. et al. 2005, A&A, 436, 647
- Gierlinski, Done & Barret (2002) Gierlinski, M., Done, C., & Barret, D. 2002, MNRAS, 331, 141
- Gierlinski & Poutanen (2005) Gierlinski, M. & Poutanen, J. 2005, MNRAS, 359, 126
- Gilfanov et al. (1998) Gilfanov, M., Revnivtsev, M., Sunayev, R., & Churazov, E. 1998, A&A, 338, 83
- Homan et al. (2002) Homan, J., van der Klis, M., Jonker, P., G., Wijnands, R., Kuulkers, E., Mendez, M., & Lewin, W., H., G. 2002, ApJ, 568, 878
- Jonker et al. (2002) Jonker, P., G., van der Klis, M., Homan, J., Mendez, M., Lewin, W., H., G., Wijnands, R., & Zhang, W. 2002, MNRAS, 333, 665
- Kirsch et al. (2004) Kirsch, M. G., Mukerjee, K., Breitfellner, M. G. et al. 2004, A&A, 423, L9
- Kluźniak et al. (2004) Kluźniak, W., Abramowicz, M. A., Kato, S., Lee, W. H., & Stergioulas, N. 2004, ApJ, 603, L89
- Lamb & Miller (2001) Lamb, F. K. & Miller, M. C. 2001, ApJ, 554, 1210
- Lamb & Miller (2003) Lamb, F. K. & Miller, M. C. 2003, HEAD, 8, 1711
- Lee, Abramowicz & Kluźniak (2004) Lee, W. H., Abramowicz, M. A. & Kluźniak, W. 2004, ApJ, 603, L93
- Li & Zhang (2005) Li, X. D. & Zhang, C. M. 2005, ApJ, 635, L57
- Linares et al. (2005) Linares, M., van der Klis, M., Altamirano, D., & Markwardt, C.B. 2005, ApJ, 634, 1250
- Markwardt, Smith & Swank (2003) Markwardt, C. B., Smith, E., & Swank, J. H. 2003, IAU Circ. 8080
- Markwardt et al. (2003) Markwardt, C. B. et al. 2003, ATEL, 127
- Markwardt et al. (2003) Markwardt, C. B., Strohmayer, T. E., & Swank, J. H. 2003, ATEL, 164
- Méndez et al. (1999) Méndez, M., van der Klis, M., Ford, E. C., & van Paradijs, J. 1999, ApJ, 511, L49
- Miller, Lamb & Psaltis (1998) Miller, M. C., Lamb, F. K., & Psaltis, D. 1998, ApJ, 508, 791
- Miyamoto et al. (1991) Miyamoto, S., Kimura, K., Kitamoto, S., Dotani, T., & Ebisawa, K. 1991, ApJ, 383, 784
- Moon, Eikenberry & Wasserman (2003) Moon, D., Eikenberry, S. S., & Wasserman, I. M. 2003, ApJ, 586, 1280
- Muno, Özel & Chakrabarty (2002) Muno, M. P., Özel, F., & Chakrabarty, D. 2002, ApJ, 581, 550
- Pétri (2005) Petri, J. 2005, A&A, 439, 443
- Poutanen & Gierlinski (2003) Poutanen, J., & Gierliński, M. 2003, MNRAS, 343, 1301
- Strohmayer & Bildsten (2003) Strohmyer, T. E., Bildsten, L. 2003, to appear in ‘Compact Stellar X-Ray Sources’, eds. Lewin W.H.G. & van der Klis M., Cambridge University Press
- Strohmayer & Brown (2002) Strohmyer, T. E., Brown, E. F. 2002, ApJ, 566, 1045
- Strohmayer & Markwardt (2002) Strohmyer, T. E., Markwardt, C. B. 2002, ApJ, 577, 337
- Strohmayer et al. (2003) Strohmyer, T. E., Markwardt, C. B., Swank, J. H., & In’t Zand, J. 2003, ApJ, 596, L67
- van der Klis (2000) van der Klis, M. 2000, ARA&A, 38, 717
- van der Klis (2001) van der Klis, M. 2001, ApJ, 561, 943
- van der Klis (2004) van der Klis, M. 2004, astro-ph/0410551, to appear in Compact Stella X-ray Sources, Lewin & van der Klis (eds), Cambridge University Press
- van Straaten et al. (2002) van Straaten, S., van der Klis, M., di Salvo, T., & Belloni, T. 2002, ApJ, 568, 912
- van Straaten, van der Klis & Méndez (2003) van Straaten, S., van der Klis, M. & Méndez, M. 2003, ApJ, 596, 1155
- van Straaten, van der Klis & Wijnands (2005) van Straaten, S., van der Klis, M. & Wijnands, R. 2005, ApJ, 619, 455
- Watts, Strohmayer & Markwardt (2005) Watts, A. L., Strohmayer, T. E., & Markwardt, C. B. 2005, ApJ, 634, 547
- Wijnands et al. (1997) Wijnands, R. et al. 1997, ApJ, 490, L157
- Wijnands et al. (2003) Wijnands, R., van der Klis, M., Homan, J., et al. 2003, Nature, 424, 44
- Wijnands (2005) Wijnands, R. 2005, astro-ph/0501264, to appear in Nova Science Publishers (NY) volume ”Pulsars New Research”
- Yu, van der Klis & Jonker (2001) Yu, W., van der Klis, M., & Jonker, P. 2001, ApJ, 559, L29
- Yu & van der Klis (2002) Yu, W. F. & van der Klis, M. 2002, ApJ, 567, L67


| No. | Observation ID | Start | End | Exposure (s) |
|---|---|---|---|---|
| 1 | 70134-09-02-00, | Feb. 27 11:44:32 | March 1 00:44:08 | 9.712E+03 |
| 70134-09-02-01, | ||||
| 80145-01-01-01 | ||||
| (80145-01-) | ||||
| 2 | 01-03, 01-04, 01-00 | March 1 12:44:04 | March 2 03:43:44 | 1.133E+04 |
| 3 | 02-00 | March 4 22:53:04 | March 5 01:31:44 | 6.032E+03 |
| 4 | 02-03, 02-02, 02-01, | March 6 16:04:00 | March 8 00:30:40 | 1.912E+04 |
| 03-03, 03-02 | ||||
| 5 | 03-00 | March 8 23:42:08 | March 9 03:19:44 | 8.096E+03 |
| 6 | 02-04, 02-06, 01-05, | March10 00:28:32 | March13 01:35:44 | 4.984E+04 |
| 03-01 | ||||
| 7 | 02-05, 04-01 | March13 18:27:12 | March14 01:44:32 | 1.536E+04 |
| 8 | 04-00 | March14 21:17:20 | March15 01:55:44 | 9.696E+03 |
| 9 | 04-02, 04-10 | March16 00:06:08 | March16 04:15:44 | 7.792E+03 |
| 10 | 04-03 | March16 20:37:20 | March17 00:46:40 | 9.696E+03 |
| 11 | 04-04, 04-09, 04-11, | March17 18:45:20 | March19 22:14:40 | 1.598E+04 |
| 04-05, 04-07 | ||||
| 12 | 04-08, 05-01, 05-03, | March20 20:51:28 | March23 19:26:40 | 2.941E+04 |
| 05-02, 05-00, 05-11, | ||||
| 05-05 | ||||
| 13 | 05-06, 05-04, 05-08 | March25 00:46:24 | March27 00:43:44 | 6.128E+03 |
| 14 | 05-07, 05-10, 05-09, | March27 16:03:28 | March29 19:29:36 | 1.984E+04 |
| 06-00, 06-07, 06-01, | ||||
| 06-10 | ||||
| 15 | 06-02 | March30 14:35:28 | March30 16:56:32 | 5.840E+03 |
| 16 | 06-03 | March31 11:48:32 | March31 17:20:32 | 9.664E+03 |
| No. | LLFN/2 | LLFN(Lb2) | Lb | Lh1 | Lh | Lh2 | LhHz | Lℓ | Lu | |
|---|---|---|---|---|---|---|---|---|---|---|
| (Hz) | – | – | – | |||||||
| 1 | – | – | – | |||||||
| – | – | – | ||||||||
| (Hz) | – | – | – | – | ||||||
| 2 | – | – | – | – | ||||||
| – | – | – | – | |||||||
| (Hz) | – | – | – | – | ? | |||||
| 3 | – | – | – | – | ? | |||||
| – | – | – | – | ? | ||||||
| (Hz) | – | – | ? | |||||||
| 4 | – | – | ? | |||||||
| – | – | ? | ||||||||
| (Hz) | – | – | ||||||||
| 5 | – | – | ||||||||
| – | – | |||||||||
| (Hz) | – | – | – | – | – | |||||
| 6 | – | – | – | – | – | |||||
| – | – | – | – | – | ||||||
| (Hz) | – | – | – | – | – | |||||
| 7 | – | – | – | – | – | |||||
| – | – | – | – | – | ||||||
| (Hz) | – | – | – | – | – | – | – | |||
| 8 | – | – | – | – | – | – | – | |||
| – | – | – | – | – | – | – | ||||
| (Hz) | – | – | – | – | – | |||||
| 9 | – | – | – | – | – | |||||
| – | – | – | – | – | ||||||
| (Hz) | – | – | – | – | – | – | ||||
| 10 | – | – | 0.00 (fixed) | – | – | – | – | |||
| – | – | – | – | – | – |
Note. — In groups 3–4, ‘ ?’ is used in the case where Lℓ can hardly be distinguished from LhHz.
| No. | 1 | 2 | 3 | 4 | 5 |
|---|---|---|---|---|---|
| d.o.f | |||||
| No. | 6 | 7 | 8 | 9 | 10 |
| d.o.f |