11email: B. Stelzer, stelzer@astropa.unipa.it 22institutetext: European Southern Observatory, Casilla 19001, Santiago 19, Chile
Testing the companion hypothesis for the origin of the
X-ray emission from intermediate-mass main-sequence stars
Abstract
Context. The X-ray emission from B-type main-sequence stars is a longstanding mystery in stellar coronal research. Since there is no theory at hand that explains intrinsic X-ray emission from intermediate-mass main-sequence stars, the observations have often been interpreted in terms of (unknown) late-type magnetically active companion stars.
Aims. Resolving the hypothesized companions requires high spatial resolution observations in the infrared and in X-rays. We use Chandra imaging observations to spatially resolve a sample of main-sequence B-type stars with recently discovered companions at arcsecond separation.
Methods. Our strategy is to search for X-ray emission at the position of both the B-type primary and the faint companion.
Results. We find that all spatially resolved companions are X-ray emitters, but seven out of eleven intermediate-mass stars are also X-ray sources. If this emission is interpreted in terms of additional sub-arcsecond or spectroscopic companions, this implies a high multiplicity of B-type stars. Firm results on B star multiplicity pending, the alternative, that B stars produce intrinsic X-rays, can not be discarded. The appropriate scenario in this vein is probably a magnetically confined wind, as suggested for the X-ray emission of the magnetic Ap star IQ Aur. However, the only Ap star in the Chandra sample is not detected in X-rays, and therefore does not support this picture.
Key Words.:
X-rays: stars – stars: early-type, late-type, coronae, activity1 Introduction
After their discovery with the Einstein satellite (Cash & Snow, 1982; Caillault & Zoonematkermani, 1989) X-ray detections of A- and B-type stars have repeatedly been reported throughout the literature (see references in Stelzer et al., 2003), but their origin has remained a mystery.
Intermediate-mass stars are not expected to give rise to high-energy emission. In contrast to early-type stars they do not drive strong stellar winds, in which instabilities arise that can be held responsible for the X-rays such as in O- and early B-type stars (Owocki & Cohen, 1999; Lucy & White, 1980). The empirical relation between the bolometric and the X-ray luminosity observed for hot stars breaks down near spectral type B2 (Berghöfer et al., 1996, hereafter BSC96), approximately coincident with the transition from a strong-wind to a weak-wind regime (Babel, 1996). Stars with cooler spectral types show a large scatter of X-ray luminosity for given bolometric luminosity.
Intermediate-mass stars also do not possess convection zones necessary to drive a stellar dynamo. Therefore, magnetic activity which generates X-ray emission of late-type stars (Parker, 1955, 1993; Rüdiger & Brandenburg, 1995) seems not to be a viable alternative. The minimum depth of a convective envelope able to support magnetic activity is not well established. Based on studies of the X-ray detection rate as a function of color for main-sequence (MS) stars the onset of significant dynamo action is placed somewhere near spectral type A7 (Schmitt et al., 1985; Hünsch, 2001).
As outlined above, obvious qualitative changes in the properties of the observed X-ray emission coincide with the approximate break-down of known emission mechanisms. Nevertheless, contrary to the expectation a relatively large number of A- and B-type stars apparently are not X-ray dark, with hundreds of them listed in the catalogs of X-ray sources detected during the ROSAT All-Sky Survey (RASS); see Berghöfer et al. (1996); Hünsch et al. (1998). In absence of a physical explanation, the X-ray emission of late-B and early-A stars is commonly attributed to unresolved late-type companions. The contraction timescale of late-type pre-MS stars to the MS is comparable to the mean lifetime of late B-type stars on the MS. Hence, the hypothesized companions of a MS B-type star must be young late-type stars in approach to the MS, and – because of the relation between X-ray emission and stellar youth – they are by their nature strong X-ray sources. Based on this argument Lindroos (1986) has isolated pairs composed of a MS early-type star and a likely physically bound pre-MS star. These systems are henceforth termed ‘Lindroos systems’.
Testing the hypothesis that unresolved companions produce the observed X-rays from A- and B-type stars requires high-spatial resolution observations in the optical/IR and the X-ray band. The first step in this approach is to search for companions within the X-ray error box of X-ray detected A/B-stars. The preferred wavelength is the near-IR, where the contrast between the intermediate-mass star and an eventual cool companion is more favorable with respect to the optical, and where the adaptive optics (AO) technique allows to obtain diffraction limited images with sub-arcsecond separations. This way Hubrig et al. (2001) reported the discovery of new companions to of B-type stars selected among the X-ray emitters detected during the RASS. The separations between the new IR objects and the B-type primary range between . The IR photometry of these new objects has been used to place them in the HR diagram, estimating their masses and spectral types. Both are consistent with them being late-type stars. Therefore, they are good candidates for the origin of the X-ray emission.
After the identification of the companions the claim that they are responsible for the observed X-ray emission must be proven by resolving them in X-rays from the intermediate-mass stars. So far, observational investigations of this issue have been restricted to the few known A- and B-type stars with companions at separations large enough to be resolved by the low spatial resolution X-ray instruments available. A sample of eight visual binaries with separations was examined by Berghöfer & Schmitt (1994) using the ROSAT High Resolution Imager (HRI). But in only one case the X-ray emission could be ascribed to the known visual late-type companion. On the other hand, a ROSAT HRI study of the Lindroos systems has shown that both the primaries – mostly of spectral type B – and their late-type companions emit X-rays at similar levels (Schmitt et al., 1993; Huélamo et al., 2000). This was taken as support for the hypothesis that the X-ray emission from the late B-type stars in fact originates from closer pre-MS late-type companions unresolvable by the ROSAT HRI.
Chandra is the first X-ray satellite that allows for a spatial resolution which comes near to that in the IR. Systems as close as can be studied. At the distance of pc where many of the X-ray emitting B- and A-type stars are located, this corresponds to AU separation. This is much smaller than the maximum separation of visual binaries in the solar neighborhood (see Close et al., 1990; Duquennoy & Mayor, 1991). Therefore, it is plausible to consider faint objects found at a separation of few arc-seconds from nearby B- and A-type stars bound companions, and not just chance projections. However, for the main purpose of this study (i.e. the investigation of the origin of the X-rays from B-type stars) this question is not of great importance.
We have performed a series of Chandra imaging observations pointing at multiple stars with a B-type primary selected from recent AO surveys. The present article is a continuation of the work presented by Stelzer et al. (2003) (henceforth SHH03). In Sect. 2 we explain the selection of the sample observed with Chandra. In Sect. 3 the observations and the data analysis are described. The results from source detection and the X-ray properties of the detections are also presented in Sect. 3, including a discussion of the X-ray lightcurves and spectra. We discuss the relation in Sect 4. In Sect. 5 the results are put in the context of possible emission mechanisms, and the appendix A has information on the individual targets.
2 The Sample
Our project consists of Chandra snapshots of late-B type stars detected in the RASS and known to have close faint companions revealed in recent near-IR AO observations. Results for the first 5 objects were presented by SHH03, where our selection criteria have been described in detail. Briefly summarized, the targets must (i) have been detected previously in low-spatial resolution X-ray observations, (ii) have companions identified by recent AO observations and unknown at the time of the previous X-ray observations, (iii) have separations ranging from between the B/A star and the AO companion (to be resolvable with Chandra but no other presently or previously available X-ray instrument), and (iv) the primaries show no signs of intrinsic binarity according to the Hipparcos data base (The Hipparcos Catalogue, 1997, ESA SP-1200) and the data base (Wielen et al., 2000).
In this paper the sample presented by SHH03 is being complemented by Chandra observations of another late-B stars. Our targets were chosen from the work of Hubrig et al. (2001). We have added to our sample one further intermediate-mass star from the Chandra archive: HD 129791 is a Lindroos system composed of a A0 star on the MS and a K5 companion at . One of our other targets, HD 32964, is also a Lindroos system, i.e. this star has both a wide companion at (the Lindroos secondary) and a close companion discovered by Hubrig et al. (2001).
The separations of the two Lindroos secondaries are large enough so that they have been resolved with ROSAT. Therefore, these companions can not provide the explanation of the X-ray emission from the B-type primaries. However, studying their X-ray emission may be instructive for two reasons: (1) It may help to discriminate between them being physically bound companions and unbound chance projections. This is, because – as explained in Sect. 1 – true late-type companions to B stars on the MS are still in their pre-MS contraction phase where they are strongly magnetically active, while unrelated old foreground or background stars are not expected to be X-ray bright. (2) It allows to search for differences between primaries and secondaries that could point at different emission processes.
To summarize, the new sample we present in this paper comprises targets, from our dedicated Chandra program and from the Chandra archive. In Table 1 some information on the targets is summarized. Cols. give the Hipparcos position of the primary, distance, and spectral type. The separation, position angle, an identifier, and the reference of all known companions are listed in cols. . We use labels ‘L’ for Lindroos companions, and letters ‘B’ and ‘C’ for further visual companions. The last columns of Table 1 comprise the Chandra observation identification number, instrument, and exposure time. Throughout this paper we also use results from the first part of our survey (SHH03). The targets presented by SHH03 are also listed in Table 1. Where necessary, the X-ray properties of that group of stars have been re-examined to yield a consistent description of the whole sample.
We point out that true companionship has not been established for any of the new IR objects in our sample, and only for some of the Lindroos secondaries. Confirmation that they are true companions and not just chance projections requires observations of their proper motion and/or spectra. In absence of definite information about their status we will for simplicity continue calling the IR objects ‘companions’, and the B-type stars ‘primaries’.
| Designation | Position(a) | Dist(a) | SpT(b) | Sep(c) | PA(c) | Comp. | Ref. | ACIS observations | |||
| [pc] | [′′] | [∘] | ObsID | Instr | Expo [s] | ||||||
| New Targets | |||||||||||
| HD 32964 | 05:06:45.67 | 04:39:17.4 | B9 | B | (1*) | 3739 | ACIS-I | ||||
| L | (2) | ||||||||||
| HD 73952 | 08:38:44.96 | 53:05:26.1 | B8 | B | (1) | 3740 | ACIS-I | ||||
| HD 110073 | 12:39:52.56 | 39:59:14.8 | B8 | B | (1) | 3741 | ACIS-I | ||||
| HD 129791 | 14:45:57.66 | 44:52:02.9 | A0 | L | (2) | 0627 | ACIS-S | ||||
| HD 134837 | 15:13:07.69 | 36:05:28.8 | B8 | B | (1) | 3742 | ACIS-I | ||||
| HD 134946 | 15:13:17.44 | 24:00:30.2 | B8 | B | (1) | 3743 | ACIS-I | ||||
| Stars from Stelzer et al. (2003) | |||||||||||
| HD 1685 | 00:20:39.03 | 69:37:29.7 | B9 | B | (1) | 2541 | ACIS-I | ||||
| HD 113703 | 13:06:16.70 | 48:27:47.8 | B5 | B | (3) | 0626 | ACIS-S | ||||
| L | (4) | ||||||||||
| HD 123445 | 14:08:51.89 | :28:14.8 | B9 | B | (5) | 2542 | ACIS-I | ||||
| C | (5) | ||||||||||
| L | (2) | ||||||||||
| HD 133880 | 15:08:12.12 | 40:35:02.1 | B8 | B | (1) | 2543 | ACIS-I | ||||
| HD 169978 | 18:31:22.43 | 62:16:41.9 | B7.5 | B | (1) | 2544 | ACIS-I | ||||
| (a) Hipparcos position and distance for the A/B-type star | |||||||||||
| (b) spectral types adopted from the SIMBAD database at http://simbad.u-strasbg.fr/Simbad; | |||||||||||
| (c) separations have been measured in the detector space; | |||||||||||
| References: (1) - Hubrig et al. (2001), (1*) - P.A. redetermined on the ADONIS image, (2) - Turon et al. (1993), | |||||||||||
| (3) - Shatsky & Tokovinin (2002), (4) - Huélamo et al, in prep., (5) - Huélamo et al. (2001). | |||||||||||
3 Observations and Data Analysis
Our original targets were observed with the standard imaging array of the Advanced CCD Imaging Spectrometer (ACIS-I) with nominal frame time of sec. The object added from the archive, HD 129791, had been placed on an ACIS-S chip. ACIS-S provides higher sensitivity than ACIS-I for soft energies. However, its limiting optical magnitude is fainter. Therefore, in order to avoid the risk of contamination by optical light from the optically bright primary star the frame time had been reduced to s. The net exposure time per target was ks.
The data analysis was carried out using the CIAO software
package111CIAO is made available by the CXC and can be downloaded
from
http://asc.harvard.edu/ciao/download version 3.2
in combination with the calibration database (CALDB) version 3.0.0.
We started our analysis with the level 1 events file provided by the
pipeline processing at the Chandra X-ray Center (CXC).
On all observations processed at the CXC with CALDB version earlier than 2.9
we applied a new gain map and updates
on the geometry (focal length, ACIS pixel size and chip positions). For
observations processed with a later version of CALDB
these modifications had been performed automatically during the pipeline process.
In the process of converting the level 1 events file to a level 2 events file
for each of the observations we performed the following steps:
A correction for the charge transfer inefficiency (CTI) has been applied for data
with processing version earlier than 6.12, i.e. for those where the CTI correction
was not yet part of the standard pipeline processing at the CXC.
We removed the pixel randomization which is automatically applied by the CXC pipeline
in order to optimize the spatial resolution.
We filtered the events file for event grades
(retaining the standard ASCA grades , , , , and ),
and applied the standard good time interval file.
Events flagged as cosmic ray afterglow
were retained after inspection of the images revealed that a substantial
number of source photons erroneously carry this flag.
Since the positional accuracy is particularly
important to our observations we also checked the astrometry for any known
systematic aspect offsets using the CIAO aspect calculator222see http://asc.harvard.edu/cal/ASPECT/fix_offset/fix_offset.cgi.
Small offsets are present in some of the observations, and
the aspect was corrected accordingly by modifying the respective header keywords
in the events level 2 file.
3.1 Source Detection and Identification
Source detection was carried out with the wavdetect algorithm (Freeman et al., 2002). This algorithm correlates the data with a mexican hat function to search for deviations from the background. The wavdetect mechanism is well suited for separating closely spaced point sources. We used wavelet scales between and in steps of . The size of the analysed images is sky pixels (1 sky pixel ). For exceptions with known companions at wider separations the source detection was performed in a slightly larger area. The threshold for the significance of the detection was set to . For this value the detection of one spurious source is expected in a pixel wide image.
The identification of all X-ray sources with components of our target systems is summarized in cols. of Table 4. We defer a discussion of Table 4 to Sect. 3.3. Source identification was done by measuring the distance () between each X-ray source and the optical/IR positions of all known visual components in the system. Then we assigned each X-ray source to the closest of the optical/IR objects. This procedure turned out to be unambiguous for all spatially resolved components. No limit was put on the maximum acceptable , but in practice these offsets are small (typically within ). As a rule, source photons were extracted from a circle centered on the wavdetect source position within the radius that includes % of the point-spread-function (PSF) at keV, depending on the position of the source on the detector. For sources which are not fully resolved we defined smaller non-overlapping photon extraction circles.
3.2 Results from Source Detection
Fig. 1 shows a portion of the ACIS images around our targets. We overplot the photon extraction areas (circles), as well as the Hipparcos position of the primary and the IR position of the companions (x-shaped symbols). Surprisingly, in the new sample X-rays are detected from all but one of the primaries. Similar to the findings by SHH03 most companions are also X-ray emitters, yielding new X-ray sources, and a total of X-ray sources when combined with the targets of SHH03.
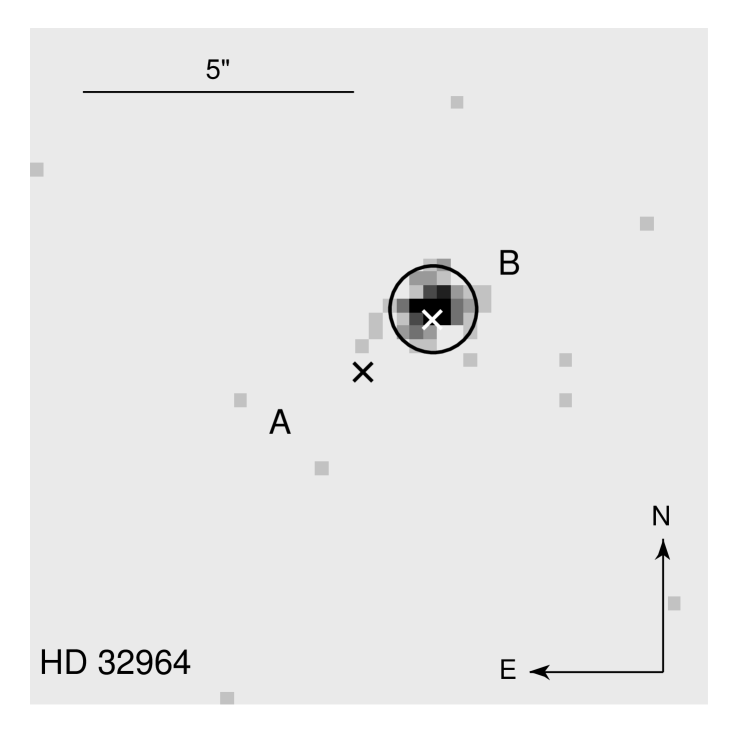
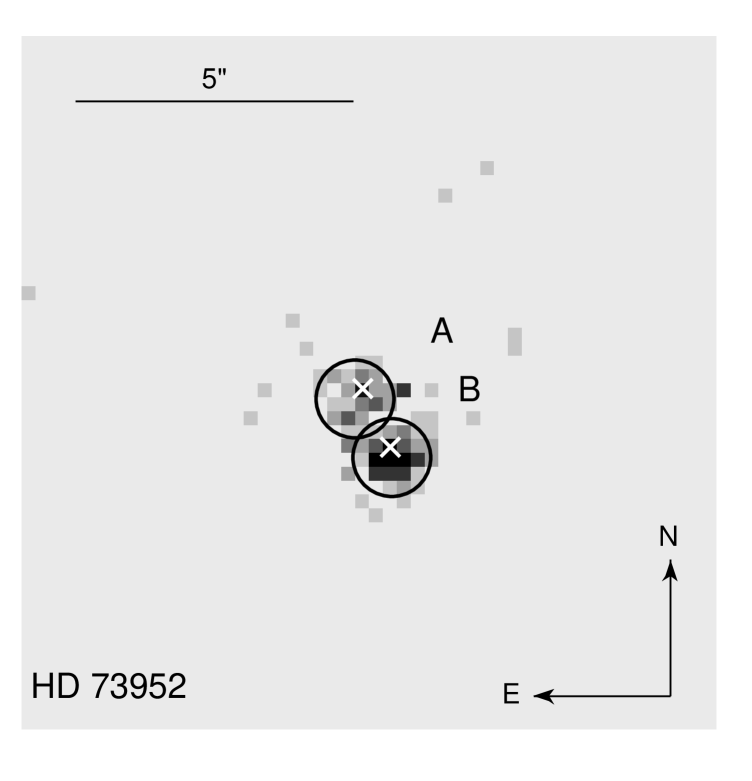
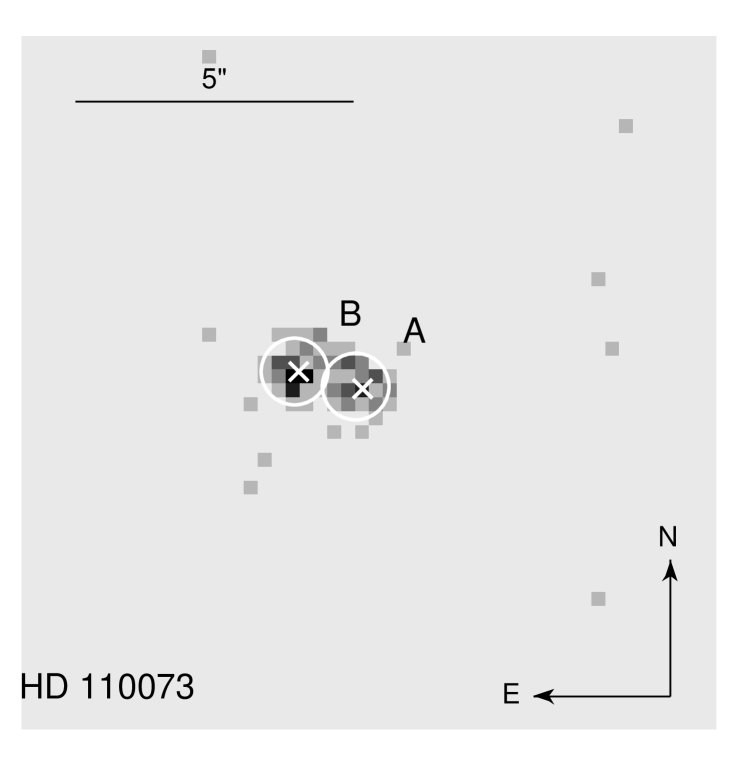
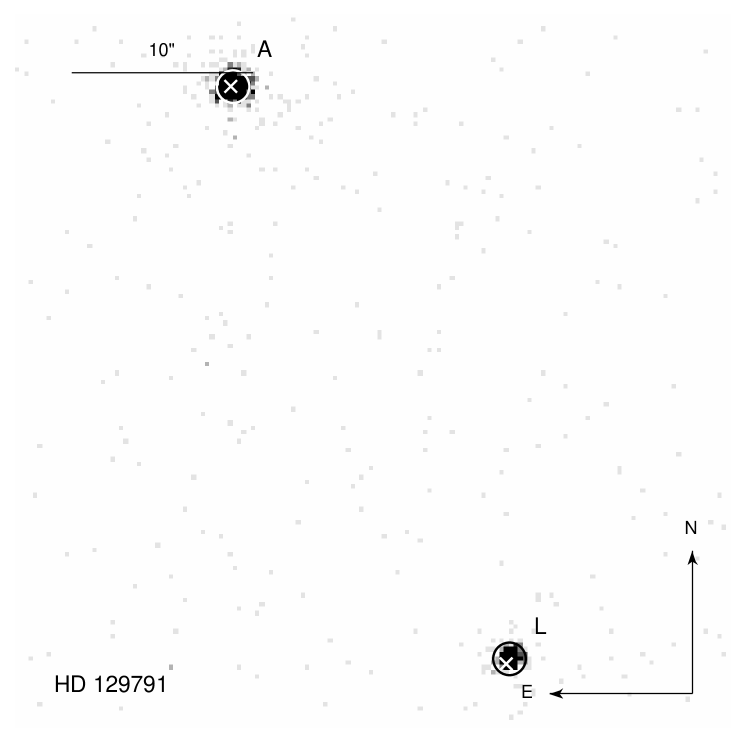
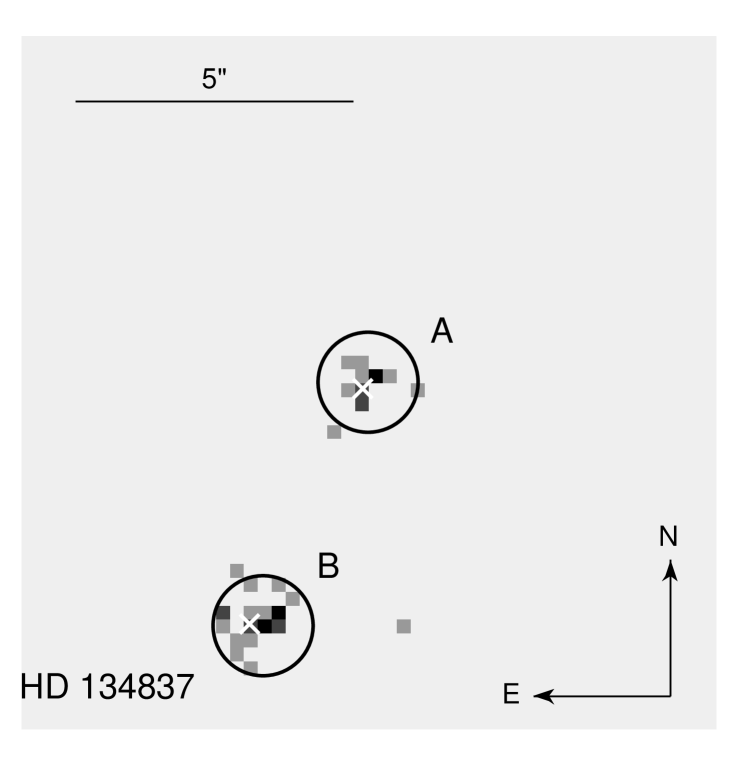
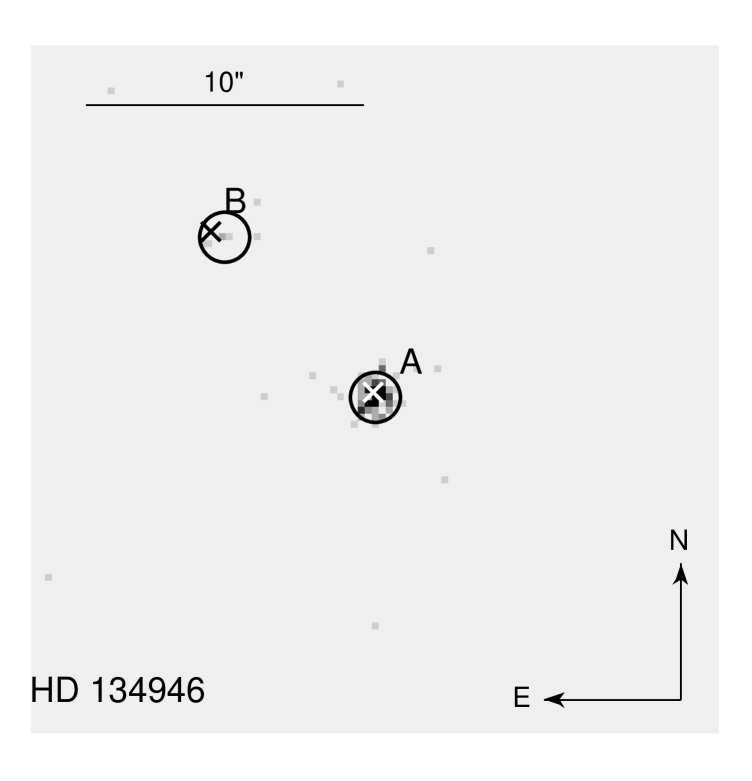
Table 2 gives the published stellar parameters of the primaries, a summary of the X-ray detections, and a flag if there are known companions that remained unresolved with Chandra. Among the (out of ) detected primaries two are known to have unresolved companions: HD 169978 is a spectroscopic binary (see discussion in SHH03), and HD 110073 is listed as an SB 1 in the catalog of Ap stars by Schneider (1981). However, it can not be excluded that there are close unresolved companions among the other primaries, because to date no systematic observations for spectroscopic companions have been carried out for these objects.
Concerning the resolved components, the X-ray detection can help to single out true companions from chance projections. This is related to the argument laid out in the introduction, that B-type stars on the MS are young, such that bound late-type companions are on the pre-MS where they are naturally strong X-ray emitters. It is well-established that T Tauri stars have high X-ray luminosities, albeit with a large spread: erg/s (e.g. Stelzer & Neuhäuser, 2001; Preibisch et al., 2005). For the same range of bolometric luminosity nearby field stars display much lower activity levels, with typically erg/s Schmitt & Liefke (2004); see also Fig. 6 of Preibisch et al. (2005) for a direct comparison to T Tauri stars).
Of the companions to the B-type stars observed with Chandra are detected, and most of them show X-ray luminosities in the range erg/s (see Table 4 and Sect. 3.3), yielding strong evidence for them being pre-MS stars. However, final classification requires confirmation of the companion status by means of spectroscopy (optical spectroscopy should reveal a Li I absorption feature at Å indicating their pre-MS nature) or proper motion. At present this information is available for only a minority of the companions discussed in this article. In the meantime available near-IR photometry allows for a rough estimate of their evolutionary stage, comparing their position in the near-IR color-magnitude diagram (CMD) to pre-MS models.
Fig. 2 shows the vs. diagram with model calculations by Baraffe et al. (1998): , , . The positions of all companion candidates with published and magnitudes (summarized in Table 3) are overplotted. For the distances needed to compute the absolute -band magnitude we assumed that all companions are bound to the primaries. Note that three of the presumed low-mass companions discovered in AO observations have been observed only in the -band, such that they can not be placed in Fig. 2. For the Lindroos companions we extract the near-IR photometry from the 2 MASS333The 2 MASS All Sky Catalog of point sources is available online at http://vizier.u-strasbg.fr/viz-bin/VizieR catalog. Only one companion (HD 1685 B) has near-IR colors that are incompatible with the locus of pre-MS stars in the CMD, and therefore this object is likely physically unrelated to the B-type star. For the undetected Lindroos companions of HD 32964 and HD 123445, the near-IR photometry is compatible with the pre-MS models. The upper limits for their X-ray luminosities are between erg/s, in the range where field stars and pre-MS stars overlap, such that their nature remains unclear.
We tentatively assigned a companion status to each object based on X-ray detection/non-detection and near-IR photometry. Corresponding flags are given in the last two columns of Table 3. To summarize, for the majority of companions both X-rays and near-IR data consistently indicate youth.

| Name | Ref | vsini | Ref | X | C | ||
| [K] | [km/s] | ||||||
| HD 32964 | 4.05 | 2.34 | (1) | 30 | (5) | ||
| HD 73952 | 4.09 | 2.10 | (1) | ||||
| HD 110073 | 4.11 | 2.59 | (1) | 28 | (6) | ||
| HD 129791 | 4.01 | 1.57 | (2,3) | 280 | (7) | ||
| HD 134837 | 4.10 | 1.97 | (1) | ||||
| HD 134946 | 4.14 | 2.19 | (1) | 150 | (5) | ||
| HD 1685 | 4.02 | 1.87 | (1) | 236 | (7) | ||
| HD 113703 | 4.19 | 2.67 | (4) | 216 | (6) | ||
| HD 123445 | 4.02 | 2.25 | (4) | 66 | (7) | ||
| HD 133880 | 4.08 | 2.20 | (1) | ||||
| HD 169978 | 4.11 | 2.82 | (1) | 91 | (6) | ||
| (1) - Hubrig et al. (2001), (2) - de Geus et al. (1989), (3) - | |||||||
| Gerbaldi et al. (2001), (4) - this paper: from | |||||||
| mag, from spectral type with conversion by | |||||||
| Kenyon & Hartmann (1995), (5) - Abt et al. (2002), (6) - | |||||||
| Uesugi & Fukuda (1970), (7) - Royer et al. (2002). | |||||||
| HD | Ref. | Ref | Companionship | |||||
| [mag] | [mag] | [K] | X-rays | NIR-phot. | ||||
| HD 32964 L | (3) | (5) | ||||||
| HD 32964 B | (1) | (1) | ||||||
| HD 73952 B | (1) | (1) | ||||||
| HD 129791 L | (3) | (6) | ||||||
| HD 110073 B | (1) | (1) | ||||||
| HD 134837 B | (1) | (1) | ? | |||||
| HD 134946 B | (1) | (1) | ? | |||||
| HD 113703 B | (2) | (2) | ||||||
| HD 113703 L | (3) | (6) | ||||||
| HD 1685 B | (1) | (1) | ||||||
| HD 123445 L | (3) | (6) | ||||||
| HD 123445 B | (4) | (4) | ? | |||||
| HD 123445 C | (4) | (4) | ? | |||||
| HD 133880 B | (1) | (1) | ||||||
| HD 169978 B | (1) | (1) | ? | |||||
| (1) - Hubrig et al. (2001), (2) - Shatsky & Tokovinin (2002), (3) - Cutri et al. (2003), | ||||||||
| (4) - Huélamo et al. (2001), (5) - Lindroos (1985), (6) - Lindroos (1986). | ||||||||
3.3 X-ray properties
| Designation | Opt/IR | X-rays | Sign. | Counts∗ | HR 1 | HR 2 | PSF | |||
|---|---|---|---|---|---|---|---|---|---|---|
| [′′] | [%] | [erg/s] | ||||||||
| HD 32964 | A | 0.88 | ||||||||
| B | ||||||||||
| L | 0.90 | |||||||||
| HD 73952 | A | |||||||||
| B | ||||||||||
| HD 110073 | A | |||||||||
| B | ||||||||||
| HD 134837 | A | |||||||||
| B | ||||||||||
| HD 134946 | A | |||||||||
| B | ||||||||||
| HD 129791 | A | |||||||||
| L | ||||||||||
| HD 113703 | A | 0.68 | ||||||||
| B | ||||||||||
| L | ||||||||||
| HD 1685 | A | |||||||||
| B | ||||||||||
| HD 123445 | A | 0.90 | ||||||||
| B | ||||||||||
| C | ||||||||||
| L | 0.90 | |||||||||
| HD 133880 | A | 0.35 | ||||||||
| B | ||||||||||
| HD 169978 | A | |||||||||
| B | 0.90 | |||||||||
| ∗ in the keV passband; refers to the distance given in Table 1 and has been corrected from the encircled PSF fraction. | ||||||||||
In Table 4 we list the X-ray parameters of all known components whether detected or not. We give the HD number of the target (column ), component identifier (column ), and a flag that distinguishes X-ray detections (‘’) from non-detections (‘’) (column ). The offset between X-ray and optical/IR position and the significance of detection resulting from the wavdetect algorithm are given in cols. and . The number of counts (column ) refers to the keV passband, and comprises a fraction between and % of the total source counts (see col.9), depending on the extraction radius. To compute upper limits for the undetected components of our target systems we used the method for Poisson-distributed counting data described by Kraft et al. (1991). We took account of the background fluctuations by estimating the background within a squared area of side length centered on the optical/IR position of the respective star but excluding all detected sources, and scaling this mean background to the source extraction area. Columns and of Table 4 show hardness ratios defined as , where and are the number of counts in a hard band and in a soft band, respectively. is defined using emission in the keV () and the keV () bands, and from the keV () and the keV () band. In the final columns of Table 4 we list the PSF fraction included in the source extraction area, the PSF- and absorption-corrected broad-band X-ray luminosity, and the ratio of X-ray to bolometric luminosity. The X-ray luminosities have been computed with PIMMS assuming an iso-thermal emitting plasma with keV. Absorption is neglected, except for HD 129791 where a column density of is assumed, corresponding to the value derived from the optical extinction ( mag; Ryter, 1996). In general stellar coronae are characterized by a multi-temperature plasma. Therefore, the assumption of a 1-T model may not be appropriate, and consequently the X-ray luminosities may not be very precise. In Sect. 3.5 more reliable X-ray luminosities are derived directly from the X-ray spectrum for the brighter sources.
3.4 X-ray lightcurves
We binned lightcurves for all detected sources in s intervals. Obviously, the detection of variability requires both high statistics and a good time resolution, and our choice of the binning is a compromise between these two opposing effects. The duration of these snapshop observations ( ksec) is well below typical variability time-scales on active stars, and therefore we do not expect to detect a lot of variability. Indeed, a KS-test yields only one of the X-ray sources in the sample variable at % confidence level (HD 73952 B). The lightcurve of this object is displayed in Fig. 3, with a sharp increase in the count rate about two thirds into the observation.
The occurrence of flare in ksec (the sum of the observing time of all detected stars in the total sample) is not unusual. Actually, it is even above the expectation. Wolk et al. (2005) derived a rate of flare per ksec from a detailed variability analysis of young solar-analogs in Orion. However, due to the observational limitations in our short snapshots we do not give a lot of weight to this difference, and, more generally, with this data set variability can not be used to examine the origin of the X-rays.

3.5 X-ray spectra
| HD | Opt/IR | (dof) | ||||||
|---|---|---|---|---|---|---|---|---|
| [] | [keV] | [keV] | [] | [] | [erg/s] | |||
| HD 32964 | B | ( ) | ||||||
| HD 73952 | B | ( ) | ||||||
| HD 73952 | A | ( ) | ||||||
| HD 110073 | B | ( ) | ||||||
| HD 134946 | A | ( ) | ||||||
| HD 129791 | A | ( ) | ||||||
| HD 129791 | L | ( ) | ||||||
| HD 113703 | L | ( ) | ||||||
| HD 113703 | B | ( ) | ||||||
| HD 1685 | B | ( ) | ||||||
| HD 1685 | A | ( ) | ||||||
| HD 123445 | B/C | ( ) | ||||||
| HD 133880 | B | ( ) | ||||||
| HD 169978 | A | ( ) | ||||||
| ∗ in the keV passband; refers to the distance given in Table 1. | ||||||||

For most of the X-ray sources in the sample presented here the number of counts collected is small but sufficient for a basic description of the temperature and luminosity of the emitting plasma. As shown by Feigelson et al. (2002) for data of similar quality the typical uncertainties in for sources between and counts with ACIS are about %. Thus, although limited in detailed information, the derived parameters are not meaningless. In our earlier study (SHH03) we have shown the improvement in the estimate of the spectral parameters obtained with similar quality ACIS spectra versus earlier observations of ROSAT.
For all but the faintest X-ray sources from Table 4 we extracted a spectrum, the corresponding detector response matrix that maps pulse heights into energy space, and an auxiliary response file which contains information about the effective area and detector efficiency across the chip as a function of energy. We binned each spectrum to a minimum of or more counts per bin starting at keV. As the background of ACIS is very low ( count in the source extraction area) it can be neglected. Spectral modelling was performed in the XSPEC environment, version 11.3.0.
First we approximated each spectrum with a one-temperature (1-T) thermal model (APEC444For a description of the Astrophysical Plasma Emission Code (APEC) see Smith et al. (2001).). Some of the spectra have a high-energy excess with respect to the 1-T model. These spectra are better described when a second component with higher temperature is added, as verified by a significant reduction of as well as visual inspection. Since the hot component is required only for the brightest sources, its apparent absence in the remainder of the spectra can likely be attributed to the poorer signal at high energies, rather than being a true physical difference. A direct comparison shows that for most spectra the temperature from the 1-T model agrees reasonably well with the mean temperature of the 2-T model, defined as the average of the two temperatures weighted with the emission measures. This test yields a justification for the wide-spread use of 1-T models in cases of poor statistics. However, to obtain a consistent description of all spectra, we choose always the 2-T model as best fit (see Table 5).
Extinction is likely to be negligible, because the stars are evolved enough such that no substantial amount of circumstellar material is expected to be present. In fact, HD 129791 is the only star with measured non-vanishing optical extinction. To test the role of absorption in the X-ray spectra we include a photo-absorption term comprising the atomic cross-section and elemental abundances from Wilms et al. (2000). Two sets of spectral fits were performed, one with free column density () and one with set to zero. The results show that mostly the model without absorption is adequate, i.e. the model with free column density either yields or the fit is poorer (based on the statistics and visual inspection of the residuals). An exception is HD 129791 A. Here, a photo-absorption term is required to describe the spectral shape below keV (see Fig. 4). HD 133880 B and HD 113703 B may be better described with a 3-T model – see SHH03 for a graphical representation of their X-ray spectra – but the highest temperature does not make a large contribution to the total emission measure, such that we can safely ignore it.
The luminosities in Table 5 refer to the keV broad-band, after correction for absorption in the case of HD 129791 A. These luminosities have a tendency of being slightly larger than the values derived with PIMMS assuming an iso-thermal plasma of temperature keV. The emission measure weighted mean temperatures extracted from the spectra are generally slightly smaller than keV. But this is expected to produce an opposite trend, i.e. is rather expected to be smaller. However, the discrepancy is only dex in , and may be ascribed to the use of different plasma codes: RS (Raymond & Smith, 1977) within PIMMS and APEC for the spectral modeling.
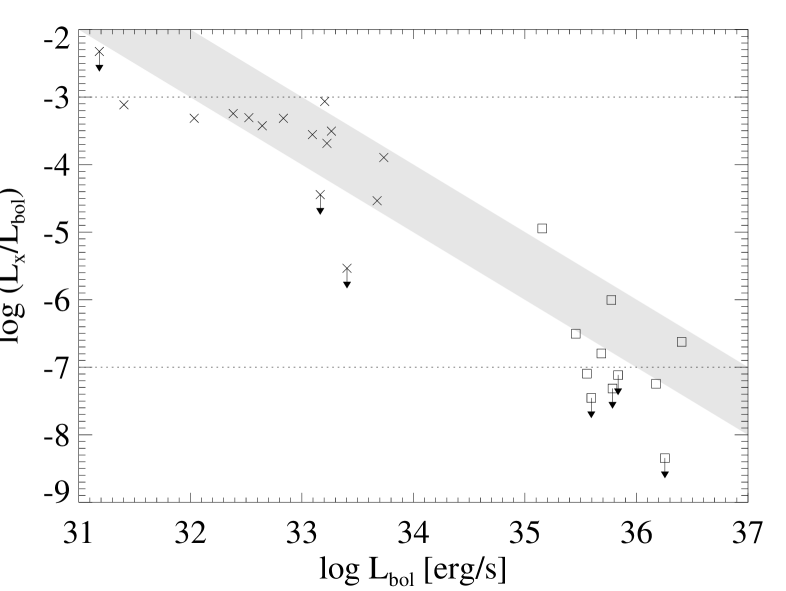
4 The relation
Fig. 5 displays the ratio for all components. In the sample investigated here the companions display values near the saturation limit. The spread is remarkably small, compared to the dex observed typically for late-type pre-MS stars. Judging from the age of the primaries (on the order of Myr), the companions are probably relatively evolved and non-accreting. The absence of accretors diminuishes the scatter of in a sample of pre-MS stars because the latter ones have systematically lower X-ray luminosities; see e.g. Preibisch et al. (2005).
For all intermediate-mass stars of the sample which are not detected the upper limits we derive are lower than the canonical value of for hot stars. Although only one of the four non-detections is clearly below this value, we conjecture that none of these sources are wind-driven. The detected B/A stars show values of , which are somewhat higher than expected for ‘classical’ wind X-ray sources. However, we caution that recent studies have demonstrated that not all hot stars fullfill the relation (Stelzer et al., 2005a).
In terms of absolute X-ray luminosity the detected intermediate-mass stars and the companions are indistinguishable, with the majority showing erg/s. This is indicated by the shaded area in Fig. 5. Assuming that the X-ray emission from the B/A stars is produced by as yet unknown close cool magnetically active companions which emit at typical levels of , we find bolometric luminosities between for such objects. As can be seen from Table 3 this is exactly the range of for the companions that have already been identified and spatially resolved.
5 Discussion
In this paper we have presented the Chandra observations of late-B stars on the MS. The sample complements a previous survey of B-type stars presented by SHH03. The targets are characterized by (1) being known to emit X-rays from ROSAT, and (2) having close companions that could not be spatially separated in previous X-ray images, leaving doubt on the origin of their ROSAT detection. We find that the B-type primary is detected in out of cases, after resolving it from all known visual companions with Chandra. A trend of the early-type stars to split in two groups was pointed out by Daniel et al. (2002) for the Pleiades: Apparent X-ray emitters on the one side, and on the other side X-ray quiet stars with upper limits by orders of magnitudes lower than the values of the detected B-type stars. Our observations are consistent with this general picture, although the two populations are not clearly separated. The two possible interpretations for the observed behavior are (i) X-ray emission is intrinsic to some B-type stars, or (ii) the detected late-B type stars have further (as yet undiscovered) low-mass companions.
The detection fraction of % for the primary stars is surprisingly high. We confront these numbers with the sample of RASS detected late-B type stars. The catalog by BSC96 counts X-ray detected stars with spectral types between B5…B9 versus non-detections in the same spectral type range (12 % detection rate). A systematic search of the literature revealed that for among the RASS detections closeby fainter companions are known, that are confused with the B-type star in the ROSAT error box. The Chandra targets are drawn from this sample. Therefore, it seems justified to assume that our B star detection rate of % is applicable to all known visual late-B type binaries. If the residual X-ray emission at the primary position is attributed to unknown companions, this implies then that about % of X-ray detected B-type stars are high multiplicity systems. This seems at first hand unlikely. However, a speckle survey has revealed a fraction of % of high-order multiples among known spectroscopic binaries of HgMn type (Isobe, 1991). Furthermore, the near-IR studies by Hubrig et al. (2005) have brought forth the discovery of third components in many SB systems among chemically peculiar (CP) stars.
In the Chandra sample three stars are known to have CP character: HD 32964 and HD 110073 are HgMn stars, and both are spectroscopic binaries, i.e. taking into account their visual companions both systems are probably at least triples. Interestingly, HD 32964 is composed of two nearly equal mass B-type stars, that apparently both are X-ray dark, because the only X-ray source is associated with the visual companion. HD 110073, is detected with Chandra, but it might have a magnetic field (see below), suggestive of X-ray production on the intermediate-mass star itself. The third CP star is HD 133880, an Ap star which has no known spectroscopic companion, and it is also not detected in X-rays.
As an alternative to the companion hypothesis, the high X-ray detection fraction of the primaries may indicate that – contrary to the common believe – at least some of them are capable to produce high-energy emission. Intermediate-mass stars possess neither strong winds nor a solar-type dynamo, but they may represent a hybrid case. A magnetically confined wind has been proposed by Babel & Montmerle (1997) to explain the unusually strong X-ray luminosity from the magnetic Ap star IQ Aur. In contrast to the classical wind-shock picture, this model can also produce relatively hard X-ray emission, with temperatures in excess of K produced in shocks that form upon collision of the magnetically channeled winds from the two stellar hemispheres. The high observed X-ray temperatures of the Chandra sources identified with the primaries ( MK) therefore do not exclude that the emission comes from the B stars. But, obviously, the general applicability of this scenario to A- and B-type stars depends on the presence of magnetic fields. Their detection is difficult in intermediate-mass stars because they have fewer absorption lines and faster rotation rates than lower-mass stars. Bychkov et al. (2003) have compiled a list of field measurements for MS and giant stars. This catalog comprises of the X-ray emitting late-B stars from BSC96, of which are apparently single stars.
Two stars of the Chandra sample are listed by Bychkov et al. (2003), but they behave contrary to the expectation: The field measurement for HD 110073 is hardly significant. This star is detected with Chandra, but recall that it is a spectroscopic binary. HD 133880 is an Ap star with a strong, probably non-dipolar field ( kG; Landstreet, 1990; Bychkov et al., 2003), but in SHH03 we have shown that the X-ray emission can be attributed to the companion. Therefore, the presence of magnetic fields does not necessarily imply a relation to X-ray emission.
The short exposure times of the Chandra observations do not allow to examine X-ray properties of the detected sources in detail. Therefore, it is difficult to tell if the X-ray emission from the position of the primaries differs qualitatively from the X-rays produced by the resolved companions. Comparison of the X-ray luminosities and temperatures for the primaries on the one hand and the companions on the other hand does not indicate any systematic trend (cf. Table 5 and Fig. 5). This is consistent with the same emission mechanism working in both groups. Collectively, the X-ray luminosities and temperatures of the objects studied in this paper are much lower than those of low-mass pre-MS stars in star forming regions (e.g. Preibisch & Zinnecker, 2002; Getman, 2002; Feigelson et al., 2002). When choosing energies of keV for the soft band and keV for the hard band, as common for pre-MS objects, all our targets show very negative hardness ratios ( and below), indicating that no significant emission is present at high energies. Thus, both spectral hardness and X-ray luminosity put our targets inbetween the Pleiades and the bulk of pre-MS stars. If this is to be interpreted as an evolutionary effect the low-mass stars in the sample presented here should be in their final approach to the MS, in agreement with their evolutionary state derived from the IR magnitudes and colors.
The fact that nearly all known resolved companion candidates are shown to be X-ray sources, and the similarity of their X-ray properties with those of the B-type primaries, motivates us to speculate about the potential of such objects in eventually explaining the observed X-ray emission from all or most MS B-type stars. In this vein, X-ray detections could even be used as a tool to discover faint companions to B-type stars. The most likely exceptions are the Ap/Bp stars. Checking whether they form a class of intrinsic X-ray emitters must include a systematic study of their multiplicity. In our future work we will continue to examine the multiplicity of the apparently X-ray active B-type stars through IR imaging (see Stelzer et al., 2005b; Huélamo et al., 2005, for preliminary results), and IR/optical spectroscopy. Further high resolution X-ray observations are also desirable. Combining these techniques on a large sample is essential to solve the longstanding mystery of the X-rays from intermediate-mass stars.
Appendix A Individual Targets
A.1 HD 32964
HD 32964 ( = 66 Eri) is a CP star of HgMn type (Renson, 1991), and a spectroscopic binary (Frost & Struve, 1924) composed of two nearly equal mass stars of in a -day orbit (Yushchenko et al., 2001; Catanzaro & Leto, 2004).
HD 32964 is also a Lindroos system with a secondary at separation of . Lindroos (1985) noted that common proper motion is observed, but Eggen (1963) classified the K5 V secondary as optical, and based on this classification it was further on discarded from the Lindroos sample. Consequently, this star was not included in the X-ray study of Huélamo et al. (2000). In the RASS an X-ray source was detected with erg/s (Berghöfer et al., 1996). HD 32964 was also part of the ROSAT HRI sample examined by Berghöfer & Schmitt (1994). While the Lindroos secondary remained undetected consistent with its classification as non-physical companion, the primary was detected at a level of erg/s.
After the ROSAT study another, presumably late-type, companion to HD 32964 was discovered by Hubrig et al. (2001) with AO observations. Near-IR photometry puts the object near the zero-age MS in the CMD (Fig. 2), in agreement with the relatively old age ( Myrs) derived for the primary by Hubrig et al. (2001). With a separation of only this object was not resolvable from the primary with the ROSAT HRI. The only X-ray source detected with Chandra in the vicinity of HD 32964 is clearly identified with this companion. The upper limit for the B-type primary is . The Lindroos secondary remains again undetected at an upper limit of , yielding further evidence that it is not a young late-type star, despite it being compatible with the pre-MS tracks.
A.2 HD 73952
HD 73952 is a member of the Myr-old open cluster IC 2391 (Hogg, 1960; Dodd, 2004). Patten & Simon (1993) reported the X-ray detection of HD 73952 in a ROSAT pointed observation, with four times overluminous according to the canonical relation of for early-type stars. Berghöfer et al. (1996) list HD 73952 with an X-ray luminosity of .
HD 73952 is not a RV variable according to Andersen et al. (1983). But recent AO observations revealed a faint IR object at from the B-type star (Hubrig et al., 2001). Its position in the CMD suggests that it is a very young star of very low mass.
The Chandra image shows two X-ray sources coincident with either of the two components in the HD 73952 system. The brighter source is associated with the secondary, and displays a typical ‘late-type’ ratio. For the B-star we measure , clearly – and not surprisingly – lower than indicated by ROSAT.
A.3 HD 110073
HD 110073 is a CP star of the HgMn class (Renson, 1991). An averaged quadratic magnetic field of G was reported (Bychkov et al., 2003) combining earlier measurements from the literature. As can be seen from the large uncertainty the detection of the magnetic field is highly uncertain. A faint IR object at a separation of seems to be a comparatively massive star on the pre-MS (Hubrig et al., 2001). Furthermore, HD 110073 is a single-lined spectroscopic binary (Schneider, 1981).
Two close X-ray sources are detected with Chandra, spatially coincident with the optical/IR position of HD 110073 A and the companion discovered in the AO observations. The presence of the spectroscopic companion casts some doubt on the origin of the X-rays from the position of the primary, while the possible detection of a magnetic field makes it an interesting candidate for being an intrinsic B-star X-ray emitter.
A.4 HD 134837
HD 134837 is a member of the Upper Centaurus Lupus (UCL) association (de Zeeuw et al., 1999). It was not known to be a multiple prior to the AO survey by Hubrig et al. (2001), which revealed an IR object at from the B-star. The same object was recovered in a recent AO study of the Sco OB association by Kouwenhoven et al. (2005).
In the Chandra image both the primary and the IR object are detected as faint sources.
A.5 HD 134946
HD 134946 is a poorly studied late-B type star for which Hubrig et al. (2001) identified a possible companion at separation. In our Chandra snapshot both objects are detected, albeit the companion only marginally ( photons corresponding to erg/s). The primary is the brighter X-ray source with an ratio of .
A.6 HD 129791
HD 129791 is a member of the UCL association, and a Lindroos system (Lindroos, 1983). According to Gahm et al. (1983) the secondary has spectral type K5 V, and in a spectroscopic study by Pallavicini et al. (1992) it showed all signs of youth (Ca II and H emission, strong Lithium feature). Its separation from the B9 V primary is . Both the primary and the secondary of this system were detected with ROSAT (Huélamo et al., 2000). This led Huélamo et al. (2001) to search for a further, closer companion to HD 129791 A with AO imaging, but the result was negative. Another companion search using AO by Kouwenhoven et al. (2005) resulted also negative.
The ksec long Chandra exposure confirms the detection of both components, but no other X-ray source near the primary, consistent with the absence of further companions in the IR. The primary of HD 129791 is the X-ray brightest of the B-star sample, both in absolute numbers and in terms of the fractional X-ray luminosity ().
Acknowledgements.
Very special thanks to Kevin Briggs for original thoughts that we tried to incorporate in this work. We would like to thank the anonymous referee for useful comments. This publication makes use of data products from the Two Micron All Sky Survey, which is a joint project of the University of Massachusetts and the Infrared Processing and Analysis Center/California Institute of Technology, funded by the National Aeronautics and Space Administration and the National Science Foundation. This research has made use of the SIMBAD database, operated at CDS, Strasbourg, France, and the Hipparcos catalogue accessed through the VizieR data base.References
- Abt et al. (2002) Abt H. A., Levato H. & Grosso M., 2002, ApJ 573, 359
- Andersen et al. (1983) Andersen J. & Nordstrom B., 1983, A&AS 52, 471
- Babel & Montmerle (1997) Babel J. & Montmerle T., 1997 A&A 323, 121
- Babel (1996) Babel J., 1996 A&A 309, 867
- Baraffe et al. (1998) Baraffe I., Chabrier G., Allard F., Hauschildt P. H., 1998, A&A 337, 403
- Berghöfer & Schmitt (1994) Berghöfer T. W. & Schmitt J. H. M. M., 1994, A&A 292, L5
- Berghöfer et al. (1996) Berghöfer T. W., Schmitt J. H. M. M., Cassinelli J. P., 1996, A&AS 118, 481 (BSC96)
- Bychkov et al. (2003) Bychkov V. D., Bychkova L. V. & Madej J., 2003, A&A 407, 631
- Cash & Snow (1982) Cash W. & Snow T. P., 1982, ApJ 263, L59
- Catanzaro & Leto (2004) Catanzaro G. & Leto P., 2004, A&A 416, 661
- Caillault & Zoonematkermani (1989) Caillault J.-P. & Zoonematkermani S., 1989, ApJ 338, L57
- Close et al. (1990) Close L. M., Richer H. B., Crabtree D. R., 1990, AJ 100, 1968
- Cutri et al. (2003) Cutri R. M., Skrutskie M. F., Van Dyk S., et al., 2003, The 2MASS All-Sky Catalog of Point Sources, University of Massachusetts and Infrared Processing and Analysis Center (IPAC/California Institute of Technology)
- Daniel et al. (2002) Daniel K. J., Linksy J., L., Gagné M., 2002, ApJ 578, 486
- Dodd (2004) Dodd R. J., 2004, MNRAS 355, 959
- de Geus et al. (1989) de Geus E. J., de Zeeuw P. T., Lub J., 1989, A&A 216, 44
- de Zeeuw et al. (1999) de Zeeuw P. T., Hoogerwerf R., de Bruijne J. H. J., Brown A. G. A., Blaauw A., 1999, AJ 117, 354
- Duquennoy & Mayor (1991) Duquennoy A. & Mayor M., 1991, A&A 248, 485
- Eggen (1963) Eggen O. J, 1963, AJ 68, 483
- Feigelson et al. (2002) Feigelson E. D., Broos P., Gaffney J. A., Garmire G., Hillenbrand L. A., et al., 2002, ApJ 574, 258
- Freeman et al. (2002) Freeman P. E., Kashyap V., Rosner R., Lamb D. Q., 2002, ApJS 138, 185
- Frost & Struve (1924) Frost & Struve, 1924, ApJ 60, 313
- Gahm et al. (1983) Gahm G. F., Ahlin P. & Lindroos K. P., 1983, A&AS 51, 143
- Gehrels (1986) Gehrels N., 1986, ApJ 303, 336
- Gerbaldi et al. (2001) Gerbaldi M., Faraggiana R., Balin N., 2001, A&A 379, 162
- Getman (2002) Getman K. V., Feigelson E. D., Townsley L., Bally J., Lada C. J., et al., 2002, ApJ 575, 354
- Hogg (1960) Hogg A. R., 1960, PASP 72, 85
- Hubrig et al. (2005) Hubrig S., Ageorges N. & Schöller M., 2005, In: Proc. of ‘Multiple Stars across the H-R Diagram’, ESO Astrophysics Symposia in press (astro-ph/0510302)
- Hubrig et al. (2001) Hubrig S., Le Mignant D., North P., Krautter J., 2001, A&A 372, 152
- Huélamo et al. (2005) Huélamo N., Chauvin G., Foellmi C., et al., 2005, In: Proc. of ‘Multiple Stars across the HR Diagram’, Jul 12-15 2005, Garching, Germany, ESO Astrophysics Symposia in press
- Huélamo et al. (2000) Huélamo N., Neuhäuser R., Stelzer B., Supper R., Zinnecker H., 2000, A&A 359, 227
- Huélamo et al. (2001) Huélamo N., Brandner W., Brown A. G. A., Neuhäuser R., Zinnecker H., 2001, A&A 373, 657
- Hünsch (2001) Hünsch M., 2001, In: Proc. of the 11th Workshop on Cool Stars, Stellar Systems and the Sun, R.J. García Lopez, R. Rebolo & M. R. Zapatero Osorio (eds.), ASP Conf. Ser. 223, 967
- Hünsch et al. (1998) Hünsch M., Schmitt J. H. M. M., Voges W., 1998, A&AS 132, 155
- Isobe (1991) Isobe S., 1991, PASAu 9, 270
- Kenyon & Hartmann (1995) Kenyon S. & Hartmann L., 1995, ApJS 101, 117
- Kouwenhoven et al. (2005) Kouwenhoven M. B. N., Brown A. G. A., Zinnecker H., Kaper L. & Portegies Zwart S. F., 2005, A&A 430, 137
- Kraft et al. (1991) Kraft R. P., Burrows D. N., Nousek J. A., 1991, ApJ 374, 344
- Landstreet (1990) Landstreet J. D., 1990, ApJ 352, L5
- Lindroos (1983) Lindroos K. P., 1983, A&AS 51, 161
- Lindroos (1985) Lindroos K. P., 1985, A&AS 60, 183
- Lindroos (1986) Lindroos K. P., 1986, A&A 156, 223
- Lucy & White (1980) Lucy L. B. & White R. L. 1980, ApJ 241, 300
- Owocki & Cohen (1999) Owocki S. P. & Cohen D. H., 1999, ApJ 520, 833
- Palla & Stahler (1999) Palla F. & Stahler S. W., 1999, ApJ 525, 772
- Pallavicini et al. (1992) Pallavicini R., Pasquini L., Randich S., 1992, A&A 261, 245
- Parker (1955) Parker E. N., 1955, ApJ 122, 293
- Parker (1993) Parker E. N., 1993, ApJ 408, 707
- Patten & Simon (1993) Patten B. M. & Simon Th., 1993, ApJ 415, L123
- Preibisch et al. (2005) Preibisch T., Kim Y.-C., Favata F., et al., 2005, ApJS 160, 401
- Preibisch & Zinnecker (2002) Preibisch T. & Zinnecker H., 2002, AJ 123, 1613
- Raymond & Smith (1977) Raymond J. C. & Smith B. W., 1977, ApJS 35, 419
- Renson (1991) Renson P., Gerbaldi M. & Catalano F. A., 1991, A&AS 89, 429
- Royer et al. (2002) Royer F., Gerbaldi M., Faraggiana R. & Gomez A.E, 2002, A&A 381, 105
- Rüdiger & Brandenburg (1995) Rüdiger G. & Brandenburg A., 1995, A&A 296, 557
- Ryter (1996) Ryter Ch. E., 1996, Ap&SS 236, 285
- Schmitt & Liefke (2004) Schmitt J. H. M. M. & Liefke C., 2004, A&A, 417, 651
- Schmitt et al. (1985) Schmitt J. H. M. M., Golub L., Harnden F. R. Jr., Maxson C. W., Rosner R., et al., 1985, ApJ 290, 307
- Schmitt et al. (1993) Schmitt J. H. M. M., Zinnecker H., Cruddace R., Harnden F. R. Jr., 1993, ApJ 402, L13
- Schneider (1981) Schneider H., 1981, A&A 44, 137
- Shatsky & Tokovinin (2002) Shatsky N. & Tokovinin A., 2002, A&A 382, 92
- Smith et al. (2001) Smith R. K., Brickhouse N. S., Liedahl D. A. & Raymond J. C., 2001, ApJL 556, L91
- Stelzer et al. (2005a) Stelzer B., Flaccomio E., Montmerle T., et al., 2005a, ApJS 160, 557
- Stelzer et al. (2005b) Stelzer B., Micela G., Huélamo N., Hünsch M., 2005b, In: Proc. of ‘Multiple Stars across the HR Diagram’, Jul 12-15 2005, Garching, Germany, ESO Astrophysics Symposia in press
- Stelzer et al. (2004) Stelzer B., Micela G. & Neuhäuser R., 2004, A&A 423, 1029
- Stelzer et al. (2003) Stelzer B., Huélamo N., Hubrig S., Zinnecker H., Micela G., 2003, A&A 407, 1067 (SHH03)
- Stelzer & Neuhäuser (2001) Stelzer B. & Neuhäuser R., 2001, A&A 377, 538
- Turon et al. (1993) Turon C., Egret D., Gomez A., et al., 1993, Hipparcos Input Catalogue, Version 2, Bull. Inf. CDS 43, 5
- Uesugi & Fukuda (1970) Uesugi A. & Fukuda I., 1970, Contr. Astroph. Kwasan Obs. Univ. Kyoto 189
- Wielen et al. (2000) Wielen R., Dettbarn Ch., Lenhardt H., Jahreiss H., Jährling R., et al., 2000, Veröffentlichungen Astronomisches Rechen-Institut Heidelberg, Verlag G. Braun, Karlsruhe (ISSN 0373-7055), No.37, 1
- Wilms et al. (2000) Wilms J., Allen A. & McCray R., 2000, ApJ 542, 914
- Wolk et al. (2005) Wolk S. J., Harnden F. R. Jr., Flaccomio E., et al., 2005, ApJS 160, 423
- Yushchenko et al. (2001) Yushchenko A. V., Gopka V. F., Khokhlova V. L. & Tomkin J., 2001, IBVS 5213, 1