HI 21cm observations of the PG1216+069 sub-DLy absorber field at
Abstract
The Westerbork Synthesis Radio Telescope finds a weak 21cm line emission feature at the coordinates (RA-Dec-velocity) of the sub-Damped Lyman- absorber observed at in the spectrum of PG1216+069. The emission feature, WSRT-J121921+0639, lies within of the quasar sightline, is detected at 99.8% (3) confidence level, has between 5 and 15M⊙, and has velocity spread between 20 and 60 km s-1. Other HI emitters in the field include VCC297 at a projected distance of kpc and a previously unreported HI cloud , WSRT-J121919+0624 at kpc with M⊙. The optically identified, foreground galaxy that is closest to the quasar sightline appears to be VCC339 () at kpc and velocity offset 292 km s-1 . A low surface brightness galaxy with the HI mass of the sub-DLA absorber WSRT-J121921+0639 would likely have m, and its diffuse optical emission would need to compete with the light of both the background QSO and a brighter foreground star 10′′ from the QSO sight line.
1 Introduction
The goal of clarifying the nature of QSO absorption line systems drives the interest in extreme low redshift absorption systems such as the “sub-Damped Lyman-” absorber in the sight line to the AGN PG1216+069. At a heliocentric redshift velocity of 1895 km s-1, the absorber falls in the outskirts of the Virgo Cluster, where its association with a particular galaxy host or group/cluster environment should become clear through observation. Tripp et al.s’ recent, comprehensive study of PG1216+069 (Tripp et al., 2005) makes it clear that (1) the metallicity is low, [O/H]-1.6, but at a characteristic level for high redshift absorbers, (2) there is no detected optical emission from the absorber itself nor an obvious association with a specific galaxy in the field, and (3) the HI column density through the absorber cm-2 is a factor 10 below the Damped Lyman- (DLA) class. While the lower limit to DLA column density cm-2 was originally set as a completeness limit in the early surveys (Wolfe et al., 1986), this column density also takes on physical significance in disk galaxies, since it is typical of the threshold column density for the onset of star formation (Kennicutt, 1989). Zwaan et al. (2005) used an extensive data set of 21cm line observations to demonstrate the consistence between QSO absorption line statistics and the cross sections that galaxies present for absorption. Zwaan et al. further demonstrate that the decline in metal abundance for low column density absorbers agrees with abundance gradients in the outskirts of nearby galaxies.
QSO absorption statistics indicate through the distribution (Tytler, 1987; Petitjean et al., 1993) that populations of low column density absorbers present larger cross sections than the DLA class, implying that clouds with cm-2 may be more common than the higher ones in spiral galaxy disks. Radio telescopes routinely observe well below this level, thereby providing the incentive for a WSRT reconnaissance into the PG1216+069 field. Kanekar & Chengalur (2005) observed this field with GMRT within the same time frame without detecting the new features we report here.
2 The WSRT Observations
The Westerbork Synthesis Radio Telescope (WSRT) observed the field centered on PG1216+069 in “filler time” scheduled through the interim proposal system. Rather than a single long integration in one 12 hour integration, the observation consists of two shorter runs. On 2004 August 14, the first session, covering extreme negative hour angles, produced 4.5 hours on source in the “2144m” configuration (with RT9 to movable telescope distances of 144, 288, 1368, and 1440 meters). On 2004 August 27, the second session covered 4 hours of extreme positive hour angles in the “Maxi-short” configuration (RT9 to movable telescopes distances of 36, 90 133, 1404 meters). The DZB spectrometer analyzed both linear polarizations with a 10 MHz (2000 km s-1) band centered on heliocentric redshift velocity 1900 km s-1 with 256 spectral channels per polarization to obtain channel spacing of 8.3 km s-1 or velocity resolution of 16.5 km s-1 after Hanning smoothing.
For an east-west array such as WSRT, observing sources close to the celestial equator has two important consequences: The negative one is that the telescope resolution in the north-south direction deteriorates at low declination as , so that the best resolution possible for PG1216+069 is a north-south fan beam of 10813′′. The positive consequence is that all projected baselines foreshorten at large hour angle as , so that the apparent lack of short spacings in the “2144m” configuration data does not damage the surface brightness sensitivity to extended emission. Short spacing sensitivity is limited to 25m projected spacings in order to avoid shadowing of one dish by its neighbor, causing the observation to be insensitive to smooth structure on angular scales larger than 15 arcminutes (115 kpc).
Data processing steps included editing, calibration and application of different weighting schemes in the synthesis imaging software packages AIPS and MIRIAD. This produced spectral line data cubes with a range of resolution and noise level, summarized in Table 1. For each of three weighting schemes, the table lists the angular resolution and noise level measured from the processed data cubes. Assuming that the emission fills the synthesized beam solid angle leads to a surface brightness sensitivity () and column density sensitivity ( cm-2). The table includes estimates of the flux density that a beam filled with cm-2 would produce, along with the HI mass contained within the beam (M⊙), assuming the distance of 26.6 Mpc, which Tripp et al. (2005) adopted.
Analysis of the continuum image formed from the average of the channels free of HI signal found that PG1216+069 had a continuum flux density of 2.70.2 mJy at 1416 MHz (consistent with the 2.80.3 mJy measurement of Kanekar & Chengalur (2005)). The NVSS survey (Condon et al., 1998) indicates an upper limit 1.9 mJy (), while VLBA observations indicated compact structure of 5.70.3 mJy in the period 1999-2000 (Ulvestad et al., 2005). The PG1216+069 AGN appears to be a variable radio source.
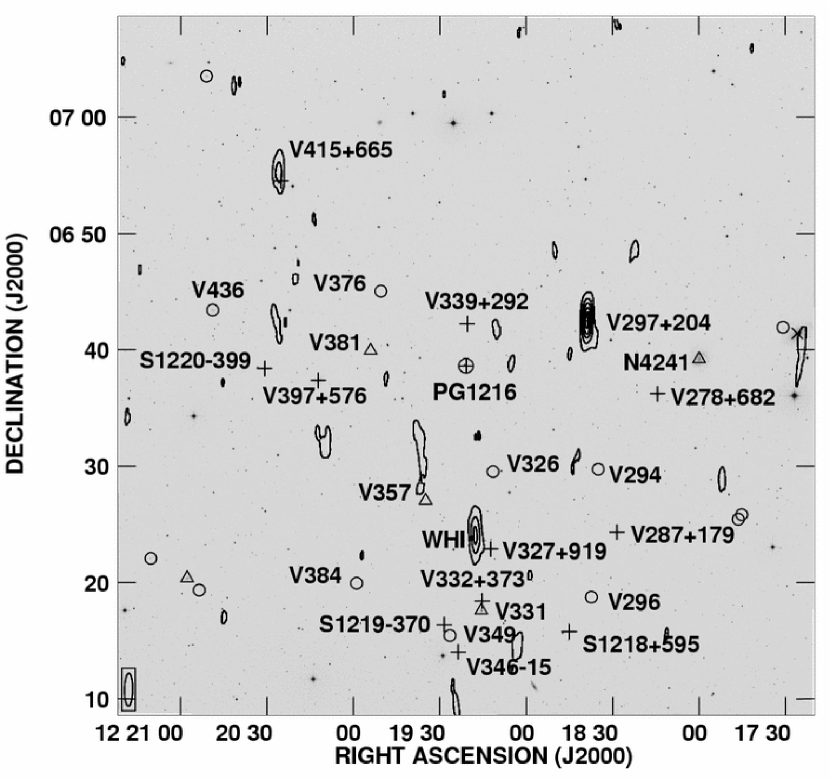
Figures 1 and 2 summarize the observational results. Fig 1 presents contours of the integral line emission, obtained from the zeroth moment of the spectral channels after automated masking using a smoothed version of the cube. The image is 1 degree on a side, corresponding to 460 kpc. The half power beam width of the WSRT primary beam is 35 arcmin, so the outer regions of HI map include the first null of the pattern. Table 2 lists the galaxies with redshift less than 3000 km s-1 within 25 arcmin of the PG1216+069 sight line; many of these are marked in Fig 1. Figure 2 presents spectra for selected areas of the image.
3 Discussion
Figure 1 shows three significant detections for systems VCC297, VCC415, and a previously unreported HI emitter, here named WSRT-J121918+0624, centered at coordinates 12h19m17s.6, 06∘24′06′′ (J2000), close in the sky to VCC327. The HIPASS online database111http://www.atnf.csiro.au/research/multibeam/release/ shows this feature with significance. The HI mass in WSRT-J121918+0624 amounts to contained in a gaussian profile of FWHM 38 km s-1 centered on 1963 km s-1, but the 800 km s-1 difference in redshift from VCC327 suggest that this is but chance alignment between two unassociated objects. However, the NED222http://ned.ipac.caltech.edu/ indicates that there are at least seven objects (NGC4223, VCC287, VCC297, VCC332, WSRT-J121918+0624, VCC339, VCC346) with velocities in the 400 km s-1 range 1870 to 2270 within a 300 kpc square area projected on the sky. There is weak evidence that WSRT-J121918+0624 is extended toward the NE, in which case the morphology would be typical of tidal debris from interactions within the overdensity, similar to the structures seen in Ursa Major (Verheijen & Sancisi, 2001) and elsewhere in Virgo (Chengalur et al., 1995; Oosterloo & van Gorkom, 2005).
The catalogued galaxy closest to the PG1216 sight line is VCC329 with a velocity offset of 292 km s-1 relative to the sub-DLA, but there is no hint of an HI signal in the WSRT data (see Fig 2).
Inspection of the spectrum along the line of sight to PG1216+069 reveals a weak emission feature at , overlapping the velocity of the sub-DLA absorber. The peak strength is 1.70.55mJy; for well behaved noise, there is only a 0.14% probability of a 3 positive deflection occurring in a pre-chosen pixel by chance. The velocity width is not well constrained, and considering widths in the range 20-60 km s-1 would indicate HI masses of 5 to 15. The strength of the feature is between 1.5 and 1.7 mJy per beam for all three synthesized beams in Table 1, implying that a large fraction of the emission is likely to be contained within the beam. Unless the HI spatial distribution is similar in shape to the elongated beam, the HI column density must vary in places to values above that specified by the damping wing profile of Tripp et al. (2005). The signal strength measured by WSRT indicating 5 for a 16 km s-1 velocity width is compatible with the GMRT upper limit of 11 for a 20 km s-1 velocity width and angular resolution.
A rough rule of thumb for estimation of the optical brightness of a late type, gas rich galaxy is (Briggs, 1990). An translates to -14.9, with large scatter. With a distance modulus equal 32.1, the integral optical emission would be magnitude 17 and possibly much dimmer as would be typical of a low mass, diffuse LSB system. The optical emission must compete with the QSO light (magnitude 15.84, 15.65, and 15.61 in the B, and bands, respectively) and a star 10′′ away that is tabulated at (according to Kirhakos et al. (1994) derived from an image in which it is saturated). The APMCat333http://www.ast.cam.ac.uk/apmcat/ evaluates the sum of the star plus QSO as and .
4 Conclusions
The HI emission properties of the PG1216+069 sub-DLA absorber are consistent with expectations based on the low column density, low metallicity and absence of optical emission from a clear host galaxy. Low column density below the star formation threshold means that the lack of star formation locally along the line of sight is no surprise. A low metallicity cloud with no connection to a optically identified host galaxy is compatible with the sub-DLA originating in a tiny, extreme low surface brightness dwarf of primitive composition or being a diffuse cloud in the outer halo of a galaxy such as VCC339 or VCC297. The additional presence in this field of the more massive cloud WSRT-J121918+0624 may argue for an origin for both features as tidal debris in this overdense volume. (The tranverse dimension of the field in Fig. 1 is 460 kpc, thus fitting easily within Local Group, for example.)
Further progress might be made by (1) longer integrations on this field with the goal of tracing low column density structures that may form a more obvious link to the visible galaxies in this overdensity and (2) more extensive, deep HI mapping in several other fields to identify examples of objects (dwarfs or halo clouds) in more favorable situations (i.e., without optically bright QSOs cluttering the field). Such populations might account for the sub-DLA and Lyman-limit absorption cross sections.
References
- Briggs (1990) Briggs, F. H. 1990, AJ, 100, 999
- Chengalur et al. (1995) Chengalur, J. N., Giovanelli, R., & Haynes, M. P. 1995, AJ, 109, 2415
- Condon et al. (1998) Condon, J. J., Cotton, W. D., Greisen, E. W., Yin, Q. F., Perley, R. A., Taylor, G. B., & Broderick, J. J. 1998, AJ, 115, 1693
- Kanekar & Chengalur (2005) Kanekar, N., & Chengalur, J. N. 2005, A&A, 429, L51
- Kirhakos et al. (1994) Kirhakos, S., Sargent, W. L. W., Schneider, D. P., Bahcall, J. N., Jannuzi, B. T., Maoz, D., & Small, T. A. 1994, PASP, 106, 646
- Kennicutt (1989) Kennicutt, R. C. 1989, ApJ, 344, 685
- Oosterloo & van Gorkom (2005) Oosterloo, T., & van Gorkom, J. 2005, A&A, 437, L19
- Petitjean et al. (1993) Petitjean, P., Webb, J. K., Rauch, M., Carswell, R. F., & Lanzetta, K. 1993, MNRAS, 262, 499
- Tripp et al. (2005) Tripp, T.M., Jenkins, E.B., Bowen, D.V., Prochaska, J.X., Aracil, B., and Ganguly, R. 2005, ApJ, 619, 714
- Tytler (1987) Tytler, D. 1987, ApJ, 321, 49
- Ulvestad et al. (2005) Ulvestad, J. S., Antonucci, R. R. J., & Barvainis, R. 2005, ApJ, 621, 123
- Verheijen & Sancisi (2001) Verheijen, M. A. W., & Sancisi, R. 2001, A&A, 370, 765
- Wolfe et al. (1986) Wolfe, A. M., Turnshek, D. A., Smith, H. E., & Cohen, R. D. 1986, ApJS, 61, 249
- Zwaan et al. (2005) Zwaan, M. A., van der Hulst, J. M., Briggs, F. H., Verheijen, M. A. W., & Ryan-Weber, E. V. 2005, MNRAS, 364, 1467
| (pred) | (pred) | ||||
|---|---|---|---|---|---|
| arscsec2 | mJy/beam | K | 1018cm-2 | mJy | 106 M⊙ |
| 11216 | 0.57 | 0.27 | 8.2 | 1.4 | 4 |
| 16942 | 0.61 | 0.07 | 2.2 | 5.7 | 15 |
| 23545 | 0.71 | 0.06 | 1.8 | 8.6 | 23 |
Notes: Columns give (1) half-power beam widths of synthesized beam, (2) rms noise level achieved in flux density in a single spectral channel, (3) rms sensitivity in brightness temperature, (4) rms sensitivity in HI columns density per 16.6 km s-1 velocity resolution, (5) the expected flux density if the beam were filled with cm-2 emission in 16.6 km s-1 , and (6) the HI mass contained in the beam, if filled with cm-2.
| Galaxy | Rel. Velocity | Proj. Separation |
|---|---|---|
| km s-1 | kpc | |
| V339 | 292 | 29 |
| V381 | -1414 | 65 |
| V326 | … | 72 |
| V376 | … | 76 |
| V297 | 104 | 86 |
| V357 | 1113 | 93 |
| V397 | 576 | 99 |
| V294 | … | 112 |
| W1216+064 | 68 | 112 |
| V327 | 919 | 123 |
| V278 | 682 | 129 |
| S1220+0638 | -399 | 134 |
| V287 | 179 | 149 |
| NGC4241 | -1162 | 155 |
| V332 | 373 | 156 |
| V384 | … | 161 |
| V331 | -1238 | 162 |
| S1219+0616 | -370 | 172 |
| V436 | … | 173 |
| V415 | 665 | 173 |
| V296 | … | 174 |
| V349 | … | 179 |
| S1218+0615 | 595 | 189 |
| V346 | -15 | 190 |
Notes: Galaxy names use V to indicate the VCC, S to signify an abbreviated SDSS entry and W for WSRT. The galaxy velocites are relative to the sub-DLA at 1895 km s-1. Projected separation of the sight line assumes a distance of 26.6 Mpc.