The Extended Starformation History of the First Generation of Stars, and the Reionization of Cosmic Hydrogen
Abstract
Population-III (Pop-III) starformation (SF) is thought to be quenched when the metallicity of the star-forming gas has reached a critical level. At high redshift, when the general intergalactic medium (IGM) was enriched with metals, the fraction of primordial gas already collapsed in minihalos (above the Jeans mass but below the mass corresponding to the efficient atomic cooling threshold for SF) was significantly larger than the fraction of primordial gas that had already been involved in Pop-III SF. We argue that this reservoir of minihalo gas remained largely in a metal-free state, until these minihalos merged into large systems (above the hydrogen cooling threshold) and formed stars. As a result, the era of Pop-III SF was significantly prolonged, leading to a total integrated Pop-III SF that was an order of magnitude larger than expected for an abrupt transition redshift. We find that the contribution of Pop-III SF to the reionization of hydrogen could have been significant until and may have extended to redshifts as low as . Our modeling allows for gradual enrichment of the IGM, feedback from photo-ionization and screening of reionization by minihalos. Nevertheless, the extended epoch of Pop-III SF may result in complex reionization histories, where multi peaks are possible over some regions of parameter space. The relative contribution of Pop-III stars to reionization can be quantified and will be tested by three-year WMAP results: (1) if Pop-III stars do not contribute to reionization, and a rapid reionization at are expected with the mean neutral fraction quickly exceeding at ; (2) if the product of star formation efficiency and escape fraction for Pop-III stars is significantly larger than that for Pop-II stars, then a maximum is achievable; (3) in a perhaps more plausible scenario where the product of star formation efficiency and escape fraction for Pop-III stars is comparable to that for Pop-II stars, would be observed, with reionization histories characterized by an extended ionization plateau from where the mean neutral fraction stays in a narrow range of . This result holds regardless of the redshift where the IGM becomes enriched with metals.
1 Introduction
Following cosmological recombination at a redshift , the baryonic gas filling up the universe became predominantly neutral. Given that this gas is known to be mostly ionized today, one arrives at one of the major questions in current extragalactic astronomy, namely, when was the cosmic hydrogen re-ionized, and what were the sources responsible? Recent observations have begun to provide preliminary answers to this question. The absorption spectra of SDSS quasars at indicate that the neutral fraction of hydrogen increases significantly at (Becker et al. 2001; Fan et al. 2002; Cen & McDonald 2002; Pentericci et al. 2002; White et al. 2003; Wyithe & Loeb 2004; Mesinger & Haiman 2004; Fan et al. 2005). On the other hand, analysis of the first year data from the WMAP satellite suggests a large optical depth to electron scattering , implying that the universe was significantly reionized at redshifts as high as (Kogut et al. 2003; Spergel et al. 2003). While this result is not surprising in view of earlier calculations of the reionization history by metal-free stars (e.g. Wyithe & Loeb 2003a; Cen 2003a), it offers an intriguing empirical path for answering questions regarding the sources of reionization.
Several authors have pointed out that the combination of these results can only be reconciled with an extended or multi-peaked reionization history (Wyithe & Loeb 2003a,c; Cen 2003a,b; Chiu, Fan, & Ostriker 2003; Haiman & Holder 2003; Somerville et al. 2003; Gnedin 2004). A common feature of these models is that the first generation of stars plays a significant role. The first stars in the universe (Pop-III) formed out of metal-free gas, relic from the big bang. Simulations of metal-free star formation indicate that the first stars may have high masses (), since gas cooling by molecular hydrogen (H2) cannot lower the gas temperature below K (Bromm, Coppi, & Larson 2002; Abel, Bryan & Norman 2002). Massive, metal-free stars shine at their Eddington luminosity, , and have roughly constant effective (surface) temperatures of K and lifetimes of yr, independent of their mass (Bromm, Kudritzki, & Loeb 2001). This implies that the number of ionizing photons produced per baryon incorporated into these stars () was independent of their mass function, and larger by more than an order of magnitude than that of the observed Population-II (Pop-II) metal-rich stars. As a result, the emissivity of ionizing photons may be double peaked, leaving open the possibility of an early reionization by Pop-III stars, with an epoch of recombination following enrichment of the IGM above the critical threshold, before a final reionization by Pop-II stars near . Indeed, the observed enrichment of the IGM is consistent with a substantial contribution from Pop-III stars (Oh, Nollett, Madau & Wasserburg 2001). On the other hand, it has been suggested that the non-monotonic behavior of these models is due to the assumption of a sharp transition in metallicity (Furlanetto & Loeb 2005). These authors find that the various feedback mechanisms lead to an extended but monotonic reionization history.
In this paper we develop a model which follows the densities of primordial and enriched gas in collapsed systems, and compute co-dependent SF, reionization and metal enrichment histories. While our model is more detailed than many previous semi-analytic approaches in several respects, the primary qualitative difference is that Pop-III SF is allowed to proceed in gas that had already collapsed in minihalos prior to enrichment of the IGM, but which has not formed stars, even when the general IGM has been enriched to a high metallicity level. We motivate the physics of this conclusion, in addition to modeling its consequences for the reionization history. We show that the additional post enrichment Pop-III SF boosts the total integrated Pop-III SF by an order of magnitude in typical cases.
Throughout the paper we assume cosmological parameters obtained through fits to WMAP data (Spergel et al. 2003). These include density parameter values of in matter, in baryons, in a cosmological constant, and a Hubble constant of (or equivalently ). For calculations of the Press-Schechter (1974) mass function (with the modification of Sheth & Tormen 1999) we assume a primordial power-spectrum with a power-law index and the fitting formula to the exact transfer function of Cold Dark Matter, given by Bardeen et al. (1986). We adopt an rms amplitude of for mass density fluctuations in a sphere of radius Mpc.
2 Ionizing radiation from Pop-III and Pop-II Stars
We make the distinction between the ionizing radiation field due to a possible early population of zero-metallicity stars, and the metal enriched stars observed at lower redshifts. It is thought that the primordial initial mass function favored massive stars (Bromm, Copi & Larson 1999, 2001; Abel, Bryan & Norman 2000; Mackey, Bromm, Hernquist 2002). The possible existence of this population is very important for reionization because the spectrum of these stars would result in an order of magnitude more ionizing photons per baryon incorporated into stars (Bromm, Kudritzki, & Loeb 2001). The formation of the very massive stars is suppressed as the material out of which stars form is enriched with metals. The fraction of the ionizing photons produced by metal-free stars depends on several unknown parameters, including the mixing efficiency of metals, the environments in which new stars form, and most importantly, the threshold metallicity above which star formation is transformed from being dominated by massive stars to a Scalo (1998) initial mass function (IMF). The threshold metallicity is believed to be small; Bromm et al. (2001) argue for a threshold of the solar metallicity value. The efficiency of mixing of metal enriched outflows from star forming galaxies to the surrounding IGM is even more uncertain; Scannapieco, Ferrara & Madau (2002) and Ricotti & Ostriker (2004) find that the mass weighted mean metallicity can reach values greater than of the solar value at redshifts as high as 20, and note that the average metallicity scales with star formation efficiency, supernova rate, and the fraction of supernova energy that is channeled into outflows. In a representative region of the IGM, the average metallicity increases roughly exponentially with redshift as it is modulated by the exponential growth in the collapse fraction of baryons at high redshifts. We therefore define a transition redshift below which metal-rich stars with a Scalo (1998) IMF dominate the production rate of ionizing photons. However, because enrichment will not occur at the same time in all parts of the IGM, we allow for a spread in the transition redshift. We assume a Gaussian probability function with variance , so that the fraction of IGM that is enriched at redshift is given by
| (1) |
The effectiveness of a stellar population in ionizing hydrogen in the IGM can be parameterized in terms of the number of ionizing photons produced per baryon incorporated into stars (). Throughout the paper we assume Pop-III stars to be massive () zero-metallicity stars with the generic spectrum calculated by Bromm, Kudritzki & Loeb (2001). The resulting value is . We assume metal enriched stars (1/20th solar metallicity) to have a Scalo (1998) mass-function, and use spectral information from the stellar population model of Leitherer et al. (1999)111Model spectra of star-forming galaxies were obtained from http://www.stsci.edu/science/starburst99/.. This results in a value of .
3 Enrichment of primordial gas
Throughout the paper we assume that star-formation is initiated through atomic hydrogen cooling, and so implicitly assume the rapid destruction of molecular hydrogen in the IGM by a back-ground of UV photons; molecular hydrogen had been destroyed long before the universe, on average, became significantly ionized (an ionized fraction of ) (Haiman, Rees & Loeb 1997; Oh & Haiman 2003). Therefore, at the time when the IGM started to become enriched to the critical level for Pop-II SF there was significant gas already collapsed in minihalos (halos above the cosmological Jeans mass, but below the minimum mass for SF) that had virial temperatures which were too low to initiate SF (see § 4.4). If this gas was preserved in its primordial state until SF was initiated through formation of a sufficiently massive system, then the epoch of Pop-III SF could have been increased to redshifts significantly below .
3.1 Enrichment of Virialized Primordial Gas In Minihalos
It is often assumed that metal enrichment of the intergalactic medium (IGM) implies metal enrichment of all gas in the universe (e.g., Wyithe & Loeb 2003a,b; Cen 2003a,b Furlanetto & Loeb 2005). We shall point out that this simple assumption is incorrect, which, as we will show, may lead to qualitatively different conclusions with regard to contributions of Pop-III stars to cosmological reionization. A critical point to note is that metal enrichment process facilitated by shockwaves carrying metals generated in stars is a strong function of the density of the gas that is being enriched. In particular, we will make the distinction between metal enrichment of the average IGM and metal enrichment of gas that is inside already formed halos.
Let us consider metal enrichment of gas in minihalos when a blastwave of velocity sweeps through the IGM. This is equivalent to the case of a gas cloud moving through a background medium with velocity . The gas cloud may be subject to a host of hydrodynamical instabilities, including Kelvin-Helmholtz and Richtmeyer-Meshkov instabilities, through which metal mixing occurs. Several authors (Murray et al. 1993, M93 hereafter; Klein, McKee, & Colella 1994; Dinge 1997; Miniati et al. 1997) have shown that a non-self-gravitating gas cloud moving at the sound speed of the background medium gets disrupted on a time scale of the dynamic time of the cloud. Self-gravity, in our case by the dominant dark matter in a minihalo, could stabilize the gas cloud. M93 studied the case of self-gravitating, non-cooling gas clouds moving through a background medium in the context of a two-phase medium. The gas clouds in our minihalos are physically identical to the case considered by M93 in that there is little cooling (due to lack of cooling agents at the low temperature), and the gas cloud is confined by gravitational potential well of the dark matter minihalo. Therefore, we may draw directly upon the calculations by M93 to quantify the whether or not gas clouds in minihalos survive enrichment of the IGM. M93 show both analytically and by simulations that the stability condition for a gas cloud moving through a background medium requires the surface gravity of a cloud to be greater than
| (2) |
where is the density ratio of the gas cloud to the background gas, is the radius of the gas cloud. If we define as
| (3) |
then we find that
| (4) |
where we have assumed that the density slope near the virial radius is (Navarro, Frenk, & White 1997); is the mass of the minihalo within its virial radius; is the mass with radius , is redshift. M93 show at only and of the gas is lost after and times the dynamic time of the cloud, which is about the Hubble time. However, they also note that even at , the gas mass loss is still relatively small.
While might be large in the immediate vicinity of a shockwave-producing galaxy, one does not expect to be large at large distances. Mori, Ferrara, & Madau (2002) show, in simulations of propagation of supernova blastwaves from galaxies at , that after more than a hundred million years the relative filling factor for regions being swept by shocks of velocities larger than is roughly . We expect the velocities to be still smaller at the higher redshifts of concern here, due to enhanced cooling and larger Hubble velocity. We see from equation (4) that if of the gas within virialized regions of halos more massive than will have and be relatively un-affected by the shockwaves. This fraction is reduced to and for and , respectively. For lower mass mini-halos () close to the Jeans mass (§ 4.1), we find for a smaller velocity of . However is a high power of the fraction of gas in the halo that is subject to instabilities. Thus even for halos of mass , and winds of velocity km/s and km/s we find values of and yield . Combining these results, we expect that most of the gas already virialized with minihalos will be largely unaffected by metal-carrying blastwaves and remain metal-free until its first episode of starformation.
In addition to direct enrichment, there is the possibility that virialized primordial gas in mini-halos could be enriched during the process of mergers with other mini-halos containing enriched gas. We do not expect this to be the case for the reasons outlined below. Following the transition redshift, if the blastwaves that carry metals sweep through the IGM with a velocity of order of km/s, the IGM may be collisionally ionized. The collisionally heated IGM subsequently cools via the Compton cooling process (by the cosmic microwave background), and at the same time recombines in the absence ionizing sources. We find that collisionally ionized gas would be Compton-cooled and saturate at a temperature of K (depending on the initial temperature) after about a Hubble time at ; at 1/4 of the Hubble time K. Hence, IGM that is heated at the redshift of interest will not be able to cool below K by radiative processes. Subsequent cooling is primarily due to adiabatic expansion, which could achieve a temperature reduction by a factor of a few for the redshift range of interest. For a IGM of K at the Jeans mass is , which is close to the threshold mass for atomic cooling (see equation 7 below). Therefore, metal-enriched and heated IGM is likely to be prevented from further accreting onto all minihalos, new and old. Thus, gas in collapsed minihalos will not be contaminated by enriched IGM gas and will remain metal-free, and newly formed minihalos will be gas-free.
To be extremely conservative, let us consider the case where the metal-enriched and heated IGM is assumed to have cooled to the temperature of the cosmic microwave background. Gas from the IGM can enter mini-halos with M⊙ either through mergers of smaller collapsed objects, or through accretion from the IGM. In the former case, the cold gas content is primordial because accretion from the IGM at the temperature of the cosmic microwave background is suppressed in low mass mini-halos. In the latter case we argue that newly accreted gas into more massive mini-halos is unlikely to be as dense as the gas already at the virial radius. This may be seen as follows. An estimate of the non-linear overdensity of baryons inside a virialized object is
| (5) |
where is the density of baryons inside the virialized object of temperature , and and are the background baryon density and temperature respectively (Barkana & Loeb 2001). At redshifts below , and in the absence of a heating source the temperature of an adiabatically cooling IGM is K (Peebles 1993). This temperature is substantially lower than the temperature of the cosmic microwave background, . Thus primordial gas, which has not been subjected to heating accretes into a dark-matter halo with an initial temperature that is substantially lower than does primordial gas which has been heated by the enriching blast-wave before being Compton cooled to the temperature of the cosmic microwave background. From equation (5) we therefore find that the ratio of overdensities of primordial to enriched gas following virialization is . This result suggests that in the absence of cooling, enriched gas would be prevented from significantly penetrating the minihalo, so that mixing is expected to be inefficient. As a result primordial gas is not expected to become contaminated during hierarchical growth of mini-halos.
Upon merging to form a system large enough to initiate SF, does the primordial gas in mini-halos form stars before becoming enriched by other SF in the galaxy? This is expected to happen to some extent. But “other” SF that occurred earlier would have been Pop-III SF. Therefore, the question is not whether Pop-III SF will occur or not, but rather what the efficiency of Pop-III formation will be. We do not have a quantitative answer to this at present. It seems plausible to expect that the first SF would occur in the largest mass clump in the galaxy. If the largest mass clump makes up a significant fraction of the total mass of the galaxy, then the overall SF formation efficiency may be largely determined by the SF efficiency within that largest mass clump. We will therefore assume, following conventional wisdom, that Pop-III SF proceeds with efficiency .
In summary, the above discussion leads us to explore the effect of the following hypothesis on the Pop-III SF history, and on the reionization history of cosmic hydrogen. We assume that virialized primordial gas within mini-halos is not enriched by super-galactic winds. Virialized primordial gas is not enriched following accretion of enriched gas from the IGM, or during the mergers of mini-halos. As a result, primordial virialized gas remains in its primordial state until such time as its host halo grows to be massive enough to initiate a burst of Pop-III SF.
4 Evolution of the density of gas in halos
In order to compute the effect of IGM enrichment on the SF history, we need to follow the density of enriched and primordial gas through the hierarchical merging of halos. This section introduces a method for following this evolution. During hierarchical galaxy formation, an average property of the galaxy population, such as the density of galaxies evolves in redshift due to newly collapsing halos, mergers of halos and accretion. We begin by discussing the critical mass-scales in galaxy formation. We then discuss calculation of the rate of newly collapsing halos, before describing how this quantity, along with the merger rates of galaxies can be used as source and sink terms in differential equations that describe the average evolution of the gas content of the galaxy population.
4.1 Critical Mass Scales
There are four critical mass scales affecting galaxy formation. The first is the Jeans mass, which corresponds to the smallest mass halo into which gas can accrete from the IGM. By considering the response of a baryonic overdensity to the potential well of a dark-matter halo one can find the mass scale at which the baryonic overdensity reaches 100. We take this mass scale to represent the Jeans mass (Barkana & Loeb 2001)
| (6) |
The second mass scale corresponds to the virial temperature above which gas that has accreted into a halo can cool efficiently. We assume this scale to be determined by atomic cooling, and so to correspond to a virial temperature below K. The corresponding mass is therefore
| (7) |
where , and (see Barkana & Loeb 2001 for more details). The third mass scale becomes important following the reionization of a region of IGM at which time it is heated to K. The Jeans mass is increased by several orders of magnitude, and numerical simulations find that gas infall is suppressed in halos with . There is some disagreement as to the exact value of the halo circular velocity below which gas infall is completely suppressed (e.g. Thoul & Weinberg 1996; Kitayama & Ikeuchi 2000; Quinn, Katz & Efstathiou 1996, Weinberg, Hernquist & Katz 1997; Navarro & Steinmetz 1997; Dijkstra, Haiman, Rees & Weinberg 2004). In what follows we assume a post-reionization minimum temperature of , and note that the assumption of a smaller temperature will not qualitatively effect our conclusions. Thus we have
| (8) |
Finally, the fourth characteristic mass is the non-linear mass-scale (), which corresponds to the co-moving length scale over which typical fluctuations (i.e. 1-sigma fluctuations) in the linear density field have a value of . Here is the co-moving density of matter, is the linearly extrapolated overdensity at the time of collapse for a dark matter halo, and is the growth factor at redshift . For the cosmology employed in this paper, and at redshifts , a good fit to the dependence of the non-linear mass scale on redshift is given by
| (9) |
From equation (9) we see that moves through the Jeans mass at , and the mass corresponding to the hydrogen cooling threshold () at . The non-linear mass-scale corresponds to the typical mass of newly forming galaxies. Equation (9) therefore encapsulates the reason why reionization is expected to occur at redshifts between and . Reionization is a self-limiting process because the non-linear mass-scale does not reach until .
4.2 Primordial Gas In Collapsed Systems At
Prior to the enrichment of the IGM with metals produced by the first stars the gas content of collapsed systems below the critical threshold for SF (minihalos) was metal-free. Systems above the critical threshold had an initial burst of metal-free SF, but then presumably became enriched internally so that subsequent SF was metal enriched. Following enrichment of the IGM to a metallicity above a critical value, gas that was newly accreted from the IGM was enriched, and so resulted in Pop-II SF. However, the metal-free gas in minihalos would not have been enriched and would have moved through mergers into larger systems. When this metal-free gas became part of a galaxy above the SF threshold, further Pop-III SF would have been possible, even significantly after the IGM became enriched. Indeed, if one calculates the collapsed fraction of gas in galaxies at with masses above the Jeans mass, to the collapsed fraction above the mass corresponding to the minimum for SF () one finds that the collapsed fraction differs by a factor of 20! Figure 1 shows the ratio of collapsed fractions above and the Jeans mass as a function of redshift. The majority of metal-free gas that has accreted into collapsed systems at the time of enrichment has not yet formed stars. As a result the time of enrichment may not correspond to the time when Pop-III SF ends. Indeed the fraction of the Pop-III SF during the history of the universe that has taken place by the transition redshift could be as low as the ratio shown in Figure 1. We therefore expect most Pop-III SF to take place at redshifts below .

4.3 The Rate of Newly Collapsing Dark-Matter Halos
To follow the evolution of primordial gas in a hierarchical cosmology we first need to compute the collapse rate of new halos. Let be the Press-Schechter (1974) mass function (number of halos with mass between and per co-moving Mpc3) of dark-matter halos at redshift . The rate of change of the density of dark matter halos between and is therefore . Let us also define (Lacey & Cole 1993) the number of mergers per unit time of halos of mass with halos of mass (forming new halos of mass ) at redshift . We find the component of the change in density with redshift of halos having masses between and that is not due to mergers. This is given by the overall change in the density of halos with mass , minus the change in density due to merger of halos to form a new halo of mass , plus the change in density of halos of mass that merge with other halos. The collapse rate of new halos may be written
| (10) |
The value of equals the net change in density due to newly collapsed halos of mass .
4.4 The Evolution Of The Primordial Gas Content Of Galaxies
Our next step is to find the evolution of the density of metal-free gas per halo mass . Note that this density refers to a density of gas that has not been in a galaxy at a time when it underwent a burst of SF. We assume that if a halo forms with a mass larger than the Jeans mass , or if the mass of a halo grows through a merger to become larger than , then enough gas accretes inside the virial radius so that the mass of gas inside the halo becomes , where is the fraction of the mass-density in baryons. Therefore, if the halo mass is larger than , then the total density of gas inside halos in a small mass-range between and is
| (11) |
Our aim is to compute the effect of metal enrichment on the density of cold, metal free gas inside galaxies of mass .
Prior to enrichment of the IGM, the gas in galaxies where SF has not occurred remains metal-free. Following enrichment, newly accreted gas is metal enriched. In neutral regions the gas inside halos below is not photo-evaporated, and so, at least initially some halos with masses below will contain metal-free gas. This gas will move into larger halos during subsequent mergers. We can calculate the density of metal-free gas that remains in these low mass halos following enrichment of the IGM. If two halos and merge to form a new larger halo with a mass smaller than , then the average mass of metal-free gas in the new halo will equal the sum of the average masses of metal-free gas in each of the initial halos .
We can therefore write down the evolution of the density of primordial gas which we denote (recall that this density refers to a density of gas that has not been in a galaxy at a time when it underwent a burst of SF)
| (12) |
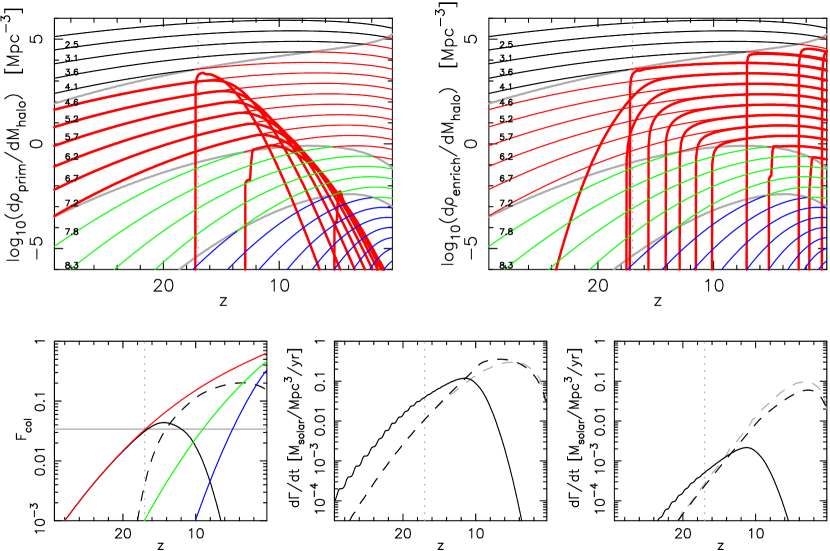
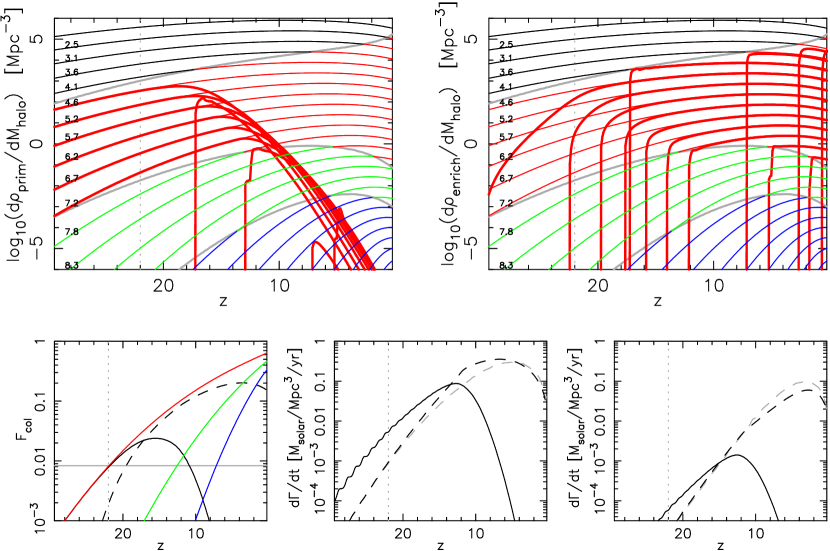
The first equation of (4.4) is valid in neutral regions, while once the region become ionized any remaining primordial gas is photo-evaporated out of the minihalos on the halo dynamical timescale (), where it then becomes enriched, so that . The first line contains two terms that relate to regions of IGM that have not yet been enriched. The first term corresponds to a source of collapsing halos into which metal-free gas accretes. The second term corresponds to a source of gas accumulation in halos above the Jeans mass. This accumulation is the sum of gas that was already in halos if the progenitor was above the Jeans mass, and gas newly accreted from the IGM if it was not. The third term (second line) corresponds to regions with enriched IGM and describes the movement of primordial gas from small halos to large halos during mergers. The fourth term describes the loss of gas density in halos of mass that results from the merger of those halos to form larger systems. The primordial gas density in halos smaller than the Jeans mass or larger than is zero. The upper left panels of figures 2 and 3 show the evolution of the primordial gas density with redshift assuming with , and with . The lines show the evolution density at constant halo mass. Prior to these follow the expectation from the Press-Schechter mass function.
4.5 The Evolution Of The Metal-Enriched Gas Content Of Galaxies
We compute the density of enriched gas inside halos of mass . In regions of the IGM that have not yet been enriched, newly accreted gas is primordial. Conversely in enriched regions of the IGM, newly accreted gas is metal enriched. Prior to the reionization of a region, gas can cool inside a halo whose virial temperature is larger than K. However, following reionization of a region, infall is suppressed in halos whose virial temperature is smaller than K. In neutral regions the enriched gas inside halos below is not photo-evaporated so that, at least initially, some halos with masses below will contain enriched gas that has not undergone SF. This gas will move into larger halos during subsequent mergers. Using a method similar to that of the preceding section, we can calculate the density of enriched gas that remains in these low mass halos following reionization. Note here that we assume enriched gas can accrete into halos of all masses in excess of . Conversely, in § 3.1 we argued that the IGM will remain at a temperature of K following enrichment by a blastwave, implying that accretion of enriched gas is suppressed for mini-halos with masses smaller than M⊙. However this inconsistency will not affect our estimate of Pop-II SF since M.
We can therefore write down the evolution of the density of enriched gas which we denote (note that this density refers to a density of gas that has not been in a galaxy at a time when it underwent a burst of SF). Photo-ionization leads to in ionized regions of the IGM. In neutral regions we have
| (13) |
where is the Heaviside step function. The first two terms (first line) only contribute in enriched regions of the IGM. The first term corresponds to a source of collapsing halos in which metal enriched gas accretes from the IGM. The second term corresponds to a source term of gas accumulation due to progenitor halos which are below the Jeans mass. These progenitor halos result in accretion of enriched gas from the IGM. The third term describes the movement of enriched gas from small halos to large halos during mergers. The fourth term describes the loss of gas density in halos of mass that results from the merger of those halos to form larger systems. The enriched gas density in halos smaller than the Jeans mass or larger than is zero. The upper right panels of figures 2 and 3 show the evolution of the enriched gas density with redshift assuming with , and with .
4.6 The Collapsed Fraction Of Gas Inside Galaxies
The fraction of gas in the universe that has collapsed inside galaxies at redshift but not undergone a starburst is
| (14) |
for primordial gas, and
| (15) |
for enriched gas. These are plotted in the lower left panels of Figure 2 and 3 assuming with , and with respectively. For comparison we also show the collapsed fractions () above , and (left to right respectively). We see that prior to the transition redshift, nearly all gas inside collapsed systems is primordial. After the transition redshift this collapsed primordial gas is replaced with enriched gas. However, the collapsed fraction of primordial gas does not peak until and assuming and respectively. The enriched gas comes to dominate the collapsed gas fraction at around the same time. Note that .
5 The Starformation History
We model SF to occur following the collapse of baryons into a dark matter halo larger than , or following a major merger with progenitors larger than . Halos that merge to form a system greater than for the first time are able to produce Pop-II or Pop-III stars. The evolution of gas densities derived in the previous section may be used to compute the relative quantities of each. Barkana & Loeb (2000) suggested a model for the SFR based on the merger history of halos. In their model, gas that has not previously cooled and undergone an episode of SF in a galaxy forms stars with efficiency as it cools following a merger that forms a galaxy larger than . In addition, gas in a galaxy of mass undergoes an additional starburst if the galaxy merges with a second galaxy whose mass is larger than . Barkana & Loeb (2000) assume that the cold gas in a galaxy has undergone one previous starburst, so that the remaining gas mass is reduced by a factor .
Following Wyithe & Loeb (2003a) we consider two prescriptions for SF which bracket the expected scenario of supernova feedback in low mass galaxies. The scenario described above is referred to as Case-A. We also consider a second evolution for the stellar ionizing field, denoted hereafter as case B. Analysis of a large sample of local galaxies shows that the ratio (where and are the total stellar and dark matter halo masses respectively) scales as for , but is constant for larger stellar masses (Kauffmann et al. 2003). Since SF is thought to be regulated by supernova feedback (Dekel & Silk 1986), the important quantity is the depth of the galactic potential well, or equivalently the halo circular velocity. Using the stellar mass Tully-Fisher relation of Bell & De Jong (2001), we find the threshold circular velocity that at corresponds to a stellar mass of . In this case we define as the SF efficiency in galaxies with circular velocities larger than . The SF efficiency in smaller galaxies is multiplied by a factor , where for and for . The expressions for the SF rate in the following sub-sections have SF efficiencies written as the product . Note that while in Case-B shows the mass dependence described above, for all masses in Case A.
5.1 The Pop-III SF Rate
We assume that there is a burst of Pop-III SF of mass (where is the SF efficiency and we assume ) whenever there is a merger of a halo with mass to form a new halo with mass . These starbursts comprise all of the Pop-III SF, since once gas has been involved in a starburst the gas becomes enriched so that a subsequent shock due to a major merger results in Pop-II SF. Following reionization of a region of IGM, all gas in halos below is photo-evaporated over a timescale where it becomes enriched, and hence subsequent SF there is assumed to be Pop-II. The Pop-III SF rate density in neutral regions is therefore given by
| (16) | |||||
The Pop-III SF rate in a neutral IGM is shown in the lower middle (Case-A) and lower right (Case-B) panels of figures 2 and 3 (solid lines) assuming with , and with respectively. The corresponding integrated Pop-III SF densities follow from
| (17) |
As noted in Figure 1, the collapsed mass of primordial gas at far exceeds the mass of gas involved in SF up until that point. Moreover, we see that in the absence of reionization, Pop-III SF can persist long after the enrichment of the IGM. Indeed, Figures 2 and 3 show that if enrichment occurred at then Pop-III SF would not peak until redshift , and would not cease until . This result is quite insensitive to the exact value and to the mode of SF.
5.2 The Pop-II SF Rate
In the model of SF employed, gas that has not previously cooled and undergone an episode of SF in a galaxy forms stars with efficiency as it cools following a merger to form a galaxy larger than . In addition, gas in a galaxy of mass undergoes an additional starburst if the galaxy merges with a second galaxy whose mass is larger than . This second star-burst is assumed to be always Pop-II.
We may use our calculation of the evolution of to calculate the Pop-II SF rate in neutral regions.
| (18) | |||||
The first term is for SF where gas crossing undergoes a starburst. The second term corresponds to the secondary starbursts (in gas that has already undergone a burst of SF) that follow major mergers. Note that while the first term does not contribute in regions of the IGM that are not yet enriched, this second term can contribute at all regions of IGM that have not been reionized.
Finally, we calculate the Pop-II SF rate in regions of the IGM that have been reionized.
| (19) | |||||
Here the 1st term is for SF where gas in the halo undergoes a starburst when the halo crosses . The 2nd term corresponds to the additional starbursts (in gas within halos above that has already undergone a burst of SF) that follow major mergers.
The Pop-II SF rates in a neutral (dark-dashed lines) and an ionized (grey-dashed lines) IGM are shown in the lower right panels of figures 2 and 3 assuming with , and with respectively. As noted by Barkana & Loeb (2000), the SF rate in an ionized universe implied by a SF efficiency of agrees with observational estimates of Mpcyr at . The integrated Pop-II SF density follows from
| (20) |
6 reionization of the IGM and the SF history
In the previous section we computed the SF rate as a function of time in neutral and ionized regions of the universe for both Pop-II and Pop-III stars. However, the average SF history of the universe cannot be computed in isolation from its reionization history, which specifies the fraction of SF that is in neutral and reionized regions as a function of redshift. Similarly, the computation of a reionization history requires specification of a SF history. As a result the SF and reionization histories must be computed in a co-dependent way.
6.1 Modeling the Reionization of Hydrogen
The simplest estimate of the epoch of reionization is based on the following considerations. Given a co-moving density of ionizing photons in a homogeneous but clumpy medium of comoving density (where the size of the HII region is much larger than the scale length of clumpiness), the evolution of the volume filling factor of ionized regions is (Shapiro & Giroux 1987; Haiman & Loeb 1997; Madau et al. 1999; Barkana & Loeb 2001)
| (21) |
where is the case B recombination coefficient, is the scale factor, is the comoving electron density, and is the clumping factor. This equation describes statistically the transition from a fully neutral universe to a fully ionized one, and yields reionization redshifts for hydrogen of around 7-12 for fiducial parameters. However, large uncertainties arise in both the source term and in the value of the clumping factor (because more rapid recombinations lead to a slower evolution of ).
A more realistic description of reionization in a clumpy medium is provided by the model of Miralda-Escude et al. (2000). In what follows, we draw primarily from their prescription and refer the reader to the original paper for a detailed discussion of its motivations and assumptions. The model assumes that reionization progresses rapidly through islands of lower density prior to the overlap of individual cosmological ionized regions. Following overlap, the remaining regions of high density are gradually ionized. It is therefore hypothesized that at any time, regions with gas below some critical overdensity are ionized while regions of higher density are not. The mass fraction (or equivalently ) therefore evolves according to the equation
| (22) |
This equation assumes that all ionizing photons are absorbed shortly after being emitted, so that there is no background ionizing field, and no loss of ionizing photons due to redshift. We therefore implicitly assume that the mean free path of ionizing photons is much smaller than the Hubble length. This should be valid at redshifts not too much smaller than the overlap redshift.
The integration of equation (22) requires knowledge of . Miralda-Escude et al. (2000) found that a good fit to the volume weighted probability distribution for the density as seen in N-body simulations has the functional form
| (23) |
with and , 2.35 and 2.48, and , 0.599 and 0.611 at , 3 and 4. At they assume , which corresponds to the distribution of densities of an isothermal sphere, and solve for and by requiring the mass and volume to be normalized to unity. We repeat this procedure to find at higher redshifts. The proportionality of to the scale factor is expected for the growth of structure in an universe or at high redshift otherwise, and its amplitude should depend on the amplitude of the power-spectrum. The simulations on which the distribution in Miralda-Escude et al. (2000) was based assumed in matter, in a cosmological constant and , close to the values used in this paper.
Equation (22) provides a good description of the evolution of the ionization fraction following the overlap of individual ionized bubbles, because the ionization fronts are exposed to the mean ionizing radiation field. However, prior to overlap, the prescription is inadequate, due to the large fluctuations in the intensity of the ionizing radiation. A more accurate model to describe the evolution of the ionized volume prior to overlap was suggested by Miralda-Escude et al. (2000). In our notation the appropriate equation is
| (24) |
or
| (25) |
In this expression, is redefined to be the volume filling factor within which all matter at densities below has been ionized. Within this formalism, the epoch of overlap is precisely defined as the time when reaches unity. However, we have only a single equation to describe the evolution of two independent quantities and . The relative growth of these depends on the luminosity function and spatial distribution of the sources. The appropriate value of is set by the mean free path of the ionizing photons. More numerous sources can attain overlap for smaller values of . Assuming to be constant with redshift, we find that results do not vary much (less than 10% in the optical depth to electron scattering) for values of ranging from a few to a few tens. At high redshift, these correspond to mean free paths comparable to the typical separations between galaxies or quasars. Unless otherwise specified we assume (which lies between the values for galaxies and quasars) throughout the remainder of this paper.
6.2 Effects of Minihalos On Reionization
The presence of minihalos effects the progression of reionization, by delaying the buildup of the ionizing radiation field within ionized regions. Many of the ionizing photons will be used to photo-evaporate the minihalos rather than to progress reionization within IGM. Moreover, the finite time over which this evaporation occurs allows SF to proceed in halos crossing for a short time following the reionization of a region of IGM. In the presence of an intense ionizing background radiation field, a large fraction of the gas in halos with virial temperatures below K is photo-evaporated (Barkana & Loeb 2002; Iliev, Shapiro, & Raga, 2005; Ciardi et al., 2005) on the halo dynamical time . Two additions should therefore be made to the above description arising from the effect of minihalos. First, we need to take into account Pop-III SF within ionized regions due to halos crossing the H-cooling threshold which have not yet been photo-evaporated. A simple way to approximate the effect of this additional SF is to reduce the cold gas in minihalos, and therefore the resulting SF rate corresponding to crossing the H-cooling threshold by a factor of at time . Here and the pre-factor of 0.5 is approximately the average remaining neutral gas fraction in all minihalos which become exposed to ionizing photons between and zero years prior to a redshift , while the ratio term is just the fraction of minihalos that become exposed to ionizing radiation within the preceding years.
Second, while the above consideration enhances the SF in ionized IGM, the minihalos will delay further reionization for a period lasting for the photo-evaporation timescale through screening of the ionizing sources by minihalos (Barkana & Loeb 2002). We therefore need to estimate the fraction of photons that are absorbed by minihalos rather than contributing to the reionization of the IGM. This estimate may be made as follows. An ionizing photon will travel a distance through ionized regions of IGM before encountering neutral IGM. On the other hand, an ionizing photon will travel a different distance before encountering a minihalo that contains cold gas. The fraction of ionizing photons produced in ionized regions that reionize neutral IGM rather than intercepting minihalos prior to their evaporation is therefore approximated by
| (26) |
| SF | ||||||||||
|---|---|---|---|---|---|---|---|---|---|---|
| Figure 4 | Case-A | 17 | 1.25 | 20 | 10% | 0.007,0.01 | 0.006,0.03 | 0.004,0.10 | 0.008,0.30 | 0.19 0.18 0.15 0.12 |
| Figure 5 | Case-A | 22 | 2.5 | 20 | 100% | 0.009,0.01 | 0.009,0.03 | 0.010,0.10 | 0.009,0.30 | 0.20 0.18 0.14 0.11 |
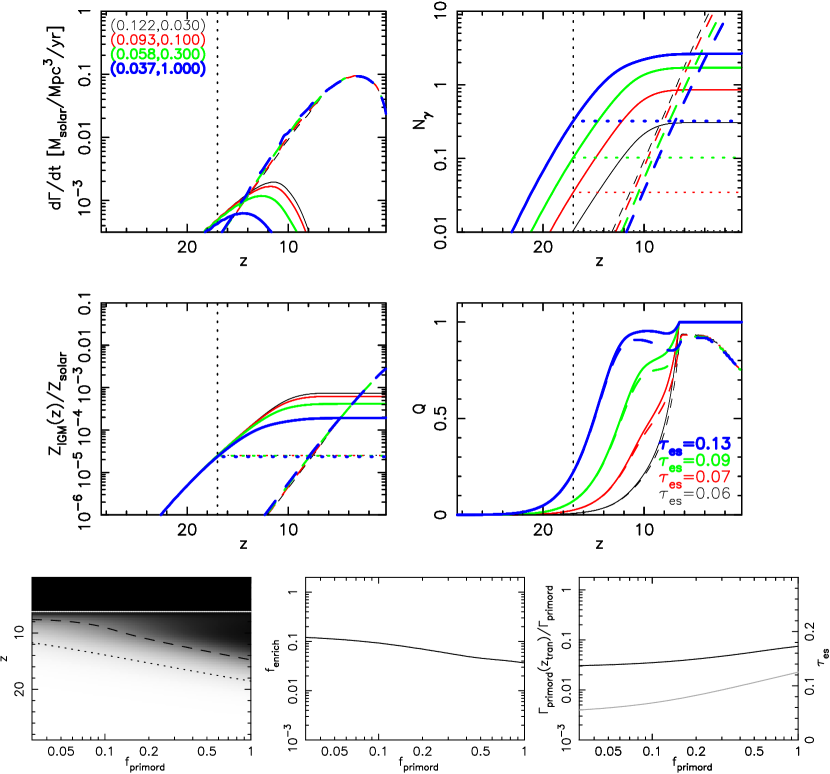
| Figure 6 | Case-B | 17 | 1.25 | 20 | 100% | 0.122,0.03 | 0.093,0.10 | 0.058,0.30 | 0.037,1.0 | 0.13 0.09 0.07 0.06 |
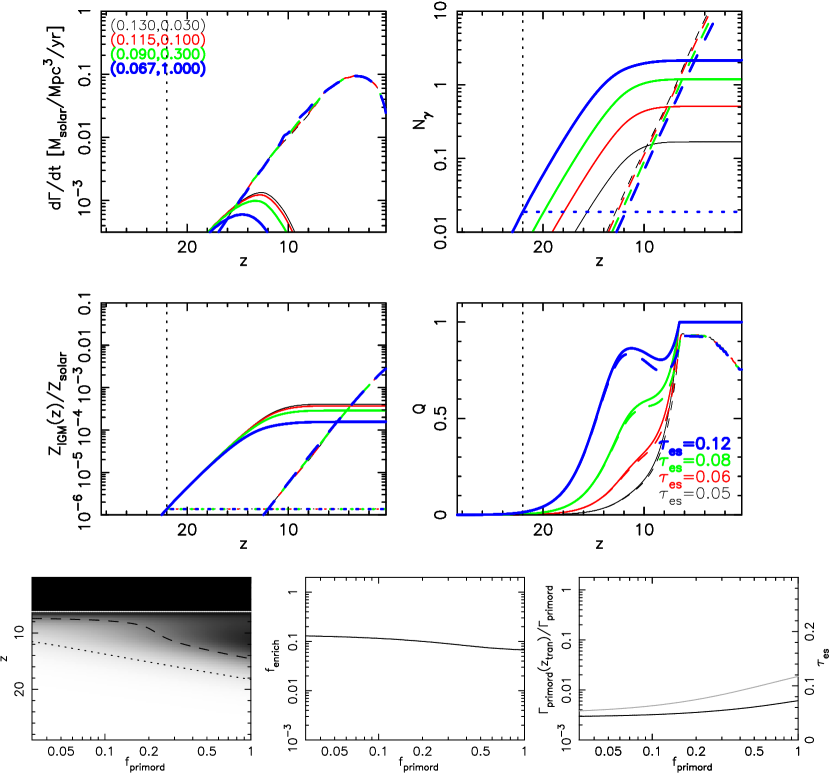
| Figure 7 | Case-B | 22 | 2.5 | 20 | 100% | 0.130,0.03 | 0.115,0.10 | 0.090,0.30 | 0.067,1.0 | 0.12 0.08 0.06 0.05 |
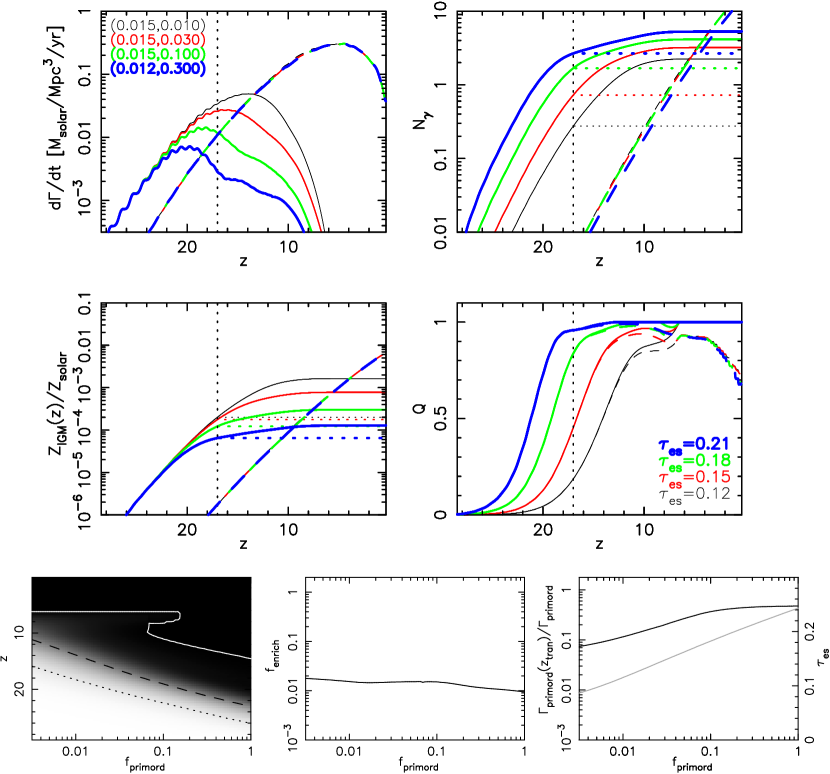
| Figure 8 | Case-A | 17 | 1.25 | 10 | 10% | 0.015,0.01 | 0.015,0.03 | 0.015,0.10 | 0.012,0.30 | 0.21 0.18 0.15 0.12 |
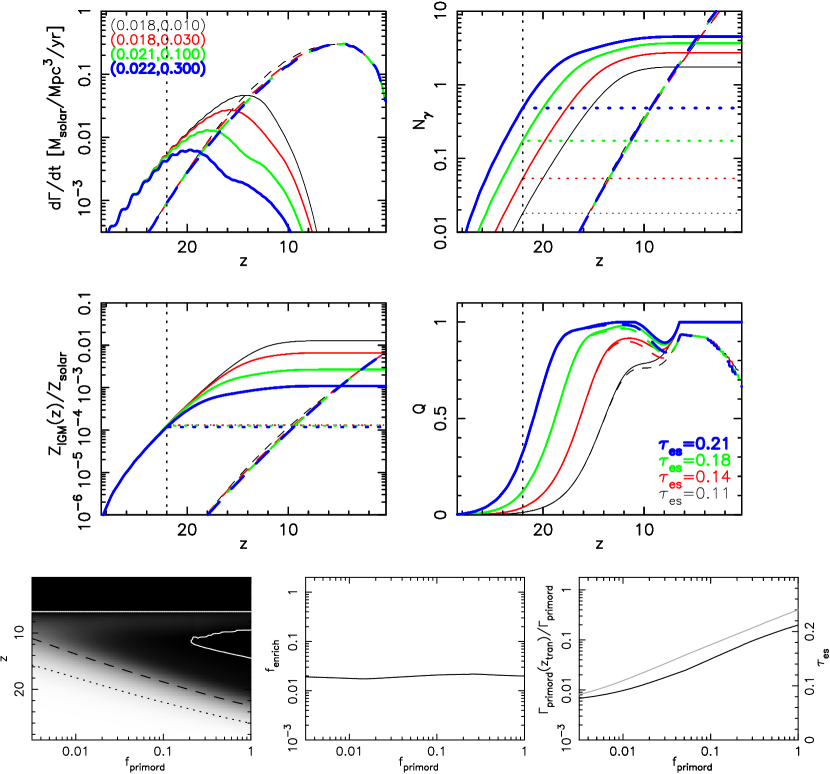
| Figure 9 | Case-A | 22 | 2.5 | 10 | 100% | 0.018,0.01 | 0.018,0.03 | 0.021,0.10 | 0.022,0.30 | 0.21 0.18 0.14 0.11 |
The length may be easily computed within the formalism described. An ionizing photon will typically travel a distance , where is the fraction of the IGM at overdensities below (Miralda-Escude et al. 2000). On the other hand, to compute the cross-section for interception of a minihalo that contains cold gas we need to find the fraction of gas in minihalos at a redshift that was accreted to within progenitor minihalos within the previous interval . This quantity may be computed from the extended Press-Schechter formalism (Lacey & Cole 1993). For a halo of mass at redshift , the fraction of the halo mass which by some higher redshift had already accumulated in halos is
| (27) |
where is the linear growth factor at redshift , is the variance on mass scale (defined using the linearly extrapolated power spectrum at ), and is the Jeans mass at . Given the virial radius for a halo of mass (Barkana & Loeb 2001) and the Press-Schechter (1974) mass function () for the number density of halos we may then find the length
| (28) |
where .
6.3 Co-Evolution of Reionization, Star Formation and Metal Enrichment
We next describe the co-evolution of the reionization and SF histories. Having specified a transition redshift, we computed in the previous section the Pop-III () and Pop-II () SF rates in neutral regions, as well as the Pop-II SF rates in ionized regions (). The ionizing photon production rate then follows from
where is the proton mass, and are the ionizations per baryon, and and are the escape fractions for Pop-III and Pop-II stars respectively. The quantity is the maximal value that has attained at any time in the reionization history. A region that has been reionized may recombine in the absence of an ionizing radiation field, but the timescale for cooling is longer than the recombination timescale for . The inclusion of ensures that the SF rate in regions that have recombined remains the same as for an ionized region should that region return to a neutral state. The term accounts for the contribution of quasars to the ionizing flux. Quasars are included in the model as described in Wyithe & Loeb (2003a), with an updated quasar luminosity function model (Wyithe & Loeb 2003b). If treated as the sole ionizing sources, we find that quasars reionize cosmic hydrogen at around . Wyithe & Loeb (2003c) found that helium became reionized by quasars at , in agreement with observation (e.g. Theuns et al. 2002). The coupled evolution of equations (22), (25) and (6.3) yield the SF and reionization histories.
We may also estimate the mean level of metal enrichment in the IGM. This quantity is important because massive Pop-III stars are expected to form only out of gas that is not enriched to a metallicity above Z⊙ (Bromm et al. 2001a). We estimate the mean metallicity at a redshift as
| (30) |
where is the stellar mass that must be produced per supernova, is the mass of metals produced per supernova, and is the fraction of metals that escape from galaxies into the IGM in supernova-driven outflows (e.g. Madau, Ferrara & Rees 2001; Thacker, Scannapieco & Davis 2002). The value of may be large because the early dwarf galaxies had shallow potential wells. For a massive Pop-III IMF, Furlanetto & Loeb (2003) estimate and . We note that this number is very sensitive to the stellar mass function, because stars with masses are expected to eject their metals while more massive stars collapse to form black holes (Heger & Woosley 2002).
Different reionization histories lead to different column depths of free electrons along a line-of-sight to recombination. An important probe of the reionization history is therefore provided by the observation by the WMAP satellite of a large optical depth to electron scattering of CMB photons. The optical depth to electron scattering , depends on the mass filling factor () and is evaluated according to
| (31) |
where is the Thomson cross-section.
6.4 Results: The Reionization History of Hydrogen
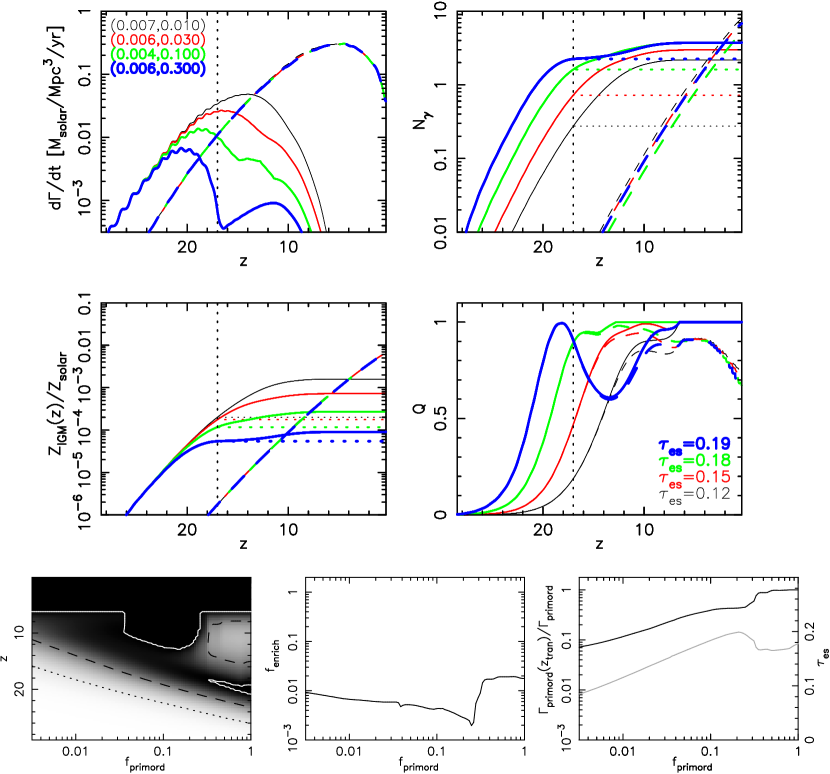
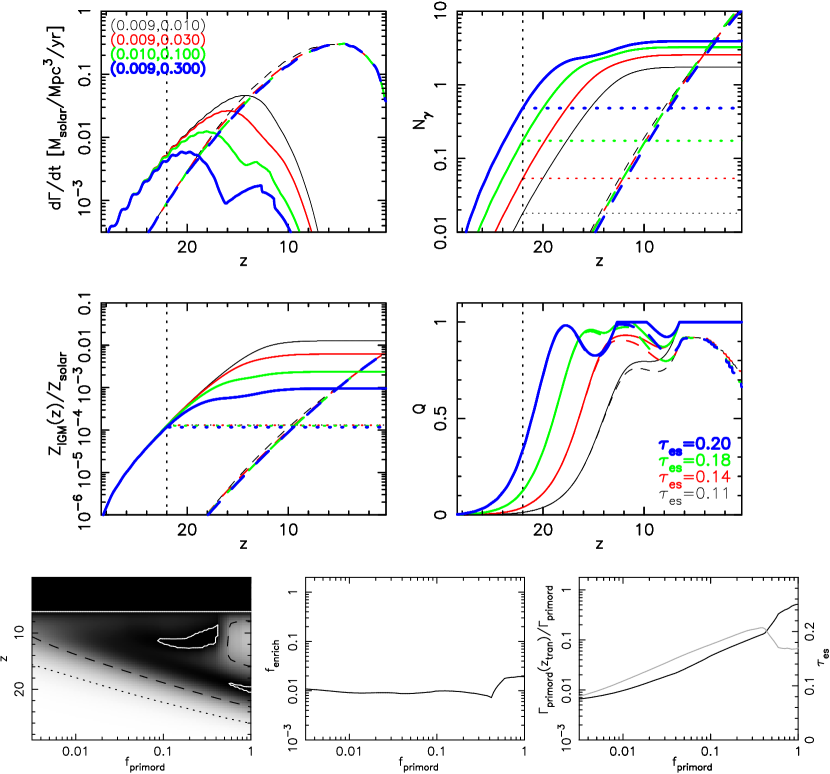
Figures 4-9 show several examples of the reionization history, which explore a wide range of the various inputs to the model. These inputs are summarized in Table 1. In each case we present 4 histories in the upper set of panels. The input values of , together with the value of that leads to a final reionization at are also listed in table 1. The thicker lines correspond to histories with larger values of . Note here that the escape fraction is degenerate with the SF efficiency (for ). We have chosen in presenting our SF histories, however the values of escape fraction can be adjusted in proportion for different choices of .
The total SF rates in Pop-II (solid lines) and Pop-III (dashed lines) stars are plotted in the upper left panels of Figures 4-9. Feedback from reionization quenches SF. However, our histories show that the additional Pop-III SF remains significant at in all cases, and peaks at in many cases. Pop-II stars begin to dominate the global SF rate only around the time of the peak in the Pop-III SF rate. We also find that Pop-III SF at redshifts below forms the dominant contribution to the total integrated Pop-III SF rate in all models. This may be seen through plots of the integrated ionizing photon production as a function of redshift (upper right panels of Figures 4-9). The horizontal dotted lines show the level of ionizing photon production at . The fraction of ionizing photon production by Pop-III at is larger than 90% in nearly all cases, and can be as large as 99.9%. Furthermore, Pop-III SF can dominate the total ionizing photon production at for models with large . We note that the comparison of SF in an ionized and in a neutral IGM (see Figures 2-3) suggests that reionization of the IGM should be accompanied by a dip in the SF rate as seen in the calculations of Barkana & Loeb (2000). However, the SF histories that are computed in concert with a reionization history do not show this dip. The reason is that an extended reionization history washes out this feature on average, though it may still be observed in isolated regions.
For each of the reionization histories in Figures 4-9 we plot (middle left panels). We have chosen (see values in Table 1) so as to obtain ; close to the threshold deduced by Bromm et al. (2001a) at . Note that is degenerate with in addition to . However, this simple estimate demonstrates that metal enrichment of the IGM by Pop-III stars is consistent with our assumed (see also Mackey, Bromm & Hernquist 2002). The possible exception is for Case-B SF with . In this example the integrated SF rate by is not sufficient to enrich the IGM. Finally, the parameter is unspecified a-priori. We have chosen , with the exception of Figures 8 and 9. Comparison of Figures 8 and 9 with Figures 4 and 5 demonstrate that while the details of the reionization history depend on the value assumed for , the qualitative nature of the predicted histories and the values of are similar. We therefore find that our conclusions are not sensitive to the choice of .
We find that either Pop-III stars substantially reionize the universe, or that the fraction of Pop-III SF which takes place following the transition redshift is large. Either way the conclusion is that Pop-III stars played a major role in the reionization history of the universe. In particular if the universe did not become substantially reionized prior to , then the large majority of Pop-III SF takes place at redshifts below , in contrast to previous modeling. Each of the histories shown in Figures 4-9 was chosen so that overlap occurs at as suggested by the spectra of high redshift SDSS quasars. However, different reionization histories result in different densities of electrons as a function of redshift. The values of for the various models are listed in the middle right panels of Figures 4-9 and in Table 1. WMAP suggested . We see that only a small value of for Case-A, or for Case-B is required to obtain this large optical depth, even where the enrichment of the IGM occurred at a redshift as high as . Indeed the conclusion that Pop-III stars contributed significantly to reionization is quite insensitive to the transition redshift for , so long as Pop-III stars had a top-heavy IMF.
The lower three panels of Figures 4-9 represent results for a series of reionization histories. For each value of the primordial escape fraction (), we have found the value of that results in a final overlap at (or as near as possible at ), and which maintains the reionization until the present day. In the lower left panel we present grey-scale and contours showing the level of overlap as a function of redshift and . The grey-scale shows the level of ionization (with black representing high ionization). The dotted, dashed and solid lines correspond to , 0.5 and .999 respectively. The value of corresponding to these histories is plotted as a function of in the middle panel. In the right panel we plot the optical depth as a function of (grey line). For Case-A, the optical depth has a maximum near , but the WMAP result is consistent with all values of . For Case-B, the optical depth has a maximum near . Only larger values of are consistent with the WMAP result for Case-B. The dark line in the lower-right panel is the ratio of the amount of Pop-III SF already completed at to the total Pop-III SF. This ratio is small () for small values of . In Case-A, we find that the ratio can be as small as 0.01 where and 0.1 where . The ratio is only of order unity if is also of order unity. In Case-B, we find that the ratio can be even smaller, with values a factor of 3 lower. The ratio does note become of order unity for any value of in Case-B.
Interestingly in Case-A a range of histories show two epochs of reionization. However, contrary to earlier works, the tail end of the first reionization has not been set by an abrupt transition redshift . Rather the end of the first reionization can come either before, or after depending on the sum of the various astrophysics included in the model. A particularly interesting history is seen where Case-A SF is combined with a large escape fraction for Pop-III ionizing photons and a large transition redshift (see Figure 5). In this example the reionization history shows three peaks of reionization. Thus, the claim made earlier by Furlanetto & Loeb (2005) that a temporally smooth metallicity enrichment of the IGM gives rise to only monotonic reionization process is not borne out in our more detailed calculations in general.
Clearly, the information embedded in the reionization history is very rich. It is useful to extract some essential properties with regard to the CMB experiments such as WMAP, since the three-year WMAP results are expected to be made public shortly. The thin black curves in Figures 6 and 7 show histories with and respectively. These histories follow from a very small Pop-III contribution to reionization, suggesting that without Pop-III contribution we expect . At the other extreme, when we maximize the contribution from Pop-III stars to reionization by using a very high (perhaps implausible) escape fraction (relative to that of Pop-II stars), a maximum value of is possible. This suggests that the optical depth reported by the three-year WMAP results should not exceed this value (which is above the central value of the first year WMAP result), otherwise our understanding of structure formation at high redshift would require a dramatic revision. In a more realistic picture where the product of star formation efficiency and escape fraction for Pop-III stars is comparable to that for Pop-II stars, we find that the range is most likely, consistent with our previous calculations (Cen 2003a,b).
The three different outcomes described above imply qualitatively different histories. In the small case without significant Pop-III contribution, reionization is expected to be rapid with the neutral fraction quickly rising above at . In the large case with a large Pop-III contribution, the reionization process could be complex and frequently displays multiple peaks. Under seemingly more reasonable assumptions regarding the efficiency of Pop-III stars, there appears to be a reionization plateau at where the mean neutral fraction holds in a relatively narrow range of . Independent constraints of the reionization history are highly desirable. Surveys of Ly emitters (e.g., Malhotra & Rhoads 2005) and measurements of QSO Stromgren sphere sizes (e.g., Mesinger, Haiman, & Cen 2004; Wyithe, Loeb & Carilli 2005; Fan et al 2005) may provide powerful constraints on the evolution of the ionized fraction close to the end of the reionization epoch. In addition future CMB experiments such as Planck survey might be able to distinguish (e.g., Holder et al. 2003) between the various histories and if so, it should yield some critical information on SF processes in the high redshift universe.
7 Conclusion
We show that the collapsed fraction of primordial gas that is trapped in virialized minihalos at the redshift () when the IGM becomes enriched with metals is larger than the collapsed fraction of gas that has already been involved in SF by a factor of a few to a few tens. We argue that this virialized gas will not be as easily enriched by super-galactic winds as the general IGM, because the strong self-gravity created by dark matter and significant overdensity with respect to the background gas help stabilize the collapsed gas against large disruptions by sweeping shockwaves. Moreover, enriched gas is expected to have been pre-heated during the process of enrichment, preventing contamination of virialized primordial gas during hierarchical growth of mini-halos. Hence, collapsed gas in virialized minihalos may largely remain metal-free, until those halos merge to form larger systems of sufficient mass to initiate SF.
We have followed the evolution of virialized primordial gas through hierarchical mergers of their host dark matter halos. This enables the calculation of the Pop-III SF rate arising from the virialized primordial gas when it crosses the hydrogen cooling threshold. Our model for the reionization of the IGM computes the co-evolution of the reionization and SF histories. In addition to following the gas-content of halos below the minimum mass for SF our model addresses several astrophysical phenomena. These include feedback from reionization in the form of suppression of galaxy formation in a photo-ionized IGM, as well as the photo-evaporation of minihalos (both the screening of ionizing sources and the additional low mass SF in ionized regions prior to photo-evaporation). We also allow the IGM to be gradually enriched by metals rather than an abrupt transition.
We find that the Pop-III SF rate peaks substantially later (as low as redshift ) in cosmic time than the epoch at which the IGM became metal enriched, and may extend to . Moreover, we find that the total integrated Pop-III SF is larger, by a factor of a few to a few tens, than the integrated Pop-III SF at the average redshift of IGM metal enrichment. This prolonged epoch of Pop-III SF has a pronounced effect on the reionization history of cosmic hydrogen. Despite the varied feedback mechanisms included in our model we find that the prolonged epoch of Pop-III SF leads to complex reionization histories which can be multi-peaked under a range of plausible scenarios.
Observational measurements of the detailed reionization history would provide critical information on the formation process of first stars. Specifically, assuming the final overlap redshift to be fixed at (as implied by observations of high redshift quasars), the contribution of Pop-III stars to reionization can be quantified and will be tested by three-year WMAP results: (1) if Pop-III stars do not contribute to reionization, and a rapid reionization at is expected, with the mean neutral fraction quickly exceeding at ; (2) if the product of star formation efficiency and escape fraction for Pop-III stars is significantly larger than for Pop-II stars, then a maximum is achievable; (3) in a (perhaps) more plausible scenario where the product of star formation efficiency and escape fraction for Pop-III stars is comparable to that for Pop-II stars, would be observed [consistent with our previous calculations (Cen 2003a,b)]. In this case the histories would be characterized by an extended ionization plateau from where the mean neutral fraction stays in a narrow range of . These results are rather insensitive to the redshift where the IGM becomes enriched with metals.
References
- (1) Abel, T., Bryan, G.L. & Norman, M.L., 2000, ApJ, 540, 39
- (2) Abel, T., Bryan, G.L., & Norman, M.L., 2002, Science, 295, 93
- (3) Bardeen, J.M., Bond, J.R., Kaiser, N., & Szalay, A.S. 1986, ApJ, 304, 15
- Barkana & Loeb (2000) Barkana, R., & Loeb, A. 2000, ApJ, 539, 20
- (5) Barkana, R., & Loeb, A. 2001, Phys. Rep., 349, 125
- Barkana & Loeb (2002) Barkana, R., & Loeb, A. 2002, ApJ, 578, 1
- Becker et al. (2001) Becker, R. H. et al. 2001, AJ, 122, 2850
- Bell & de Jong (2001) Bell, E. F. & de Jong, R. S. 2001, ApJ, 550, 212
- Bromm, Coppi, & Larson (1999) Bromm, V., Coppi, P. S., & Larson, R. B. 1999, ApJ, 527, L5
- Bromm, Coppi, & Larson (2001) Bromm, V., Coppi, P. S., & Larson, R. B. 2001, astro-ph/0102503
- (11) Bromm, V., Coppi, P.S., Larson, R.B. 2002, ApJ, 564, 23
- Bromm, Kudritzki, & Loeb (2001) Bromm, V., Kudritzki, R. P., & Loeb, A. 2001, ApJ, 552, 464
- (13) Cen, R. 2003a, ApJ, 591, 12
- (14) Cen, R. 2003b, ApJ, 591, L5
- (15) Cen, R., & McDonald, P. 2002, ApJ, 570, 457
- (16) Chiu, W.A., Fan, X., & Ostriker, J.P. 2003, ApJ, 599, 759
- (17) Ciardi et al., 2005, preprint astro-ph/0511623
- Dekel & Silk (1986) Dekel, A. & Silk, J. 1986, ApJ, 303, 39
- Dijkstra et al. (2004) Dijkstra, M., Haiman, Z., Rees, M. J., & Weinberg, D. H. 2004, ApJ, 601, 666
- (20) Dinge, D. 1997, ApJ, 479, 792
- Fan et al. (2002) Fan, X., Narayanan, V. K., Strauss, M. A., White, R. L., Becker, R. H., Pentericci, L., & Rix, H. 2002, AJ, 123, 1247
- (22) Fan, X., et al. 2005 astro-ph/0512082
- (23) Furlanetto, S., & Loeb, A. 2005, ApJ, 634, 1.
- Furlanetto & Loeb (2003) Furlanetto, S. R., & Loeb, A. 2003, ApJ, 588, 18
- Gnedin (2004) Gnedin, N. Y. 2004, ApJ, 610, 9
- (26) Haiman, Z. & Loeb, A., 1997, ApJ, 483, 21
- Haiman et al. (1997) Haiman, Z., Rees, M. J., & Loeb, A. 1997, ApJ, 476, 458
- Haiman & Holder (2003) Haiman, Z., & Holder, G. P. 2003, ApJ, 595, 1
- Heger & Woosley (2002) Heger, A., & Woosley, S. E. 2002, ApJ, 567, 532
- (30) Holder, G.P., Haiman, Z., Kaplinghat, M., & Knox, L. 2003, ApJ, 595, 13
- (31) Iliev, I.T., Shapiro, P.R., & Raga, A.C. 2005, MNRAS, 361, 405
- (32) Kauffmann, G., et al.,, 2003, MNRAS, 341, 54
- Kitayama & Ikeuchi (2000) Kitayama, T. & Ikeuchi, S. 2000, ApJ, 529, 615
- Kogut et al. (2003) Kogut, A., et al. 2003, ApJS, 148, 161
- (35) Klein, R.I., McKee, C.F., & Colella, P. 1994, ApJ, 420, 213
- Leitherer et al. (1999) Leitherer, C. et al. 1999, ApJS, 123, 3
- Lacey & Cole (1993) Lacey, C., & Cole, S. 1993, MNRAS, 262, 627
- (38) Mackey, J., Bromm, V., Hernquist, L., 2002, astro-ph/0208447
- Madau et al. (1999) Madau, P., Haardt, F., & Rees, M. J. 1999, ApJ, 514, 648
- Madau et al. (2001) Madau, P., Ferrara, A., & Rees, M. J. 2001, ApJ, 555, 92
- (41) Malhotra, S., & Rhoads, J. 2005, astro-ph/0511196
- Mesinger & Haiman (2004) Mesinger, A., & Haiman, Z. 2004, ApJ, 611, L69
- (43) Mesinger, A., Haiman, Z., & Cen, R. 2004, ApJ, 613, 23
- Mori et al. (2002) Mori, M., Ferrara, A., & Madau, P. 2002, ApJ, 571, 40
- (45) Miniati, F., Jones, T.W., Ferrara, A., & Ryu, D. 1997, ApJ, 491, 216
- Miralda-Escudé, Haehnelt, & Rees (2000) Miralda-Escudé, J., Haehnelt, M., & Rees, M. J. 2000, ApJ, 530, 1
- (47) Murray, S.D., White, S.D.M., Blondin, J.M., & Lin, D.N.C. 1993, ApJ, 407, 588, “M93”
- (48) Navarro, J.F., Frenk, C.S., & White, S.D.M. 1997, 490, 493
- Navarro & Steinmetz (1997) Navarro, J. F. & Steinmetz, M. 1997, ApJ, 478, 13
- Oh & Haiman (2003) Oh, S. P., & Haiman, Z. 2003, MNRAS, 346, 456
- Oh et al. (2001) Oh, S. P., Nollett, K. M., Madau, P., & Wasserburg, G. J. 2001, ApJ, 562, L1
- Peebles (1993) Peebles, P.J.E. 1993, “Physical Cosmology” (Princeton University Press)
- Pentericci et al. (2002) Pentericci, L., et al. 2002, AJ, 123, 2151
- (54) Press, W. H., & Schechter, P. 1974, ApJ, 187, 425
- Quinn, Katz, & Efstathiou (1996) Quinn, T., Katz, N., & Efstathiou, G. 1996, MNRAS, 278, L49
- (56) Ricotti, M., & Ostriker, J.P. 2004, MNRAS, 350, 539
- Scalo (1998) Scalo, J. 1998, ASP Conf. Ser. 142: The Stellar Initial Mass Function (38th Herstmonceux Conference), 201
- Scannapieco, Ferrara, & Madau (2002) Scannapieco, E., Ferrara, A., & Madau, P. 2002, ApJ, 574, 590
- Shapiro & Giroux (1987) Shapiro, P. R., & Giroux, M. L. 1987, ApJ, 321, L107
- Sheth & Tormen (1999) Sheth, R. K. & Tormen, G. 1999, MNRAS, 308, 119
- Somerville et al. (2003) Somerville, R. S., Bullock, J. S., & Livio, M. 2003, ApJ, 593, 616
- (62) Spergel, D. N, et al. 2003, AJ Supp., 148, 175
- Thacker et al. (2002) Thacker, R. J., Scannapieco, E., & Davis, M. 2002, ApJ, 581, 836
- Theuns et al. (2002) Theuns, T., Bernardi, M., Frieman, J., Hewett, P., Schaye, J., Sheth, R. K., & Subbarao, M. 2002, ApJ, 574, L111
- (65) Thoul, A.A. & Weinberg, D.H., 1996, ApJ, 465, 608
- Weinberg, Hernquist, & Katz (1997) Weinberg, D. H., Hernquist, L., & Katz, N. 1997, ApJ, 477, 8
- (67) White, R., Becker, R., Fan, X., Strauss, M. 2003, AJ, 126, 1
- (68) Wyithe, J.S.B., & Loeb, A. 2003a, ApJ, 586, 693
- (69) Wyithe, J.S.B., & Loeb, A. 2003b, ApJ, 595, 614
- (70) Wyithe, J.S.B., & Loeb, A. 2003c, ApJ, 588, L69
- (71) Wyithe, J.S.B, Loeb, A., 2004, Nature, 432, 194
- (72) Wyithe, J.S.B, Loeb, A., Carilli, C. 2005, ApJ, 628, 575