GRB 050713A: High Energy Observations of the GRB Prompt and Afterglow Emission
Abstract
Swift discovered GRB 050713A and slewed promptly to begin observing with its narrow field instruments 72.6 seconds after the burst onset, while the prompt gamma-ray emission was still detectable in the BAT. Simultaneous emission from two flares is detected in the BAT and XRT. This burst marks just the second time that the BAT and XRT have simultaneously detected emission from a burst and the first time that both instruments have produced a well sampled, simultaneous dataset covering multiple X-ray flares. The temporal rise and decay parameters of the flares are consistent with the internal shock mechanism. In addition to the Swift coverage of GRB 050713A, we report on the Konus-Wind (K-W) detection of the prompt emission, an upper limiting GeV measurement of the prompt emission made by the MAGIC imaging atmospheric Cherenkov telescope and XMM-Newton observations of the afterglow. Simultaneous observations between Swift XRT and XMM-Newton produce consistent results, showing a break in the lightcurve at T0+15 ks. Together, these four observatories provide unusually broad spectral coverage of the prompt emission and detailed X-ray follow-up of the afterglow for two weeks after the burst trigger. Simultaneous spectral fits of K-W with BAT and BAT with XRT data indicate that an absorbed broken powerlaw is often a better fit to GRB flares than a simple absorbed powerlaw. These spectral results together with the rapid temporal rise and decay of the flares suggest that flares are produced in internal shocks due to late time central engine activity.
1 Introduction
The Swift Gamma-Ray Burst Explorer (Gehrels et al.,, 2004) has been returning unprecedented data about gamma ray bursts (GRBs) for the past 18 months. Of particular interest in the bursts followed by Swift have been the early time lightcurves of the afterglows which have shown much greater structure and different temporal decay properties than expected, leading to much discussion in the literature regarding the nature of the transition between the prompt emission, thought to be due to synchrotron radiation from internal collisions (Gallant et al.,, 1999), and the afterglow, also thought to be due to synchrotron radiation, though it remains somewhat unclear whether the emission arises in internal or external shocks. Swift observations have shown that GRB lightcurves can be described by a canonical 3-segment shape. This shape consists of 1 - an early steep decay phase (F where 3 5; t 500 s) 2 - a very shallow decay phase (0.5 1.0; 500 s t s) and 3 - a ’normal’ decay phase (1 1.5; s t) (Nousek et al.,, 2005). Superimposed on this smooth decay profile, Swift has shown that bright x-ray flares, 2 to 100 times as bright as the underlying afterglow, are common during the early (t 10 ks) stages of GRBs (Burrows et al.,, 2005b; Falcone et al.,, 2006; Piro, 2005b; Romano et al.,, 2005).
The observation of GRB050117 (Hill et al.,, 2005) marked the first time that Swift slewed to and settled on a GRB while the prompt gamma ray emission was still in progress, arriving 192 seconds after the Burst Alert Telescope (BAT) triggered on the burst which had a T90 of 168 seconds. Due to irregularities in the observing mode of the XRT and the proximity of the South Atlantic Anomaly to Swift during the observation of GRB050117, however, only very sparse data was collected by the XRT, totaling 11.4 seconds in the first orbit and 946 seconds overall. This left large gaps in the lightcurve coverage and severely limited the quality of the spectral analysis that could be performed.
We report here on the observation of GRB 050713A (Falcone et al.,, 2005), a burst of T90 = 70 seconds to which Swift slewed and began collecting data with the narrow field instruments (NFIs) in just 72.6 seconds, while the prompt gamma ray emission was still detectable by the BAT. This burst marks just the second time that the BAT and XRT have collected simultaneous data on a burst and it marks the first time that both instruments have produced a well sampled, simultaneous dataset covering multiple flares in the prompt emission.
In addition to the Swift coverage of GRB 050713A, we report also on prompt and followup observations carried out by Konus-Wind, MAGIC, XMM-Newton and ground based optical observatories. In section 2 we describe the observations and data analysis from all instruments including ground follow-up. In section 3 we discuss the implications of the observations in light of the new theoretical understanding emerging from Swift observations of GRBs. In section 4 we summarize and present our conclusions. Quoted uncertainties are at the 90% confidence level for one interesting parameter (i.e., =2.71) unless otherwise noted.
2 Observations and Data Analysis
Many different observatories and instruments have observed GRB 050713A. We devote the following section to a description of the observations and analysis carried out by each instrument team. All spectral fits were performed using XSPEC v11.3.
2.1 Swift BAT
The Swift BAT (Barthelmy et al.,, 2005) triggered on GRB 050713A at 04:29:02.39 UT, measuring a peak 1-second flux of photons cm-2 s-1. T90 measured in the 15–350 keV energy range is s (Palmer et al.,, 2005). The onset of the burst as defined by the BAT trigger is preceded by a weak, hard (photon index = 1.26) precursor at T0–60 s. BAT data were processed using the BAT ground software build 11 and BAT Calibration Database files build 11.
At the time of the BAT trigger, the flux rose rapidly and remained elevated during a 12 s long, multipeaked burst (Fig 1). At T0+12 s, the BAT flux rapidly decayed with a powerlaw decay rate of for 5 seconds before breaking to a more shallow decay of at T0+17 s. This decay continued until T0+40 s at which point the BAT flux had decayed to near background levels. At T0+50 s, a flare is seen with peak flux ergs cm-2 s-1, extrapolated into the XRT 0.2–10.0 keV bandpass, followed by a flare with peak flux ergs cm-2 s-1 at T0+65 s, another at T0+105 s with peak flux ergs cm-2 s-1 and some hint of further emission at the onset of a flare seen in the XRT at T0+160 s. A weak but statistically significant precursor is seen at T0–70 s to T0–50 s followed by a period of no significant emission from T0–50 s to the burst trigger.
The spectrum of the entire BAT dataset is well fit by a power-law spectrum with photon index = , though there is evidence for a slightly harder index of 1.45 during the plateau and a softening to during the rapid decay, and further softening to during the weak flares. Using the global fit of , the fluence is ergs cm-2 in the 15–350 keV energy range.
2.2 Konus-Wind
GRB 050713A triggered Konus-Wind (K-W) (Aptekar et al.,, 1995) at T0(K-W)= 04:29:01.745 UT. It was detected by the S2 detector, which observes the north ecliptic hemisphere, with an incident angle of 181. The K-W lightcurve in 3 bands is shown in Figure 2. The propagation delay from Wind to Swift is 1.387 s for this GRB. Correcting for this factor, one sees that the K-W trigger time corresponds to T0+0.742 s. Prior to T0(K-W)-0.512 s data were collected by K-W in a survey mode with lower time resolution of 2.944 s and only 3 broad spectral channels, 18–70 keV, 70–300 keV and 300–1160 keV. From T0(K-W) to T0(K-W)+491.776 s, 64 spectra in 101 channels were accumulated on time scales varying from 64 ms near the trigger to 8.19 s by the time the signal became undetectable. The multichannel spectra cover the 18 keV–14 MeV energy range but no statistically significant emission is seen above 2 MeV. Data were processed using standard Konus-Wind analysis tools.
Joint spectral analysis was carried out using the BAT data between 15 and 150 keV and the KONUS data from 20 to 2000 keV. The spectra were fit by a power law model with an exponential cut off: dN/dE E-α e where Ep is the peak energy of the Fν spectrum and is the photon index. The spectrum of the main pulse is well fit (Fig 3) with photon index and E keV (=138/119 dof). Joint fits between BAT and Konus were also made for other time intervals, including one which shows the faint precursor detected by both instruments at T–60 s, and will be addressed in greater detail in section 3.3.
The main pulse fluence in the 20 keV to 2 MeV range is erg cm-2. The 256-ms peak flux measured from T0+1.2 s in the 20 keV to 2 MeV band is erg cm-2 s-1 and the T90 durations of the burst in the G1, G2, G3 energy bands are s, s and s, respectively.
2.3 Swift XRT
The XRT (Burrows et al.,, 2005a) performs an automated sequence of observations (Hill et al.,, 2004) after Swift slews to a GRB detected by the BAT. When the spacecraft first settles on the target, a short image (0.1 s followed by a longer 2.5 s image if a position is not determined in 0.1 s) is taken to determine an accurate position. Following the image, the XRT switches into either Windowed Timing (WT) mode (a high timing accuracy mode with 1 dimensional position information) if the source count rate is above 2 counts s-1, or Photon Counting (PC) mode (the more traditional operating mode of X-ray CCDS in which full 2 dimensional position information is retained but with only 2.5 s timing resolution) if the count rate is below 2 counts s-1.
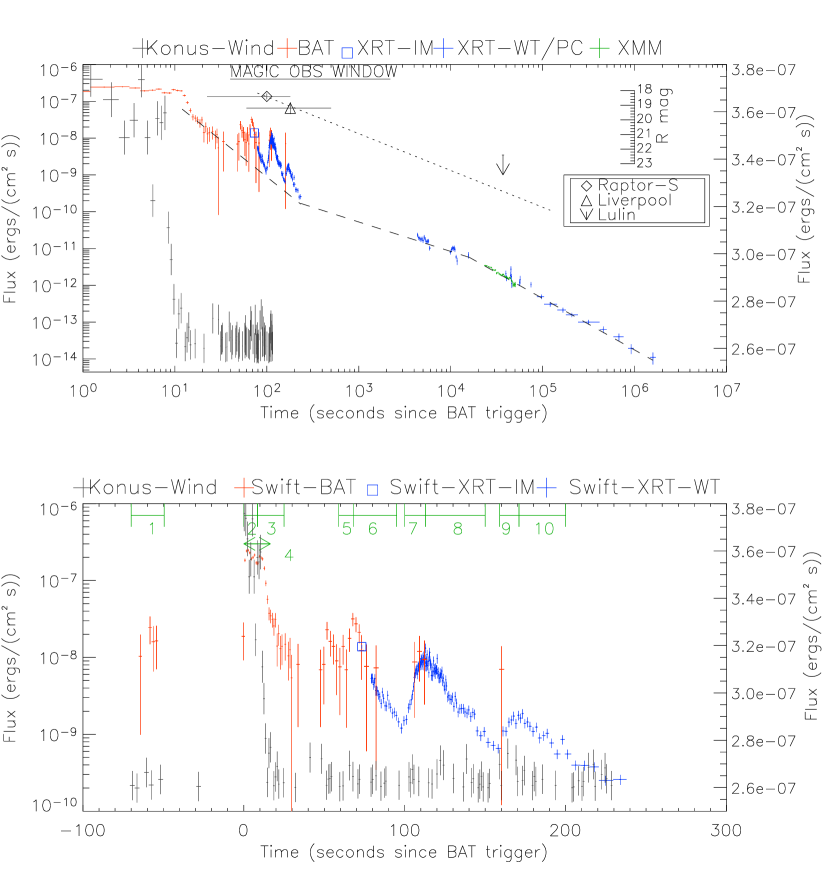
XRT collected a 0.1 s Image Mode frame upon settling on GRB 050713A 73 seconds after the BAT trigger, which yields a count rate of 314 counts s-1. Following the Image Mode frame, XRT cascaded down through its automated mode sequence and collected its first WT frame 4.5 seconds later. At the onset of the WT data, the XRT count rate was about 100 counts s-1 and decaying as a powerlaw. This initial powerlaw decay in the XRT WT data together with the Image Mode data point measured at a flux level 3 times higher just 4.6 s earlier clearly indicates that the XRT settled and began taking data during the latter portion of the flare detected in the BAT at T0+65 seconds (see Fig 4). XRT remained in WT mode throughout the entire first orbit of data collection on GRB 050713A, also observing the flare detected by the BAT at T0+105 and a lower level flare not clearly detected by the BAT at T0+155 s.
Following a 65 minute period of occultation by the Earth, XRT began observations again at T0+4300 s, now observing in PC mode since the countrate of the source had decayed below 2 counts s-1. A small flare at T0+10 ks and the indication of another flare at T0+45 ks are seen in the late time XRT lightcurve data, superimposed on an otherwise steady powerlaw decay. XRT observations continue to monitor the source until T0+1.8 s, a total exposure time of 178 ks, at which time the source had decayed below the XRT detection threshold.
XRT data are processed using the xrtpipeline ground software version 0.9.9, the redistribution response matrices swxwt0to2_20010101v007.rmf (WT data) and swxpc0to12_20010101v007.rmf (PC data), and ancillary response files generated with the xrtpipeline task xrtmkarf.
2.3.1 XRT GRB Position Analysis
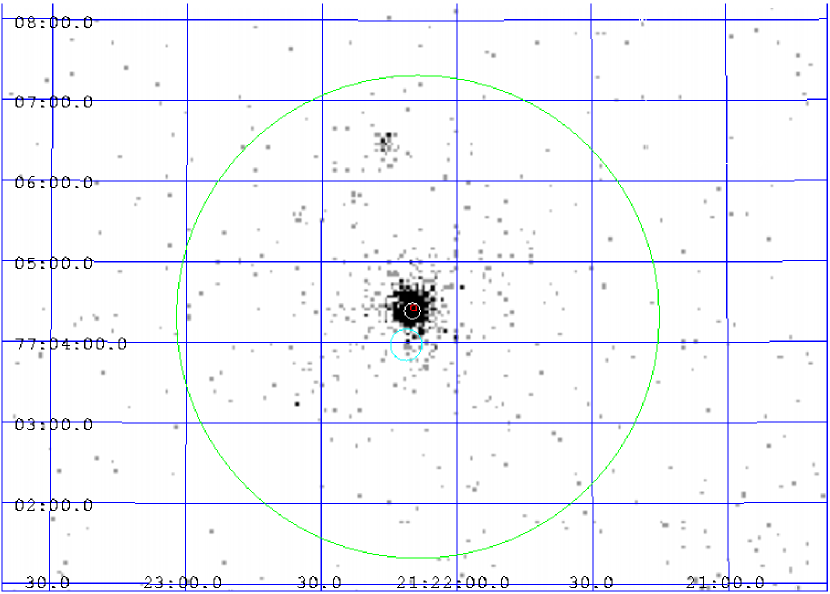
The X-ray afterglow position determined from ground processing of the data is RA(J2000) = 21h22m9 Dec(J2000) = 4290 with an uncertainty of 3.2 arcseconds. This is 10.5 arcseconds from the reported BAT position, 0.5 arcseconds from the optical counterpart reported by Malesani et al., (Malesani et al.,, 2005) and 1.5 arcseconds from the initial XRT position calculated onboard the satellite and automatically distributed via the GCN network (Falcone et al.,, 2005). An X-ray image compiled from the first segment of XRT PC data is shown as Figure 5 with the BAT, XRT and optical counterpart error circles displayed. A faint background source is detected 30 arcseconds due south of the GRB afterglow at a constant flux level of counts s-1. The contribution of this steady source has been removed from the calculation of the afterglow lightcurve.
2.3.2 XRT Temporal Analysis
A timeline of the XRT (as well as other) observations of GRB 050713A is shown in Table 1. The lightcurve will be broadly treated in two parts. The first part is the initial orbit of data, during which the lightcurve is characterized by bright flares which are simultaneously observed by the BAT as well as the K-W instrument at higher energies. Due to the extreme variability in this portion of the lightcurve, a global decay index cannot be determined from the XRT data. The second part is the remainder of the XRT data from the second orbit onward, which is characterized primarily by a broken powerlaw decay, though at least one small flare is seen superimposed atop this global decay.
First Orbit
Swift finished slewing to GRB 050713A at T0+73 s, during the flare which began at T0+65 s. The XRT short image frame is collected just after the peak of this flare, at a flux of ergs cm-2 s-1, and the first 20 frames of WT data record the decay of the flare. Fitting a simple powerlaw to this decay from T0+79 s to T0+100 s setting T0 to be the BAT burst trigger time, we find a powerlaw index of (1 ). At T0+105 s a new flare begins, which rises with a powerlaw index of for 5-10 s, flattens at the peak of ergs cm-2 s-1 for 5-10 s, then decays with a more shallow powerlaw index of for about 30 s. At T0+165 s a third flare is detected, which rises with a powerlaw slope of for 5-10 s, flattens at the peak of ergs cm-2 s-1 for 5-10 s, then decays with a slope of for 70 s before the end of the observing window due to Earth occultation.
Second Orbit and Later
The second orbit of data in the XRT is the only single orbit of data in which the afterglow is characterized by a well sampled (greater than 100 events total) lightcurve devoid of any obvious flaring activity. During the 1600 seconds of data in this orbit, from T0+4360 s to T0+5952 s, the lightcurve decays steadily as a powerlaw with decay index of about 1.0. The third orbit of data is characterized by another flare, beginning at T0+10 ks, lasting throughout the entire orbit (about 2 ks) and reaching a peak flux of ergs cm-2 s-1. A powerlaw fit to the rising portion of the flare yields a slope of while the decaying portion yields a slope of . This flare seems to be superposed atop the underlying afterglow decay of decay index . Observations were interrupted after 150 s during the fourth orbit due to the occurrence of GRB 050713B, and observations of GRB 050713A remained suspended until T0+40 ks. Some suggestion of another flare is seen in the orbit of data beginning at T0+45 ks, though the statistics are poor. While afterglow data from the XRT alone do not clearly require a break in the afterglow powerlaw, XMM-Newton data (see 2.4) from T0+21 ks to T0+50 ks provide an accurate measure of the late-time decay slope () which cannot fit the XRT data from orbits 2 and 3 without a break in the powerlaw. The joint XRT-XMM-Newton lightcurve will be further discussed in 2.4. Table 2 summarizes the flares and their temporal fits.
2.3.3 XRT Spectral Analysis
The XRT spectral analysis of this burst is somewhat complicated by the high degree of flaring activity seen. In all cases, spectra are binned to a minimum of 20 counts per bin in order to use statistics. Fitting the entire first orbit of data, the spectrum is well fit by a highly absorbed powerlaw with photon index and cm-2, which is significantly above the galactic column ( cm-2) in the direction of GRB 050713A. We are also able, due to the large number of counts in each of the early flares in the dataset, to fit a spectrum to both the rising and decaying portions of the flares. In doing so we see the typical hard to soft evolution of the flares (Zhang and Meszaros,, 2004).
The second orbit of data shows a significantly different spectrum from the first, with a harder spectrum with photon index and a lower value of , possibly indicating a period of energy injection (Nousek et al.,, 2005). The third orbit is well fit by a softer powerlaw similar to that which fit the first orbit with photon index and .
During the period of overlapping coverage between Swift and XMM-Newton , XRT has 3.5 ks of exposure time at a mean countrate of 0.04 counts s-1 for a total of about 150 events during the simultaneous observing period. Fitting a spectrum to this overlapping coverage yields a photon index and . The corresponding mean unabsorbed 0.2–10.0 keV flux during the overlap period as measured by XRT is ergs cm-2 s-1.
The data collected after the third orbit (i.e., after the temporal break in the lightcurve at T0+ ks) are too sparse to justify fitting with higher order models, but a simple absorbed powerlaw fit yields a spectrum of photon index with . This is consistent with the x-ray photon index found in orbits 1 and 3 and is marginally softer than the photon index found during orbit 2 which, as noted above, suggests a period of energy injection.
2.4 XMM-Newton
XMM-Newton follow-up observations of GRB 050713A commenced T0+23.6 ks (for the EPIC-PN) and T0+20.9 ks (for the two EPIC-MOS cameras). The XMM-Newton data were processed with the epproc and emproc pipeline scripts, using the XMM-Newton SAS analysis package, version 6.5. A bright rapidly decaying source is detected near the aimpoint of all three EPIC detectors, localized at RA(J2000)=21h22m9 Dec(J2000)=4281 . The net exposures after screening and deadtime correction are 24.1 ks (PN) and 27.0 ks (MOS). All three EPIC cameras (PN and 2 MOS) were used in Full Window Mode with the medium filter in place.
Source spectra and lightcurves for all 3 EPIC cameras were extracted from circular regions of 20 arcseconds radius centered on the afterglow. Background data were taken from a 60 arcseconds circle on the same chip as the afterglow, but free of any X-ray sources. Fitting the afterglow lightcurve with a simple power-law decay results in a decay index of . Several flares are present in the background lightcurve, so as a conservative check, we also excluded times where the background rate is counts s-1. The afterglow decay rate is then , consistent with the above value. The decay rate from the MOS lightcurve (for the two detectors combined) is also consistent at .
2.4.1 XMM-Newton Spectral Analysis
Afterglow and background spectra were extracted with the same regions used for the lightcurves, while ancillary and redistribution response files were generated with the SAS tasks arfgen and rmfgen respectively. As with XRT data, source spectra were binned to a minimum of 20 counts per bin in order to use statistics. The PN and MOS spectra were fitted jointly, allowing only the cross normalization to vary between the detectors, which is consistent within . The two MOS spectra and responses were combined to maximize the signal to noise, after first checking that they were consistent with each other. The average net source count rates obtained over the whole observation are counts s-1 for the PN and counts s-1 per MOS module.
Allowing the absorption column to vary in the spectral fit results in a formally acceptable fit (). The obtained is cm-2, while the continuum photon index . The time-averaged, unabsorbed, 0.2–10.0 keV flux obtained for the afterglow is erg cm-2 s-1. These values are consistent with the Swift XRT measurement obtained at the time of the XMM-Newton observation.
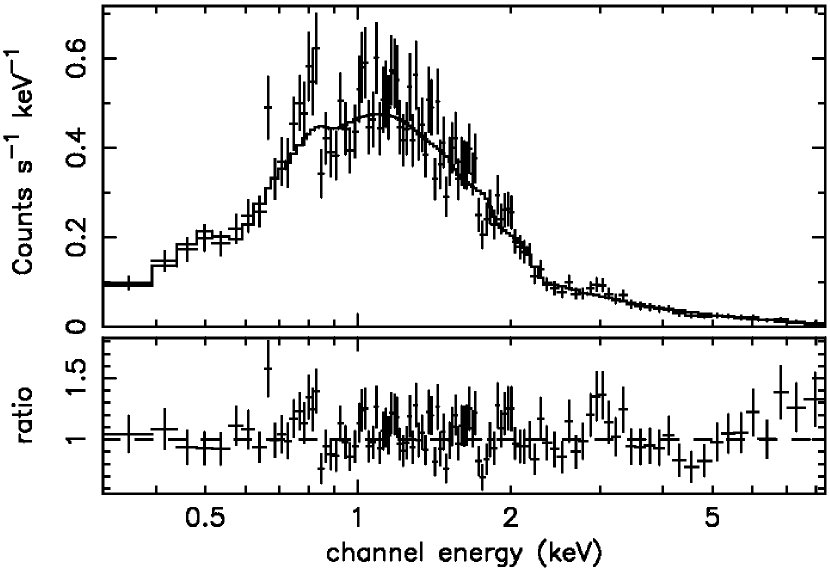
The XMM-Newton afterglow spectra were also sliced into three segments of approximately 8 ks in length, in order to search for any spectral evolution within the XMM-Newton observation. No change in the continuum parameters was found, all three spectral segments being consistent with photon index and cm-2. The spectrum obtained from the PN detector and residuals to an absorbed power-law model (with and cm-2) are shown in Figure 6.
2.4.2 Joint XMM-Newton and Swift Modeling of the Late Time Afterglow
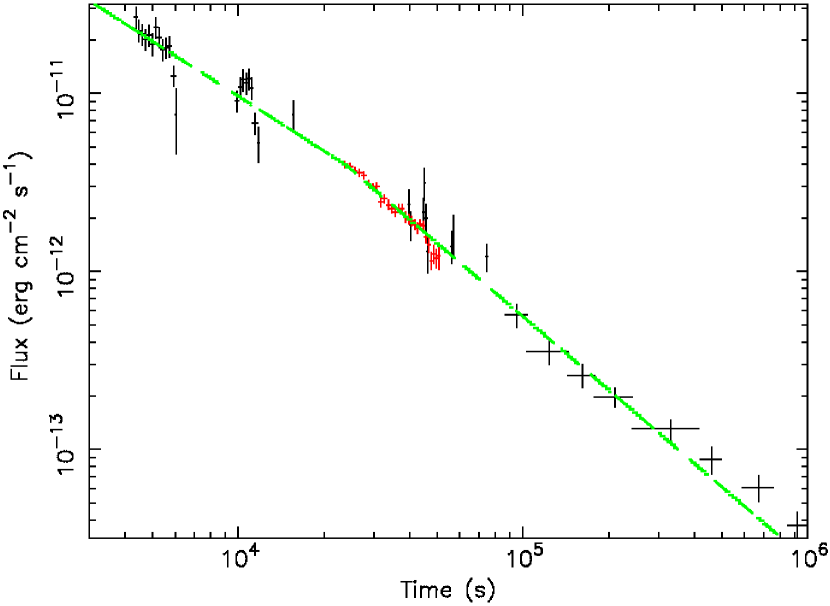
The power-law decay index obtained from the XMM-Newton observation () appears to be steeper than that obtained from the Swift XRT in orbit 2 (). In order to compare between the XMM-Newton and Swift afterglow lightcurves, a combined lightcurve from the XMM-Newton and Swift observations was produced, scaling to the absorbed continuum fluxes measured in the 0.5–10 keV band. The joint Swift and XMM-Newton lightcurve is shown in Figure 7, zoomed to better display the region at which the lightcurve break occurs.
A single power-law decay slope of is an extremely poor fit to the lightcurve in this region, with a fit statistic of . Indeed the lightcurve from T0+4 ks until T0+1000 ks can be better fitted with a broken power-law. There is a flat decay index of at early times and a steeper decay index of at later times, with the break in the decay occurring at T ks. The fit statistic is then . The remaining contribution towards the originates from two small possible flares present near T ks and T ks.
2.5 MAGIC
The MAGIC Telescope (Mirzoyan et al.,, 2005) was able to observe part of the prompt emission phase of GRB 050713A as a response to the alert provided by Swift. The observation, at energies above , started at T0+40 s, 20 s after reception of the alert. It overlapped with the prompt emission phase measured by Swift and K-W, and lasted for 37 min, until twilight. The observation window covered by MAGIC did not, however, contain the burst onset peak detected at keV-MeV energies, where the Swift and K-W spectra were taken. The same region of the sky was observed 48 hours after the burst onset, collecting an additional 49 minutes of data, which was used to determine the background contamination.
The MAGIC (Major Atmospheric Gamma Imaging Cherenkov) Telescope is currently the largest single-dish Imaging Air Cherenkov Telescope (IACT) in operation, with the lowest energy threshold ( at zenith, increasing with zenith angle). In its fast slewing mode, the telescope can be repositioned within 30 s. In case of an alert by GCN, an automated procedure takes only a few seconds to terminate any pending observation, validate the incoming signal and start slewing toward the GRB position, as was the case for GRB 050713A.
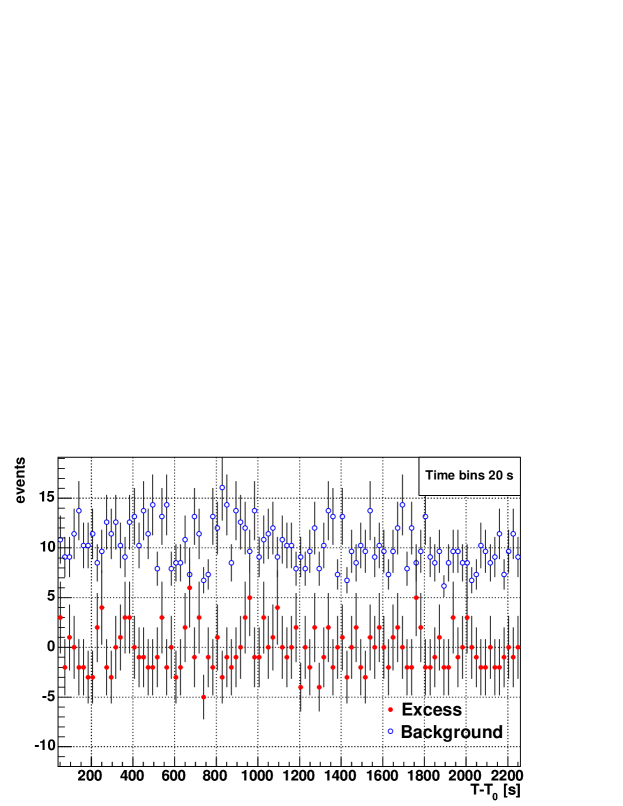
Using the standard analysis, no significant excess of -like air showers from the position of GRB 050713A above was detected (Albert et al.,, 2006). This holds both for the prompt emission and during the subsequent observation periods. Figure 8 shows the number of excess events during the first 37 minutes after the burst, in intervals of 20 s. For comparison, the number of expected background events in the signal region, stable and compatible with statistical fluctuations, is shown. Upper limits to the gamma-ray flux are given in Table 3. This is the first observation of the GRB prompt emission phase performed by an IACT.
2.6 Optical and Other Follow-up Observations
Optical followup observations of GRB 050713A performed by the UVOT and by ground based observatories are summarized in Table 4.
The earliest optical afterglow measurement comes from the RAPTOR-S robotic telescope at the Los Alamos National Laboratory in Los Alamos, New Mexico at R=18.4 0.18 in a coadded series of 8x10 second images with a midpoint observation time of T0+99.3 s (Wren et al.,, 2005). A nearly simultaneous measurement was made by the robotic Liverpool Telescope in a coadded series of 3 2 minute exposures in the r′ band with a midpoint of observation of T0+3 minutes (Malesani et al.,, 2005). Later detections below the Digitized Sky Survey limits were reported within the first 60 minutes after the burst trigger in the R band by the Nordic Optical Telescope (T0+47m), in the I band by the Galileo Italian National Telescope in the Canary Islands and in the infrared J,H, and K bands by the Astronomical Research Consortium Telescope at Apache Point Observatory (T0+53m).
Due to the bright (V=6.56) star HD204408 which is located just 68 arcseconds from the position of the burst, the UVOT background level at the position of the afterglow is significantly higher than usual, resulting in abnormally poor sensitivity of the instrument in detecting the afterglow of GRB 050713A. Considering this high background, the non-detection of the afterglow by the UVOT is not surprising.
All other reported optical observations of the afterglow position have yielded only upper limits. Most of the upper limits are near in time to the actual detections but at brighter magnitudes and thus do not produce strong constraints on the decay rate of the optical afterglow. The R-band measurement made at T0+10.3 hours by the Lulin Telescope in Taiwan, however, is at a sufficiently late epoch to place a useful constraint on the optical decay rate. Fitting a simple powerlaw to the two well defined measurements at T0+99.3 s and T0+180 s and the upper limit at T0+10.3 hours yields an upper limit on the power law decay slope of , as is shown in Figure 4.
A radio followup observation made with the VLA reports no detection at T0+4.3 days.
3 Discussion
3.1 Multispectral Lightcurve Overview
The K-W light curve in the 18–1160 keV energy range is similar to the Swift-BAT light curve (Fig 1). The small precursor peak detected by BAT at T0–70 to T0–50 s is seen by K-W at statistically significant levels in all three broad, pre-trigger bands: G1 (18–70 keV), G2 (70–300), and G3 (300–1160 keV). The other smaller peaks detected by the BAT after the burst trigger are not seen at statistically significant levels in the K-W data, despite the fact that the peaks at T0+50 s and at T0+65 s are more intense in the BAT energy range than the precursor is. The detection by K-W of the precursor but not the later flares is indicative of the harder spectral index seen in the precursor as compared to the later flares (see section 3.3 for discussion of separate spectral fits to individual flares).
The XRT lightcurve with BAT data overplotted is shown in Figure 4. Both the X-ray and gamma-ray data in the first orbit are dominated by flaring activity, making it difficult to draw a conclusion regarding the underlying powerlaw decay index from this orbit alone. The XRT data beginning at T0+4 ks (orbit 2) and extending until T0+40 ks show a significantly flatter powerlaw decay slope of , implying that a break in the powerlaw decay has occurred near the end of the first orbit of XRT coverage at T0+300 s and that a period of energy injection occurs from T0+300 s to T0+15 ks. Another break in the lightcurve then occurs near T0+25 ks to a steeper, “normal”, pre-jetbreak decay slope, as shown by the XMM-Newton data (). Support for this notion of the presence of an energy injection phase may be drawn from the harder x-ray spectral slope of the second orbit of XRT data (photon index = 1.9 0.13) compared to the first orbit (photon index = 2.28 0.04), the third orbit (photon index = 2.25 0.23), and the later data (photon index = 2.8 0.6) (Table 5). XMM-Newton data coverage nicely fills much of the data gap in the XRT coverage between T0+15 ks and T0+40 ks and provides high signal to noise data in this regime, producing a confident determination of the lightcurve break.
The global picture of the lightcurve of this burst is one in which the early data (prior to T0+12 s) shows a bright plateau in the 15 keV to 1 MeV energy range, consisting of multiple overlapping peaks. At T0+12 s the emission drops rapidly, consistent with a curvature radiation falloff (Zhang et al.,, 2005) until subsequent flaring activity begins to be seen in the 0.3–150 keV region with some indication of flux at higher energies from K-W. Due to the rapid rise and decay of the flares, internal shocks from continued central engine activity appears to be the most likely explanation for these flares (Ioka et al.,, 2005). The earliest ground based optical detections are reported at this time also, suggesting that the flares may also be optically bright. The lack of higher resolution timing information in the optical data, though, admits the possibility that the optical emission may be unassociated with the emission mechanism responsible for the x-ray flares. It is possible that the optical emission is due to synchrotron emission from the reverse shock (RS), though the much higher flux level of the x-ray flare peaks compared to the optical measurements suggests that the x-ray flares themselves are not due to inverse Compton scattering of the optical synchrotron emission of the RS (Kobayashi et al.,, 2005; Gendre et al.,, 2005).
Following this prompt emission phase, an energy injection phase begins which dominates the lightcurve until at least T0+16 ks. During the energy injection phase, continued activity of the central engine adds energy to the afterglow of the burst, either through additional ejection events or through the realization of energy contained in previously ejected outward moving relativistic shells which only collide at later times, producing late time internal shock emission which is then added to the overall decay (Zhang et al.,, 2005). It may be expected, if the energy injection phase is due to continued central engine activity, that flaring behavior would continue to be observed during this period and, indeed, some evidence for small scale flaring activity during both the second and third orbit of XRT data can be seen, though at a much reduced significance in comparison to the flaring activity of the first orbit. Near T0+25 ks, the energy injection phase ends, giving way to a steeper decay slope similar to what is often seen in GRBs after the prompt emission phase and prior to the possible onset of a traditional jet-break (Nousek et al.,, 2005).
3.2 Flares
Many flares superimposed on top of the overall decay of GRB 050713A show the typical properties seen in other bursts: that t/t 0.1 and that the peak flux level is negatively correlated with the time of the flare (Falcone et al.,, 2006; Barthelmy et al.,, 2005). These two properties of flares seen in Swift GRB afterglows have been cited as evidence for flares being produced through accretion processes onto the central compact object (Perna, Armitage and Zhang,, 2006), but we offer here that the constancy of the t/t value of flares may partly be a by-product of the overall decay of the afterglow in so much as the sensitivity of the XRT to flares is naturally degraded as the overall flux level of the afterglow decays, thus requiring flares at later times (and hence, lower flux levels) to be longer in duration for enough counts to be collected to produce a significant flare seen above the background. Such a case can be seen in comparing the early time flares in the first orbit of GRB 050713A to the flare seen in the the third orbit. During the first orbit, the underlying flux level beneath the flares is poorly determined, but can be assumed to be 10-100 counts s-1. We are dominated in this portion of the lightcurve by the Poissonian error in the flux, which in a 10 second integration will be 10-32 counts, or 3-10 . Thus, for a flare to appear at the 6 sigma level above the background during this portion of the lightcurve, at most a 60 increase in fluence above the normal powerlaw decay is needed, which can be acquired in a few seconds by the introduction of a flare with twice the flux of the underlying afterglow. During the third orbit, however, the underlying afterglow flux level has dropped to 0.1 counts s-1. During a 10 second integration at 0.1 counts s-1 the Poisson error alone is 1 count, so for a flare to be detectable at 6 sigma above background at these count levels, the total fluence must be 6 counts, implying an increase in the rate from 0.1 counts s-1 to 0.6 counts s-1 during the 10 s interval, a 6 fold increase, which has been seen only in the brighter flares. In order to be sensitive to the same 60 increase in flux level as during the first orbit, the flare which occurs at a flux level of 0.1 counts s-1 needs to have a Poission error which is 1/6 of the total counts in the observation, i.e., 36 counts must be collected, which implies an exposure time of at least 180 s if produced by the introduction of a flare with twice the flux of the underlying afterglow. In other words, because the afterglow flux level decays as t-α, the exposure time needed to acquire the same fluence level increases as tα. Thus, we see that in moving from the first orbit at T0+100 s to the third orbit at T0+10000 s, assuming a typical underlying powerlaw decay of the afterglow of 1, we have greatly decreased the temporal resolution of XRT to detect flares (from a few seconds to a few hundred seconds). This is not to imply that there is not another more physical cause for the constancy of the t/t ratio seen in flares, but rather to note that the typical GRB seen by the Swift XRT does not provide sufficient flux at times typically greater than a few ks to detect the shorter timescale flares that are so often seen during the first orbit.
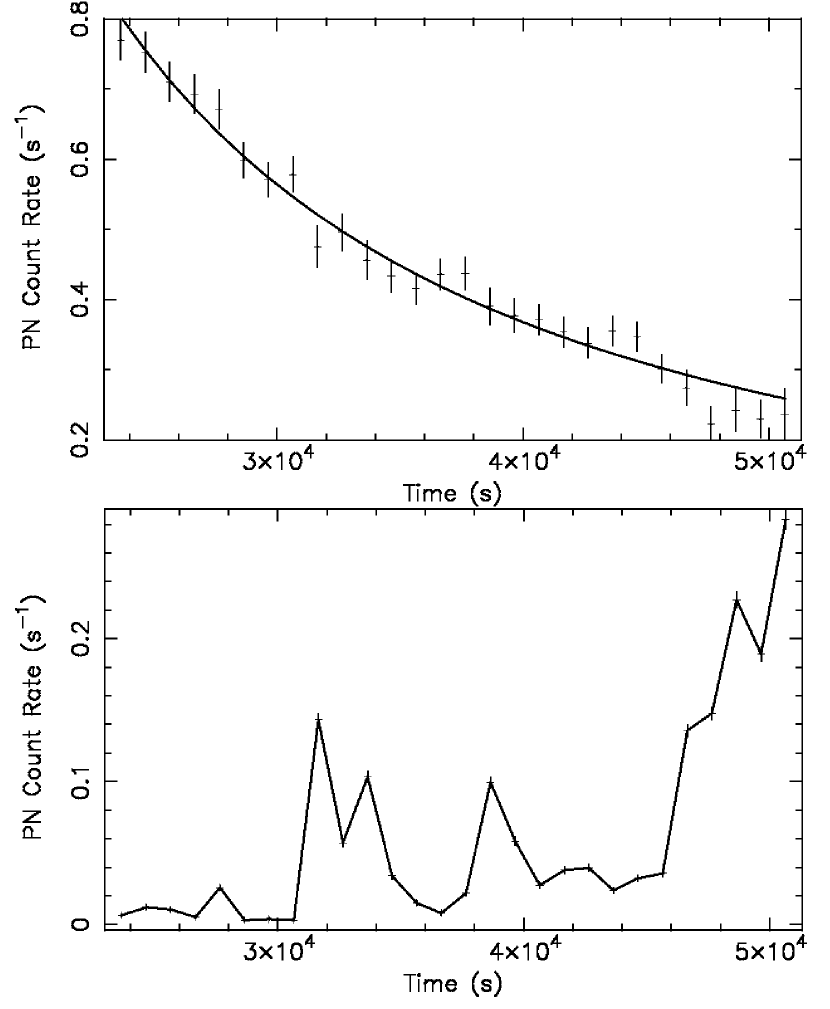
In GRB 050713A, a hint of emission above the afterglow powerlaw decay appears in the XRT data at T0+45 ks, though the statistics are, predictably, poor. This time is overlapped by XMM-Newton data, though, so we can look for evidence of a short flare in the XMM-Newton data at this time. In Figure 9 we show the XMM-Newton lightcurve, plotted linearly and zoomed near T0+45 ks. Though a 1-2 sigma deviation above the background decay is seen at T0+45 ks, the XMM-Newton data appear consistent with a statistical fluctuation rather than a true flare similar to those seen earlier during the burst.
The presence of multiple flares in GRB050713A argues against “one-shot” emission mechanisms such as synchrotron self-Compton emission in a reverse shock or deceleration of the blastwave (Piro, 2005a) and it argues in favor of a mechanism which can produce repeated flares, such as late time central engine activity. While it may remain possible that one of the several flares in GRB050713A is due to the RS or the onset of the afterglow due to external shocks, the steep temporal decays of all the temporally fitted flares coupled with the photon indices of the flares (1.25 2.5; Table 6) do not satisfy the closure relations of Sari et al., (1998), Chevalier & Li (1999) and Sari et al., (1999) for propagation of the blast wave into either a wind or constant density ISM. Together these points seem to argue in favor of an internal shock origin for the flares seen in this burst.
3.3 Joint Spectral Fitting
Due to the relatively narrow spectral response function of the BAT (15–150 keV for mask-tagged events) and the XRT (0.3–10 keV), a spectral fit to data from only one of the two high energy instruments on Swift is usually not able to discriminate between higher order spectral models. Analysts and authors are usually limited to choosing between a power-law or Band function. In GRB 050713A we have a rare case of data coverage overlap between BAT and XRT (0.3–150 keV) and also between BAT and K-W (15 keV–14 MeV). Taking advantage of this where appropriate, considering the relative flux levels in the three instruments, we have jointly fitted spectral datasets between the two pairs of instruments. During the precursor and from T0+0 to T0+16.5 s, we perform joint fitting between BAT and K-W data. From T0+16.5 to T0+78 s we have only BAT data. From T0+78 to T0+116 s and during the onset of the flare at T0+160 we perform joint fitting between XRT and BAT. We have grouped the data into segments (as shown in Table 6) in order to temporally separate data which we expect may show significantly different spectral parameters. Segments 1-4 contain BAT and K-W data and are segmented to separate the precursor from the prompt emission and the prompt emission from the rapid decay phase. Segment 5 contains BAT data only and segments 6-10 contain XRT and BAT data. These are segmented to distinguish the 3 flares which have overlapping data and also to separate the rise of each flare from the decay of each flare. We attempt fits to each of these segments using 4 different spectral models: 1) an absorbed powerlaw 2) an absorbed cutoff or broken powerlaw (cutoff for data extending beyond 150 keV, broken otherwise) 3) an absorbed Band function and 4) an absorbed blackbody plus powerlaw.
3.3.1 Segment 1: precursor (T0–65 to T0–55 s)
The precursor is the most poorly sampled of all the regions. Despite the low number of counts in the region, a cutoff powerlaw is favored over a single powerlaw at confidence according to the F-test. Of all the segments fit, the precursor has the hardest photon index, regardless of the model which is used to perform the fits.
3.3.2 Segment 2: prompt emission plateau (T0+0 to T0+8.5 s)
The plateau of the prompt emission is best fit by an exponentially cutoff powerlaw model with photon index and E keV. Next to the precursor, the prompt plateau has the second hardest photon index of all segments fit, regardless of the model used.
3.3.3 Segment 3: rapid decay (T0+8.5 to T0+25 s)
As with the other data segments which contain K-W data, the rapid decay segment is poorly fit by a simple powerlaw and is best fit by a cutoff powerlaw or Band function. The photon index of the cutoff powerlaw in segment 3 is quite similar to that in the prompt plateau, but the cutoff energy is somewhat lower (312 keV compared to 421 keV in the plateau), suggesting that the highest energy flux is “shutting off” during the rapid decay phase.
3.3.4 Segment 4: plateau + early rapid decay (T0+0 to T0+16.5 s)
This segment is an extension of the prompt segment to slightly later times, encompassing slightly more data. The cutoff powerlaw or Band function is the best fit, with photon indices similar to segment 2 and Epeak between that in segments 2 and 3.
3.3.5 Segment 5: rise of T0+60 s flare (T0+59 to T0+68 s)
This segment contains only BAT data and is included for completeness, though the narrowness of the BAT spectral response limits the ability to distinguish between models. A simple powerlaw is a good fit with photon index of 1.83. is unconstrained. The powerlaw plus blackbody model produces a good fit to this segment but only with a very minimal blackbody component, effectively reproducing the fit of the simple absorbed powerlaw. Therefore we consider the powerlaw plus blackbody model inapplicable to this segment.
3.3.6 Segment 6: decay of T0+60 s flare (T0+68 to T0+95 s)
Only in this segment, the data time ranges are mismatched between XRT and BAT (due to XRT observations beginning towards the end of the flare decay). Rather than ignore this flare or consider only the later part of the flare decay where XRT and BAT data coverage overlap, we have chosen to fit the entire BAT time range from T0+68 to T0+95 s together with the T0+79 to T0+95 s XRT data (note that the Image mode data taken at T0+73 s are highly piled up and cannot be used spectrally) for consistency with our treatment of the other flares. A simple powerlaw is a good fit to this segment, yielding cm-2 and a photon index of 2.47, significantly softer than the rise of the flare, as expected.
3.3.7 Segment 7: rise of T0+100 s flare (T0+100 to T0+113 s)
In the rise of the brightest flare seen in XRT, both an absorbed powerlaw plus blackbody model and an absorbed broken powerlaw model are significantly better fits (F-test probability ) than a simple absorbed powerlaw. The powerlaw plus blackbody indicates cm-2 and a relatively soft photon index of 2.0 with a blackbody temperature of kT keV. We note that this value of kT is below the XRT energy band and may therefore indicate a non-physical spectral solution. The absorbed broken powerlaw indicates cm-2 and photon indices of and , broken at 3.4 keV. These two models are somewhat degenerate in this dataset, with both models producing a roll over in flux at low (below 0.5 keV) and high (above 50 keV) energies.
3.3.8 Segment 8: decay of T0+100 s flare (T0+113 to T0+150 s)
The decay portion of this flare is well fit by a simple absorbed powerlaw with cm-2 and photon index of 2.68. We note, however, that both an absorbed broken powerlaw and absorbed powerlaw plus blackbody are equally good fits to the data.
3.3.9 Segment 9: rise of T0+160 s flare (T0+159 to T0+171 s)
The rise of the last flare with overlapping data is well fit by a simple absorbed powerlaw with cm-2 and photon index , however the absorbed powerlaw plus blackbody is, strictly, a better fit according to the F-test, though only at about the confidence level (F-test probability = 0.219), with cm-2, kT=200 keV and photon index of 2.43. We note that this value of kT is above the XRT-BAT energy band and may therefore indicate a non-physical spectral solution.
3.3.10 Segment 10: decay of T0+160 s flare (T0+171 to T0+200 s)
The decay of this flare is well fit by an absorbed powerlaw with cm-2 and photon index of 2.55, though as with segment 9, the absorbed powerlaw plus blackbody is also an acceptable fit with cm-2, kT=5.2 keV and photon index of 2.83. It should be noted that the BAT flux is very near the noise level in this segment and really provides only an upper limit on the spectral fitting process in the higher energy region.
3.4 Broadband SED
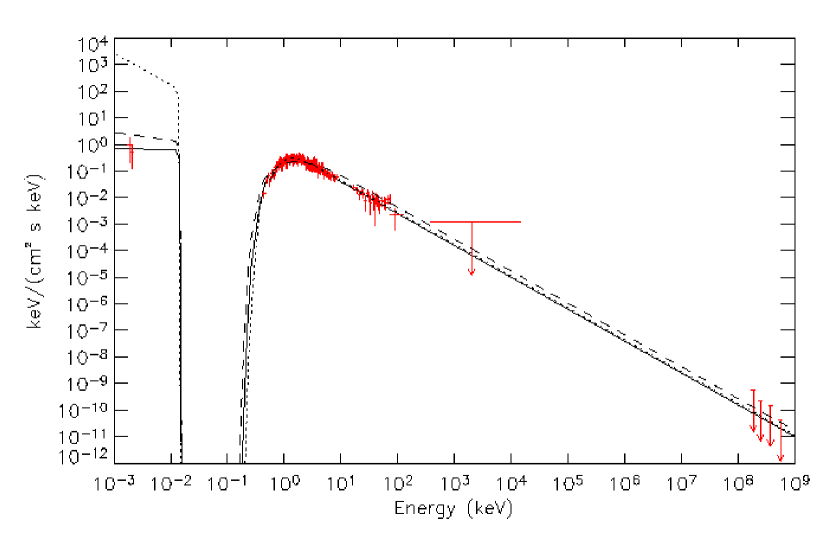
We have produced the broadband SED (spectral energy distribution) of the afterglow of GRB 050713A over the time range from T0+20 s to T0+1000 s (Fig 10). This timerange includes detections of the burst afterglow in the optical from the RAPTOR-S and Liverpool telescopes (corrected for the galactic extinction in this direction of =1.04 (Schlegel et al.,, 1998)) and in the X-ray from Swift BAT and XRT. It also includes upper limits in the gamma-ray energy range from K-W (whose detectable emission ends at T0+10 s) and in the GeV energy range from MAGIC. A similar SED has been addressed by the MAGIC collaboration in their paper regarding the MAGIC flux upper limit (Albert et al.,, 2006) in which they note that the SED composed of data from Swift and MAGIC (0.2 keV to 400GeV) is fit by a Band function at low energy and that the MAGIC data are consistent with a single unbroken powerlaw extending from Epeak (at 400 keV) to the MAGIC limits up to 500 GeV. We confirm this result, citing a best fit photon index for a single powerlaw fit from 400 keV to 500 GeV of = 2.1 0.1 and a reduced = 1.66 for 63 dof. We further note that in performing our fit to the MAGIC data, we have treated the MAGIC upper limits as data points during our fit, thus our photon index or 2.1 is only a lower limit on the true photon index of a powerlaw which would fit the true flux level at GeV energies. Our results here are, therefore, consistent with the analysis of the Albert et. al., in which they show that their data are consistent with a powerlaw photon index of 2.5 from 400 keV to 500 GeV.
We add that a Band function fit is not, however, consistent with the data when we also consider the contemporaneous optical detections. The relative faintness of the optical detections compared to the X-ray detections combined with the upper limits from K-W and MAGIC requires an absorbed broken powerlaw fit. Figure 10 shows the best fit to the entire SED using an absorbed powerlaw (dotted), absorbed broken powerlaw (solid) and absorbed Band function (dashed). The spectral parameters and fit characteristics for each of these fits are shown in Table 7. We have not corrected for the attenuation of flux above 10GeV due to photon-photon interactions with the infrared background (de Jager and Stecker, 2002; Kneiske et al.,, 2004; Primack, Bullock and Somerville, 2005), however, our spectral fit results will remain valid independent of this effect due to the constraints placed by the K-W limiting flux measurement from 20 keV to 14 MeV.
4 Summary
GRB 050713A is one of the rare bursts observed simultaneously in soft X-rays (XRT), hard X-rays (BAT) and gamma-rays (K-W). The broad spectral coverage of these simultaneous measurements has allowed us to fit the early prompt emission, rapid decay, and several flares in the early emission with several different spectral models. In general we find a cutoff powerlaw model to be a good fit to segments with data extending into the MeV range, thus able to constrain the high energy component of the model. For data segments with 0.3–150 keV coverage (BAT and XRT data) we find that a simple absorbed powerlaw is often an adequate fit to the data, though an absorbed powerlaw plus blackbody or absorbed broken powerlaw model seems to sometimes be a marginally better fit during periods of flaring activity.
The lightcurve structure of GRB 050713A is quite typical of many GRBs that have been observed by Swift . It has an early section showing steep decay slopes of and bright flares extending until T0+1 ks, followed by a break to a flatter section with decay slope lasting until T0+25 ks, followed by a break to a steeper slope of .
We have temporally separated the early, flaring portion of the burst into 10 segments and attempted to fit each segment using 4 different spectral models: 1) an absorbed powerlaw 2) an absorbed cutoff or broken powerlaw (cutoff for data extending beyond 150 keV, broken otherwise) 3) an absorbed Band function and 4) an absorbed blackbody plus powerlaw. In all segments where at least two instruments provide significant, simultaneous levels of emission, and hence the spectral data span more than 2 decades in energy, we find that at least one of the higher order spectral models is acceptable and, in several cases, is a better fit to the data than a simple absorbed powerlaw. This suggests that the spectral shape of GRB flares, while consistent with a simple absorbed powerlaw when viewed through any particular narrow spectral window, is intrinsically fit in the broadband by a model with attenuated flux above (and possibly below) some threshold energy.
It has long been known that GRB prompt emission is better fit by spectral models with a high (and sometimes low) energy cutoff than by a simple absorbed powerlaw (Ryde, 2005; Band et al.,, 1993), and thus the indication that GRB flares are fit by a similar spectral model suggests that similar emission mechanisms may be responsible for the production of flares and for the prompt emission itself, namely internal shocks produced as a result of central engine activity. Since the discovery of X-ray flares in GRBs by Swift, relatively few of the flares have been observed simultaneously across a broad enough energy range to determine whether such higher order models are necessary to fit their spectra, making the multi-instrument observations of GRB 050713A unique and valuable.
We have also examined the temporal properties of the flares seen in GRB 050713A as early as T0+80 s and as late as T0+10 ks. In all cases we find the flares to have steep powerlaw rise and decay slopes and 0.1 t/t 1, which also suggests internal rather than external shocks as the production mechanism for the flares (Burrows et al.,, 2005b; Ioka et al.,, 2005). We have noted that the presence of multiple flares and the failure of those flares to fit the closure relations associated with the external shock in a wind or constant density ISM further argues in favor of the internal shock origin for the flares.
We have furthermore discussed the difficulty that Swift XRT will face in detecting late time flaring activity. We have noted that the XRT will have difficulty resolving late, short-timescale flares due to the low XRT count rates typically involved. Data from higher throughput instruments such as XMM-Newton EPIC will be important for constraining flares at these times. GRB 050713A has simultaneous coverage at moderately late times with XMM-Newton EPIC, but no conclusive evidence of flaring in the XMM-Newton data has been found in this case.
Finally, we have created a broadband SED of the flaring region of GRB 050713A from 0.002 keV to 500GeV at times from T0+20 s to T0+1000 s. We find that the SED is inconsistent with a single absorbed powerlaw or an absorbed Band function and is best fit by an absorbed broken powerlaw. This overall SED again implies that GRB flares are best fit by a spectral model similar to that of the prompt emission itself and thus suggests a common mechanism for the emission from the prompt phase and from flares.
References
- Albert et al., (2006) Albert, J., et al., 2006, ApJ, 641, L9-L12
- Aptekar et al., (1995) Aptekar, R.L., et al., 1995, Space Sci. Rev., 71, 265
- Band et al., (1993) Band, D., et al., 1993, ApJ, 413, 231
- Barthelmy et al., (2005) Barthelmy, S., et al., 2005, Space Sci. Rev., 120, 143
- Barthelmy et al., (2005) Barthelmy, S., et al., 2005, Nature 438, 994
- Burrows et al., (2005a) Burrows, D.N., et al., 2005a, Space Sci. Rev., 120, 165
- Burrows et al., (2005b) Burrows, D.N., et al., 2005b, Science, 309, 1833
- Chevalier et al., (1999) Chevalier, R.A., and Li, Z.Y., 1999, ApJ, 520, L29
- Dickey and Lockman (1990) Dickey, J.M. and Lockman, F.J., 1990, ARA&A. 28, p215
- Falcone et al., (2005) Falcone, A.D., et al., 2005, GCN 3581
- Falcone et al., (2006) Falcone, A.D., 2006, ApJ, 641, 1010
- Gallant et al., (1999) Gallant, Y.A., et al., 1999, A&AS, 138, 549G
- Gehrels et al., (2004) Gehrels, N., et al., 2004, ApJ, 611, 1005
- Gendre et al., (2005) Gendre, B., et al., 2005, A&AS, accepted, astro-ph/0603431
- Hill et al., (2004) Hill, J.E., et al., 2004, Proc. SPIE, Vol. 5165, 217
- Hill et al., (2005) Hill, J.E., et al., 2005, ApJ, 639, 303
- Ioka et al., (2005) Ioka, K., et al., 2005, ApJ, 631, 429
- de Jager and Stecker (2002) de Jager, O.C. and Stecker, F.W. 2002, ApJ, 566, 738
- Kneiske et al., (2004) Kneiske, T. M., et al., 2004, A&AS, 413, 807
- Kobayashi et al., (2005) Kobayashi,, S., et al., 2005, astro-ph/0506157
- Kraft et al., (1991) Kraft, R.P., Burrows, D.N., Nousek, J.A., 1991, ApJ, 344, 355
- Kouveliotou et al., (1993) Kouveliotou, C., et al., 1993, ApJ, 413:L101, L104
- Malesani et al., (2005) Malesani, D., et al., 2005, GCN 3582
- Mirzoyan et al., (2005) Mirzoyan, R. et al., 2005, IP Procs 29th ICRC
- Nousek et al., (2005) Nousek, J.A., et al., 2005, ApJ, 642, 389
- Palmer et al., (2005) Palmer, D.M., et al., 2005, GCN 3597
- Perna, Armitage and Zhang, (2006) Perna, R., Armitage, P.J., Zhang, B., 2006, ApJ, 636, 29
- Piro (2005a) Piro, L., 2005, ApJ, 623, 314
- Piro (2005b) Piro, L., 2005, astro-ph/0506020
- Primack, Bullock and Somerville (2005) Primack, J.R., Bullock, J.S., Somerville, R.S. 2005, AIP Conf. Proceedings # 745, p23
- Romano et al., (2005) Romano, P., et al., 2006, A&AS, 450, 59
- Roming et al., (2005) Roming, P., et al., 2005, Space Sci. Rev., 120, 95
- Ryde (2005) Ryde, F., 2005, ApJ, 625, 95
- Sari et al., (1998) Sari, R., et al., 1998, ApJ, 497, L17
- Sari and Piran (1999) Sari, R., and Piran, T., 1999, ApJ, 520, 641
- Schlegel et al., (1998) Schlegel, D.J., Finkbeiner, D.P., and Davies, M., 1998, ApJ, 500, 525
- Wren et al., (2005) Wren, J., et al., 2005, GCN 3604
- Zhang and Meszaros, (2004) Zhang, B. and Meszaros, P., 2004, IJoMP A, v19, 15, 2385
- Zhang et al., (2005) Zhang, B., et al., 2006, ApJ, 642, 354
| Observatory | Start Time | Stop Time | Live-time | Time Since BAT |
|---|---|---|---|---|
| /Instrument | (UT) | (UT) | (Seconds) | Trigger (Seconds) |
| Swift-BAT | 05-07-13-04:29:02.4 | 05-07-13-04:32:00 | 178 | 0 |
| Konus-Wind | 05-07-13-04:29:03.1**The Konus-Wind trigger time corrected for the propagation time from Wind to Swift | 05-07-13-04:37:14.8 | 491.8 | 0.7 |
| MAGIC(limit) | 05-07-13-04:29:42 | 05-07-13-05:06:45 | 2223 | 40 |
| Swift-XRT | 05-07-13-04:30:14 | 05-08-01-04:37:02 | 167740 | 72 |
| XMM-Newton | 05-07-13-10:17:00 | 05-07-13-18:22:00 | 20900 | 21000 |
| Start Time | Stop Time | Duration | Rise Index aaIndex of a powerlaw fit to the rise of the flare with T0=BAT trigger time; t-T | Decay Index bbfootnotemark: | Peak Flux |
|---|---|---|---|---|---|
| (s) | (s) | (s) | (unitless) | (unitless) | (ergs cm-2 s-1) |
| 79 | 101 | 22 | NA | 5.6 1.8 | (from BAT) |
| 101 | 161 | 60 | 23.3 5 | 8.4 1.8 | |
| 161 | 304 | 143 | 8.9 3 | 6.1 1.2 | |
| 9751 | 11840 | 2089 | 5.76 1.8 | 11.0 2.4 |
| Energy | Excess evts. | Eff. Area | Flux lim | Flux lim |
|---|---|---|---|---|
| (GeV) | (uplim) | (cm2) | (cm-2 keV-1s-1) | (C.U.) |
| 1.7 | 7.6 | |||
| 10.4 | 3.4 | 4.8 | ||
| 5.3 | 3.8 | |||
| 6.5 | 3.3 |
| Observatory | Time | Band | Magnitude/Limit |
|---|---|---|---|
| McDonald Obs, Tex | T0+22.4 s | unfilt | 17.7 (lim) |
| RAPTOR-S, LANL | T0+99.3 s | R | 18.4 0.18 |
| Liverpool Robotic Telescope, Canary Islands | T0+180 s | r’ | 19.2 |
| Swift | T0+252 s | V | 17.98 |
| Swift | T0+309 s | U | 17.81 |
| Swift | T0+311 s | UVM2 | 17.13 |
| Swift | T0+325 s | UVW1 | 16.85 |
| Swift | T0+326 s | UVW2 | 17.08 |
| Swift | T0+351 s | B | 18.08 |
| Red Buttes Obs, Wy | T0+27m | R | 19.4 (lim) |
| Red Buttes Obs, Wy | T0+31m | I | 18.2 (lim) |
| Nordic Optical Tel | T0+47m | R | DSS limit |
| Galileo National Telescope, Canary Islands | T0+48m | I | DSS limit |
| ARC Telescope, Apache Point Obs | T0+53m | J,H,K | detected |
| Red Buttes Obs, Wy | T0+93m | R | 19.4 (lim) |
| Red Buttes Obs, Wy | T0+98m | I | 18.7 (lim) |
| Lulin Telescope, Taiwan | T0+10.3h | R | 22.4 (lim) |
| VLA, NRAO | T0+4.3d | 8.5 GHz | 96 microJan |
| Observatory | photon index | (cm-2) | comment |
|---|---|---|---|
| Swift orbit 1 | 2.28 0.04 | pre- energy injection phase | |
| Swift orbit 2 | 1.90 0.13 | energy injection phase | |
| Swift orbit 3 | 2.25 0.23 | flare during energy injection | |
| Swift after orbit 3 | 2.8 0.6 | post-break | |
| XMM-Newton | 2.1 0.05 | post-break |
| segment | 1 | 2 | 3 | 4 | 5 | 6 | 7 | 8 | 9 | 10 |
|---|---|---|---|---|---|---|---|---|---|---|
| t (s) | –70 - –49.5 | 0-8.5 | 8.5-25 | 0-16.5 | 59-68 | 68-95 | 100-113 | 113-150 | 159-171 | 171-200 |
| Instr | BAT | and | K-W | BAT | XRT | and | BAT | |||
| pl: | NA | NA | NA | NA | NA | 0.52 | 0.59 | 0.60 | 0.54 | 0.38 |
| pl:PhInd | 1.26 | 1.44 | 1.61 | 1.47 | 1.83 | 2.47 | 1.72 | 2.68 | 2.52 | 2.55 |
| pl: | 1.54 | 1.96 | 1.39 | 1.95 | 0.98 | 1.20 | 1.21 | 1.07 | 1.04 | 1.00 |
| pl:dof | 12 | 101 | 91 | 98 | 26 | 74 | 98 | 125 | 22 | 37 |
| cutoffpl:PhInd | 0.913 | 1.26 | 1.31 | 1.25 | NA | NA | NA | NA | NA | NA |
| cutoffpl:Epeak | 270 | 421 | 312 | 400 | NA | NA | NA | NA | NA | NA |
| cutoffpl: | 1.20 | 1.60 | 1.02 | 1.29 | NA | NA | NA | NA | NA | NA |
| cutoffpl:dof | 11 | 110 | 90 | 100 | NA | NA | NA | NA | NA | NA |
| bknpl: | NA | NA | NA | NA | NA | 0.58 | 0.43 | 0.45 | NA | NA |
| bknpl:PhInd1 | NA | NA | NA | NA | 0.95 | 2.69 | 1.26 | 1.93 | NA | NA |
| bknpl:Ebreak | NA | NA | NA | NA | 5.8 | 4.1 | 3.4 | 1.8 | NA | NA |
| bknpl:PhInd2 | NA | NA | NA | NA | 2.1 | 1.5 | 2.0 | 2.8 | NA | NA |
| bknpl: | NA | NA | NA | NA | 1.06 | 1.31 | 1.03 | 1.04 | NA | NA |
| bknpl:dof | NA | NA | NA | NA | 23 | 73 | 97 | 124 | 21 | 36 |
| Band: | NA | NA | NA | NA | NA | 0.33 | 0.49 | 0.54 | 0.41 | 0.33 |
| Band: | -1.13 | -1.27 | -1.27 | -1.29 | -2.01 | -1.69 | -1.46 | -2.32 | -1.98 | -2.17 |
| Band: | -1.26 | -9.36 | -2.39 | -9.29 | -9.07 | -1.88 | -9.36 | -9.32 | -9.04 | -8.78 |
| Band:Epeak | 101 | 761 | 244 | 636 | 994 | 10.6 | 30.7 | 10.6 | 10.6 | 10.6 |
| Band: | 1.85 | 1.61 | 1.03 | 1.28 | 1.06 | 2.11 | 1.11 | 1.13 | 1.26 | 1.12 |
| Band:dof | 10 | 109 | 89 | 101 | 23 | 73 | 97 | 124 | 21 | 36 |
| pl+bb: | NA | NA | NA | NA | NA | 0.59 | 1.17 | 0.63 | 0.50 | 0.44 |
| pl+bb:kT | 3.59 | 59.4 | 26.4 | 44.97 | NA | 7.1 | 0.1 | 4.4 | 200 | 5.2 |
| pl+bb:bbnorm | 0.068 | 2.74 | 0.46 | 1.47 | NA | 0.07 | 2.48 | 0.01 | 2.90 | 0.01 |
| pl+bb:PhInd | 1.00 | 1.64 | 1.76 | 1.63 | NA | 2.75 | 2.00 | 2.77 | 2.43 | 2.83 |
| pl+bb:plnorm | 0.053 | 13.97 | 7.69 | 11.65 | NA | 1.53 | 2.32 | 2.03 | 0.51 | 0.44 |
| pl+bb: | 1.15 | 1.79 | 1.03 | 1.60 | NA | 1.33 | 1.04 | 1.07 | 0.90 | 0.98 |
| pl+bb:dof | 10 | 109 | 89 | 101 | NA | 73 | 97 | 124 | 21 | 36 |
| Model:Param | Value |
|---|---|
| pl: | cm-2 |
| pl:PhInd | 2.14 |
| pl: | 10 (65 dof) |
| bknpl: | cm-2 |
| bknpl:PhInd1 | 1.1 0.1 |
| bknpl:Ebreak | 1.3 0.2 keV |
| bknpl:PhInd2 | 2.2 0.1 |
| bknpl: | 1.20 (63 dof) |
| Band: | cm-2 |
| Band: | –1.3 |
| Band: | –2.2 |
| Band:Epeak | 10.6 keV |
| Band: | 2.97 (63 dof) |

.

.

.