11email: paola, caccia, braito, rdc, tommaso, saracco@brera.mi.astro.it 22institutetext: Exploration of the Universe Division, NASA Goddard Space Flight Center, Greenbelt Road, Greenbelt, MD 20771
22email: vale@milkyway.gsfc.nasa.gov 33institutetext: Subaru Telescope, National Astronomical Observatory of Japan, 650 North A’ohoku Place, Hilo, HI 96720, USA
33email: akiyama@subaru.naoj.org 44institutetext: Instituto de Fisica de Cantabria (CSIC-UC), Avenida de los Castros, 39005 Santander, Spain
44email: carreraf, ceballos@ifca.unican.es 55institutetext: Mullard Space Science Laboratory, University College London, Holmbury St. Mary, Dorking, Surrey RH5 6NT, UK
55email: mjp@mssl.ucl.ac.uk 66institutetext: X-ray Astronomy Group, Department of Physics and Astronomy, Leicester University, Leicester LE1 7RH, UK
66email: mgw@star.le.ac.uk
An X-ray bright ERO hosting a type 2 QSO††thanks: Based on data obtained with the European Southern Observatory Very Large Telescope, Paranal, Chile, program 075.B-0229(A).
We present the XMM-Newton and the optical–VLT spectra along with the optical and the near–infrared photometric data of one of the brightest X-ray (F2-10keV10-13 erg s-1 cm-2) extremely red objects (R-K5) discovered so far. The source, XBS J0216-0435, belongs to the XMM-Newton Bright Serendipitous Survey and it has extreme X–ray–to–optical (220) and X–ray–to–near–infrared (60) flux ratios. Thanks to its brightness, the X–ray statistics are good enough for an accurate spectral analysis by which the presence of an X–ray obscured (NH1022 cm-2) QSO (L2-10keV=41045 erg s-1) is determined. A statistically significant (99%) excess around 2 keV in the observed–frame suggests the presence of an emission line. By assuming that this feature corresponds to the iron K line at 6.4 keV, a first estimate of the redshift of the source is derived (zX2). The presence of a high redshift QSO2 has been finally confirmed through dedicated VLT optical spectroscopic observations (zO=1.9850.002). This result yields to an optical validation of a new X–ray Line Emitting Object (XLEO) for which the redshift has been firstly derived from the X–ray data. XBS J0216-0435 can be considered one of the few examples of X–ray obscured QSO2 at high redshift for which a detailed X–ray and optical spectral analysis has been possible. The spectral energy distribution from radio to X–rays is also presented. Finally from the near–infrared data the luminosity and the stellar mass of the host galaxy has been estimated finding a new example of the coexistence at high–z between massive galaxies and powerful QSOs.
Key Words.:
galaxies: active - X-rays: galaxies - galaxies: individual: XBS J0216-04351 Introduction
 |
|
Extremely red objects (R-K5, EROs) with bright X–ray fluxes (F10-14 erg s-1 cm-2) and with high X–ray–to–optical and X–ray–to–NIR (near–infrared) flux ratios (F/Fopt, F/FK10) are among the best candidates to be obscured111We use here NH=1022 cm-2 and Av1.7 mag as dividing values between unabsorbed and absorbed sources in the X–ray and optical bands respectively. AGNs, i.e. the main ingredient of the X–ray Cosmic Background (Gilli et al. 2001a ; Ueda et al. ueda (2003)). Indeed, given the minimum redshift observed for extragalactic EROs with such high flux ratios (z0.6, see e.g. Akiyama et al. akiyama01 (2001); Mignoli et al. mignoli (2004); Severgnini et al. 2005a and references therein; Maiolino et al. maiolino06 (2006)) an X–ray flux 10-14 erg s-1 cm-2 corresponds to L1043 erg s-1, typical of AGN. Moreover, a factor of at least 10 higher in the F/Fopt and F/FK ratios than those observed for unobscured AGNs (F/Fopt, F/F1) can be easily justified by invoking the presence of an obscuring optically–thick medium (e.g. molecular torus) along the line of sight. In this case, while the UV and optical emission is totally or heavily suppressed by the large amount of dust, the X–ray emission is less affected by the absorbing medium producing high F/Fopt and F/FK. If the above scenario is true, it implies that the selection of EROs with such high flux ratios at bright X–ray fluxes (F10-13 erg s-1 cm-2) is an extremely efficient way to find the long sought high luminosity (L1044 erg s-1), X-ray obscured type 2 QSOs222The ”type 2” denomination refers to the optical spectral properties of the AGNs characterized only by strong and highly ionized narrow (FWHM1000 km/s) emission lines. (hereafter QSO2).
In this paper we present XMM-Newton and VLT optical spectroscopic data of a very red X–ray selected source (XBS J0216-0435) belonging to the XMM-Newton Bright Serendipitous Survey (XMM–BSS, Della Ceca et al. dellaceca05 (2005); Della Ceca et al. dellaceca04 (2004); Caccianiga et al. caccianiga (2004); Severgnini et al. severgnini03 (2003)). This source, given its bright X-ray flux and its high F/Fopt and F/FK, represents the prototype of the EROs in which a QSO2 is expected. The good X–ray statistics have made the spectral analysis possible and allowed us to give a first estimate of the redshift of the source (z2, Sect. 3). The X–ray properties found (the spectral shape, the amount of absorption and the presence of the FeK line) are typical of an obscured QSO. The presence of a high redshift QSO2 has been finally confirmed through dedicated VLT optical spectroscopic observations (Sect. 4).
Throughout this paper we assume H0=65 km s-1 Mpc-1 and =0 3, =0 7. All the magnitudes are in the Vega system.
2 An ERO with extreme F/Fopt and F/FK flux ratios
XBS J0216-0435 belongs to the XMM-BSS sample. The sample definition and selection criteria are described in Della Ceca et al. (dellaceca04 (2004)). The X–ray source discussed here is in the XMM-Newton Subaru field SXDS4333No Subaru data are available since the object is outside the Suprime-cam deep survey field. and has a count rate in the 0.5–4.5 keV band of (1.320.12)10-2 counts/s which corresponds to a F10-13 erg cm-2 s-1 (see Della Ceca et al. dellaceca04 (2004)). Contrary to the majority (90%) of the XMM-BSS sources, the optical counterpart of XBS J0216-0435 is much fainter than the POSS II limit (R21 mag).
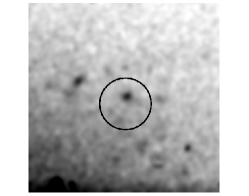
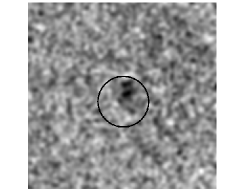
Our own R–band and K–band photometric observations have been performed on January 2005 at the ESO New Technology Telescope (NTT) using the ESO Multi-Mode Instrument (EMMI, 1 hour of exposure time) and on October 2002 at the Telescopio Nazionale Galileo (TNG) using the Near Infrared Camera Spectrometer (NICS, 15 minutes of exposure) respectively. Both the observing runs were carried out under similar seeing conditions (1.2′′). The optical and NIR images were reduced using standard iraf routines. The zero-points have been derived by measuring the instrumental magnitudes of standard stars observed just before and/or after the scientific target and assuming the average extinction reported in the Observatory web pages. Astrometric calibration was performed using the software package GAIA (version 2.6–9 by P.W. Draper) by matching sources found in the USNO catalogue (Monet et al. monet (1998)). The typical uncertainty in the best fit solution is about 1′′. A weak (R24.5 mag, see Figure 1, left panel) optical counterpart is visible within 4 arcsec from the X–ray position of the source (corresponding to the 90% confidence level X–ray error circle, see Della Ceca et al. dellaceca04 (2004)). Within the same distance from the X–ray position, two possible weak NIR objects are visible with a K’19.5 mag (see Figure 1, right panel). The two NIR sources are separated by 1′′. Even though the quality of the data is not good enough to allow a morphological analysis, all the sources appear extended. We have positionally registered the R to the K’ image by using the 8 brightest sources in the field. We find that the optical source is spatially coincident with the southern NIR source. This latter is also the NIR source closest to the X–ray centroid position (less than 1′′). Given the color of the two sources (R-K’5 for the southern source and R-K’6 for the northern one) these objects can be classified as EROs. Although the different optical–to–NIR colors of the two objects suggest that they could have different redshifts, the presence of a group of galaxies can not be ruled out. However, even in the case of a group, the X–ray emission observed is dominated by a powerful AGN (see Sect. 3) which, on the basis of VLT optical spectroscopic observations (see Sect. 4), is hosted in the southern ERO.

This source is the object with the highest F/Fopt444F has been derived from the F by assuming an observed =1.5 on the basis of the X–ray colors, see Della Ceca et al. (dellaceca04 (2004)). Fopt is the integrated flux in the Cousin R band system. More specifically: F cgs), see Fukugita et al. fukugita (1995). (220) among the XMM–BSS sources (see Fig. 6 in Della Ceca et al. dellaceca04 (2004)). Furthermore, taking into account the 2–10 keV X–ray emitting EROs collected from the literature by Brusa et al. (brusa05 (2005)), XBS J0216-0435 is one of the EROs with the highest X–ray flux among those with the highest F/Fopt (filled circle in Figure 2) and X–ray–to–NIR ratios (XBS J0216-0435 has a F/FK555For the K-band we adopted the magnitude to flux conversion used in Brusa et al. brusa05 (2005).60, see for comparison Fig. 4 of Brusa et al. brusa05 (2005)). We note that, as described in the next section, we have derived the X–ray flux from two different XMM-Newton observations separated by more than two years. The extremely high F/Fopt(FK) ratios quoted above are not likely due to an intrinsic variation of the source since the X–ray fluxes measured in the two observations are consistent within the errors.
3 XMM-Newton data
3.1 X-ray observations
XBS J0216-0435 was serendipitously observed by the EPIC cameras on 08 August 2000 (OBS ID=0112371701, 24 ksec exposure) and on 07 January 2003 (OBS ID=0112372001, 28 ksec exposure). The observations were carried out in full frame mode and with the thin filter applied. The data have been processed using the SAS (Science Analysis Software) version 5.4. The latest calibration files and response matrices released by the EPIC team have been used to create new response matrices that include also the correction for the effective area of the source position in the detector (off–axis 8 arcmin). Events files released from the standard pipeline have been filtered from high background time intervals and only events corresponding to patterns 0–12 and 0–4 have been used for the MOS and pn respectively. In the first of the two exposures, XBS J0216-0435 lies on a gap of the pn camera and only the MOS data are available. The net exposure times after data cleaning are reported in Table 1.
At the spatial resolution of XMM-Newton EPIC instruments, our source is consistent with a point–like object. This result does not discard the presence of a group of galaxies or a small cluster (core radius of order of 90 kpc, Mohr et al. mohr (1999)).
| Obs. ID | EPIC-cameras | Net exposure time |
| 011237 | [ksec] | |
| 1701 | MOS1+MOS2 | 39 |
| 2001 | pn | 22 |
| MOS1+MOS2 | 52 |
3.2 X-ray spectral analysis
The spectral analysis has been performed using XSPEC 11.2.0. The X-ray spectrum was extracted using a circular region of 28′′ of radius in all the images except for the MOS data of the second observation where a smaller aperture (21′′ of radius) has been used because of the proximity of a CCD gap. In all cases the background spectra were extracted from 4 times larger source-free circular regions close to the object. In order to improve the statistics, MOS1 and MOS2 data of each observation have been combined together and, finally, MOS and pn spectra have been binned to have at least 20 total counts per energy channel. The MOS and pn spectra of the second observation were fitted simultaneously in the 0.5–10 keV band leaving free the relative normalizations. Total net counts of 250 and 740 have been accumulated in the first and second observation respectively. In the fitting procedure, the appropriate Galactic hydrogen column density along the line of sight (2.371020 cm-2) has been taken into account (Dickey & Lockman dickey (1990)). In the rest of the paper, and unless stated otherwise, errors are given at the 90% confidence level for one interesting parameter (2=2.71).
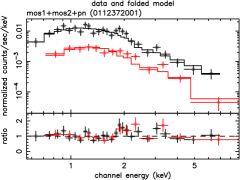
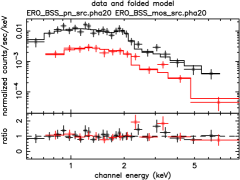
The photometric optical, NIR and X–ray properties of XBS J0216-0435 suggest that the observed X–ray emission could be due to the presence of an obscured AGN and/or a group or a small cluster of galaxies. While a pure thermal component (mekal thermal plasma model, Mewe, Gronenschild & van den Oord mew (1985), Kaastra kaa (1992), Liedahl, Osterheld & Goldstein lie (1995)) is rejected by the fit (assuming solar abundances and kT10 keV the resulting is higher than 2.5 for any z), by fitting the data with a single absorbed power–law model (typical of obscured AGN) we find a good description of the overall spectrum of the source (for both the observations we obtained a 1). The addition of a thermal component to the power-law model is not statistically required. These results make it unlikely that the X–ray emission is associated with a cluster/group of galaxies, and point towards the presence of a powerful, dominant AGN. Furthermore, as already discussed in Severgnini et al. 2005b and shown in Figure 3, by fitting the data with an absorbed power–law model, the presence of an excess around 2 keV (observed–frame) suggests line-like residuals. It is worth noting that the line–like residual has been observed only in the second observation where the statistics are better. We have verified that the equivalent width estimated for this line (see Table 2) is comparable to the upper limit measurable in the first observation. The data of the second observation have been fitted again adding a Gaussian component (=10 for d.o.f=3). Since the strongest feature expected in the X–ray spectrum of AGN is the neutral iron K line at 6.4 keV rest–frame (Reynolds et al. reynolds (1994)), we have associated the 2 keV excess with this line. This places the source at z=2.27.
The optical VLT spectrum obtained for the object visible in the R-band (Fig. 1, left panel) gives a redshift of z=1.985 (see Sect. 4). This value is in excellent agreement with the one derived from the XMM-Newton data. We report in Table 2 the best fit (rest–frame) X–ray parameters and the intrinsic X–ray luminosity obtained by fixing the redshift to 1.985. These values refer to the data of the second observation where the line is observed. Although the quality of the data from the first observation are not good enough to detect the Fe line (we don’t use them in this part of the analysis), the continuum parameters obtained from the two observations are consistent within the errors.
On the basis of the optical redshift, the rest–frame energy of the line falls to 5.8 keV. This value is consistent with the rest–frame energy of the iron K line (6.4 keV)666Two other excesses of lower statistical significance (=4) are present at 2.37 keV and 3.19 keV (7.07 keV and 9.52 keV in the rest–frame assuming a z=1.985). The first one could be associated to the ionized iron K line (7.05 keV). A detailed analysis of the line properties is not warranted by the quality of the data. Both the line broadening and the high EWFe-kα observed (see Table 2) could be due to the merging of several narrow (=0.1 keV) lines (e.g. 6.4 keV plus 6.7 keV). As reported in Table 2, the intrinsic column density measured is typical of obscured AGN (NH1022 cm-2) and the intrinsic luminosity places the source in the QSO regime (L(2-10keV)=4.11045 erg s-1).
In conclusion, the X–ray spectral analysis unambiguously reveals the presence of a dominant, high redshift and X–ray obscured QSO.
| Obs. ID | EFe-kα | EWFe-kα | F2-10keVac | L2-10keVbc | ||||
| 011237 | [keV] | [keV] | [keV] | [10-13 erg cm-2 s-1] | [1044 erg s-1] | |||
| 2001 | 2.0 | 4.7 | 5.8 | 0.7 | 0.3 | 25.11/33 | 1.1 | 41.0 |
a The flux is corrected only for the Galactic absorption.
b The luminosity is corrected for Galactic and intrinsic absorption.
c Statistical uncertainties are of about 20%.
4 Optical spectroscopic data
4.1 Observation and data reduction
The object visible in the R-band (Fig. 1, left panel) has been observed spectroscopically at ESO VLT using FORS2 during the night between the 29th and the 30th of September 2005 (from UT=04:14:12 to UT=05:14:38, including overheads). Grism 300V+20 was used with no sorting filters and a slit width of 1.6. The grism gives a spectral dispersion of 3.3 A pixel-1. The slit was rotated -20 in order to include the second object possibly observed in the K-band image. However, only one source turned out to be visible in the spectrum. Two exposures of 2790 seconds each have been taken for a total of 5580 seconds. The DIMM seeing during the observation ranges from 0.90 to 1.58 with an average value of about 1.2. The slit was not oriented along the parallactic angle, but the source was observed at a low airmass (between 1.1 and 1.25) and the slit width was large (1.6) when compared to the average seeing so that only a marginal flux loss in the blue part of the spectrum may have occurred. Therefore, no correction has been applied. For the data reduction we have used the standard IRAF long-slit package following the standard steps.
4.2 Spectral analysis
The flux-calibrated spectrum is shown in Fig 5. At least three emission lines are clearly visible in the spectrum at 4624Å, 4899Å and 5696Å. These 3 lines are identified with C IV at =1549Å (z=1.985), He II at 1640Å (z=1.987) and C III] at 1909Å (z=1.984) respectively. Two weaker additional lines are then possibly identified at 3960Å with C II at =1336Å and at 8350Å with Mg II at =2798Å. Using the 3 strongest lines we estimate a redshift of z=1.9850.002, in excellent agreement with the one derived from X–rays.
The computed widths for the three strongest lines are between 900 km s-1 (He II) and 1400-1500 km s-1 (CIV and CIII]). Considering the spectral resolution of the instrument the intrinsic width of the lines is consistent with being 1200 km s-1. This is close to the “standard” classification of type 2 AGN (FWHM1000 km s-1) while it is different from the line widths measured in “Narrow Lined QSO” (NLQSO) like those studied by Baldwin et al. (baldwin88 (1988)) (1700 - 2700 km s-1). Another strong indication of the fact that XBS J0216-0435 is a “truly” type 2 QSO and not a QSO where the broad line region produces intrinsically narrow lines, is given by the He II/CIV line ratio. As suggested by Heckman et al. (heckman95 (1995)) the He II/CIV line ratio can be used to distinguish between true type 2 objects and narrow line QSO. The former sources show a very strong He II (He II/CIV 0.6-0.9) while in the latters the HeII/CIV ratio is much lower (0.05 - 0.2). The optical spectrum of XBS J0216-0435 shows a very prominent He II line (He II/CIV 0.6) in full agreement with the values observed in type 2 AGN (type 2 QSO, Sy2 and Narrow Line radio galaxies).
We conclude that, from the optical spectral point of view, XBS J0216-0435 is a type 2 QSO hosted by an ERO at z=1.985. In particular, at the time of writing, XBS J0216-0435 is the only type 2 QSO at z2 found in the XMM–BSS survey (the identification rate is 90%). This implies that this kind of sources are quite rare at bright X–ray flux (10-13 erg s-1 cm-2).

5 Spectral Energy Distribution of XBS J0216-0435
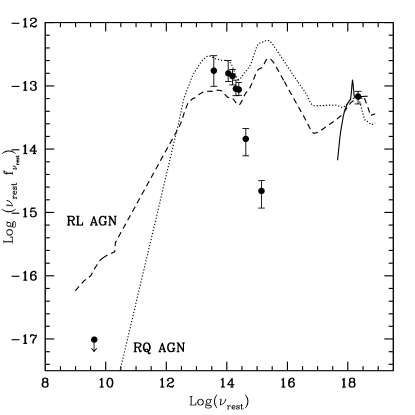
Although the blue spectral coverage of the optical spectrum allows to give only a weak constrain on the absorption in the optical band (AV), a more stringent lower limit can be derived by using the spectral energy distribution (SED) of the source. All the available photometric points for XBS J0216-0435 are shown in Fig. 6. While the X–ray, optical and NIR data have been derived from our own analysis (see Sect. 2 and 3.1), the mid-infrared (3.6, 4.5, 5.8, 8.0 and 24 m observed–frame) and the radio data (1.4 GHz observed–frame) are taken from the literature. In particular, the mid–infrared IRAC (the Spitzer Infrared Array Camera; Fazio et al. fazio04 (2004) – 3.6, 4.5, 5.8, 8 m) and MIPS (Multi-band Imager for Spitzer; Rieke et al. rieke04 (2004) – 24 m) data are part of the second SWIRE–Spitzer data released catalogue777See http://swire.ipac.caltech.edu/swire/public/newsarchive.html for the XMM-LSS fields. As for the radio data, the object is covered both by the NVSS (NRAO VLA Sky Survey, Condon et al. condon (1998)) and by the FIRST (Faint Images of the Radio Sky at Twenty-cm, Becker et al. becker (1995)) surveys. In Fig. 6 the 5 upper limit on the 1.4 GHz flux density derived from the FIRST survey, that is deeper than the NVSS, is plotted.
We compare the photometry of XBS J0216-0435 with the SED of local type 1 radio–loud (RL) and radio–quiet (RQ) QSOs adapted from Elvis et al. elvis94 (1994). The two local SEDs have been normalized to the hard X–ray data of XBS J0216-0435. As it is shown from the figure, the SED of XBS J0216-0435 is consistent with that of a RQ–QSO. The optical/NIR data are inconsistent with the the SED of type 1 QSO because the optical/NIR photometric points are strongly affected by absorption. By comparing the rest–frame optical flux value measured for XBS J0216-0435 with the corresponding value expected from a RQ unabsorbed AGN we can estimate a more stringent lower limit on the optical absorption. In particular, we find that the intrinsic dust–obscuration associated to our source is A3 mag, typical of type 2 AGN (e.g. Gilli et al. 2001b ).
The mid–infrared emission of AGNs is due to the presence of dust tori absorbing and re-radiating a significant fraction of the total luminosity of the primary source. As it is shown from Figure 6, we find that the near and mid–infrared emission of XBS J0216-0435 is consistent with that of a type 1 QSO. This implies that, if the infrared emission associated to the AGN is not contaminated by other infrared sources (i.e. starlight and/or galactic dust), we don’t find evidence of a dependence of the re-radiated infrared continuum with the orientation along the line of sight of the torus (see e.g. Pier & Krolik pier92 (1992), Granato et al. granato97 (1997), Efstathiou et al. efstathiou95 (1995), Nenkova et al. nenkova02 (2002)). In this case, the X–ray/near and mid–infrared flux ratio observed in our source is similar to those of type 1 QSO, extending to high–z similar results obtained for high and low luminosity AGN at lower redshit (Lutz et al lutz04 (2004), Sturm et al. sturm06 (2006)).
6 QSO activity and massive galaxies
The extended appearance in the optical and NIR bands along with the extremely high X–ray to optical and NIR flux ratios suggest that the host galaxy dominates the emission observed for XBS J0216-0435 at these wavelengths. Taking into account the redshift of the source (z=1.985) and given its apparent magnitude (K’19.5 mag), the resulting rest-frame (k-corrected) K-band absolute magnitude is MK–25.5 mag, i.e. 1.6 times brighter than L galaxies at the same z (see Pozzetti et al. pozzetti (2003); Saracco et al. saracco06 (2006)). Considering L*21011 L⊙ for galaxies at z2 and assuming a stellar mass–to–light ratio of 0.5 (M/L), we estimated a stellar mass of the order of 1011 for the host galaxy.
This result implies that the powerful QSO2 in XBS J0216-0435 is hosted in a massive system. This source, along with similar results recently obtained for other high–z type 2 QSO (see e.g. Akyiama akiyama05 (2005), Severgnini et al. 2005a and Maiolino et al. maiolino06 (2006)), represents a strong observational evidence of the link between high-z massive galaxies and powerful obscured AGN. The X–ray and optical spectral analysis of a bigger sample of this kind of sources will represent one of the most efficient methods to test a possible co-evolution between massive galaxy and AGN activity (Granato et al. granato04 (2004); Di Matteo et al. dimatteo05 (2005); Hopkins et al. hopkins05 (2005)) and to investigate if and how the AGN feedback can affect the galaxies evolution (see Bower et al. bower05 (2005), Stevens et al. stevens05 (2005))
7 Summary and Conclusions
We have presented here the X–ray and optical spectral analysis for one XMM-BSS ERO (XBS J0216-0435) having an extremely high X–ray to optical/NIR ratio. This object is the XMM-BSS source with the highest F/Fopt (220). The optical, NIR and X–ray photometric properties of XBS J0216-0435 suggest the presence of an X–ray obscured, optically type 2 QSO.
From the X–ray point of view, the spectral analysis confirms the presence of an obscured AGN. A statistically significant (99%) excess around 2 keV in the observed–frame suggests the presence of an emission line. By assuming that this feature corresponds to the iron K line at 6.4 keV the source is at z2 with an intrinsic luminosity of the order of 1045 erg s-1 and an intrinsic column density of 1022 cm-2, i.e. it is an X–ray obscured QSO.
Dedicated VLT spectroscopic data has allowed us to confirm the spectroscopic redshift (zo=1.985) derived from the X–ray data. The optical spectral analysis confirms that XBS J0216-0435 is an absorbed AGN. In conclusion we are dealing with a high redshift, X–ray obscured, optically type 2 QSO.
This source represents one of the few X–ray emitting EROs for which the presence of an X-ray and optical obscured QSO can be unambiguously established (see also Severgnini et al. 2005a and Maiolino et al. maiolino06 (2006) and references therein). Even more, XBS J0216-0435 can be considered one of the few examples of X–ray obscured QSO2 at high redshift for which a detailed X–ray and optical analysis has been possible and for which a SED from radio to X–rays has been published (see also Sturm et al. sturm06 (2006)).
We want to note that the physical properties derived for XBS J0216-0435 are also in excellent agreement with the relation found by Fiore et al. (fiore (2003)) for type 2 AGNs. These authors show that there is a correlation between F/Fopt and L2-10keV for optically obscured AGNs. In particular, they find that higher luminosity AGN have higher F/Fopt. Following this relation the FX/Fopt of XBS J0216-0435 is consistent with a 2-10 keV luminosity of the order of 1045 erg s-1 in good agreement with what has been found in our analysis.
From the NIR data we have estimated the luminosity and the stellar mass of the host galaxy. An example of the coexistence between powerful QSO and massive galaxy has been found. This result confirms that the selection of X–ray emitting EROs with very high X–ray–to–optical or to–NIR ratio is a very efficient method to find not only high–z QSO but also very massive galaxies and thus to study the fundamental connection between accretion and star–formation processes in the Universe.
Finally, it is worth noting that XBS J0216-0435 is an X–ray line–emitting source like those searched by Maccacaro et al. (maccacaro04 (2004)) and Braito et al. (braito (2005)) with the FLEX (Finder of Line–Emitting X–ray sources) algorithm in the XLEO (X–ray Line–Emitting Object) project. Therefore, a systematic search for XLEO is likely to increase the number of know type 2 QSOs.
Acknowledgements.
P. S. acknowledges a research fellowship from the Istituto Nazionale di Astrofisica (INAF). This work has received partial financial support from ASI (ASI/INAF n. I/023/05/0), by the Italian Ministry of Instruction, of University and of Research (MIUR) through grant Cofin-03-02-23. F. J. C. and M. T. C. acknowledge financial support from the Spanish Ministerio de Eduacion y Ciencia under project AYA2003-00812. We thank C. Vignali, F. Cocchia, N. A. Webb for a careful reading of the paper and for useful comments which have improved the paper. The TNG telescope is operated on the island of La Palma by the Centro Galileo Galilei of the INAF in the Spanish Observatorio del Roque de Los Muchachos of the Instituto de Astrofísica de Canarias. We would like to thank the staff members of the ESO and TNG Telescopes for their support during the observations .References
- (1) Akiyama, M., Ohta, K. 2001, PASJ 53, 63
- (2) Akiyama, M. 2005, ApJ 629, 72
- (3) Alexander, D.M., Vignali, C., Bauer, F.E. et al. 2002, AJ 123, 1149
- (4) Alexander, D.M., Bauer, F.E., Brandt, W. N., et al. 2003, AJ 126, 539
- (5) Baldwin, J. A., McMahon, R, Hazard, C., Williams, R. E. 1988, ApJ 327, 103
- (6) Barger, A.J., Cowie, L.L., Capak, P., et al. 2003, AJ 126, 632
- (7) Becker, R. H., White, R. L.,Helfand, D. J. 1995, ApJ, 450, 559
- (8) Bower, R.G., Benson, A.J., Malbon, R., et al. 2005, MNRAS submitted [astro-ph/0511338]
- (9) Braito, V., Maccacaro, T., Caccianiga, A., Severgnini, P., Della Ceca, R. 2005, ApJ Letters, 621, 97
- (10) Brusa, M., Comastri, A., Daddi, E., et al. 2005, A&A 432, 69
- (11) Caccianiga, A., Severgnini, P., Braito, V., et al. 2004 A&A 416, 910
- (12) Condon, J. J., Cotton, W. D., Greisen, E. W., et al. 1998, AJ, 115, 1693
- (13) Della Ceca, R., Maccacaro, T., Caccianiga, A., et al. 2004, A&A 428, 383
- (14) Della Ceca, R., Caccianiga, A., Severgnini, P., et al. 2005 Proc. of ”The X-ray Universe 2005”, San Lorenzo de El Escorial (Spain) organized by the European Space Astronomy Centre (ESAC) of ESA
- (15) Dickey, J. M., Lockman, F. J. 1990, ARA&A, 28, 215
- (16) Di Matteo, T., Springel, V., Hernquist, L. 2005, Nature, 433, 604
- (17) Efstathiou, A., Rowan-Robinson, M. 1995, MNRAS, 273, 649,
- (18) Elvis, M., Wilkes, B. J., McDowell, J. C., et al. 1994, ApJS, 95, 1
- (19) Fazio, G. G., Hora, J. L., Allen, L. E., et al. 2004, ApJS, 154, 10
- (20) Fiore, F., Brusa, M., Cocchia, F., et al. 2003, A&A 409, 79
- (21) Fukugita, M., Shimasaku, K., Icikawa, T. 1995, PASP 107, 945
- (22) Gandhi, P., Crawford, C.S., Fabian, A.C., & Johnstone, R.M. 2004, MNRAS, 348, 529
- (23) Gilli, R., Salvati, M., Hasinger, G., et al. 2001a, A&A, 366, 407
- (24) Gilli, R., Risaliti, G., Severgnini, P., et al. 2001b, ASPC, 234, 459
- (25) Granato, G. L., Danese, L., Franceschini, A. 1997, ApJ, 486, 147
- (26) Granato, G.L., De Zotti, G., Silva,,L., Bressan, A, Danese, L. 2004, ApJ 600, 580
- (27) Heckman, T, Krolik, J., Meurer, G., et al. 1995, ApJ 452, 549
- (28) Hopkins, P.F., Hernquist, L., Cox, T.J., et al. 2005, ApJS in press [astro-ph/0506398]
- (29) Kaastra J. S. 1992, An X-Ray Spectral Code for Optically Thin Plasmas. Internal SRON-Leiden Report, updated version 2.0
- (30) Liedahl D. A., Osterheld A. L., Goldstein W. H. 1995, ApJ Letter, 438, 115
- (31) Lutz, D., Maiolino, R., Spoon, H. W. W., Moorwood, A. F. M. 2004, A&A, 418, 465
- (32) Maccacaro, T., Gioia, I. M., Wolter, A., Zamorani, G., Stocke, J.T. 1988, ApJ 326, 680
- (33) Maccacaro, T., Braito, V., Della Ceca, R., Severgnini, P., Caccianiga, A. 2004, ApJ Letters, 617, 33
- (34) Maiolino, R., Mignoli, M., Pozzetti, L. et al. 2006, A&A 445, 457
- (35) Mainieri, V., Bergeron, J., Hasinger, G., et al. 2002, A&A 393, 425
- (36) Mewe, R., Gronenschild, E. H. B. M., van den Oord, G. H. J. 1985, A&AS 62, 19
- (37) Mignoli, M., Pozzetti, L., Comastri, A., et al. 2004, A&A 418, 827
- (38) Mohr, J.J., Mathiesen, B., Evrard, A.E. 1999, ApJ, 517, 627.
- (39) Monet, D., Bird, A., Canzian, B., et al. 1998, The PMM USNO A2.0 Catalog (Washington DC: US Naval Observatory)
- (40) Nenkova, M., Ivezic, Z., Elitzur, M. 2002, ApJ, 570, L9
- (41) Pier, E.A., Krolik, J.H. 1992, ApJ, 401, 99
- (42) Pozzetti, L., Cimatti, A., Zamorani, G., et al. 2003, A&A 402, 837
- (43) Reynolds, C.S., Fabian, A.,C., Makishima, K., Fukazawa, Y., Tamura, T. 1994, MNRAS 268, L55.
- (44) Rieke, G. H., Young, E. T., Engelbracht, C. W., et al. 2004, ApJS, 154, 25
- (45) Roche, N.D., Dunlop, J., Almaini, O. 2003, MNRAS 346, 803
- (46) Saracco, P., Fiano, A., Chincarini, G., et al. 2006, MNRAS in press [astro-ph/0512147]
- (47) Severgnini, P., Caccianiga, A., Braito, V., et al. 2003, A&A 406, 483
- (48) Severgnini, P., Della Ceca, R., Braito, V., et al., 2005a, A&A 431, 87
- (49) Severgnini, P., Braito, V., Caccianiga, A., et al. 2005b, Proc. of ”The X-ray Universe 2005”, San Lorenzo de El Escorial (Spain) organized by the European Space Astronomy Centre (ESAC) of ESA
- (50) Stevens J.A., Page M.J., Ivison R.J., et al. 2005, MNRAS, 360, 610
- (51) Sturm, E., Hasinger, G., Lehmann, I., et al. 2006, ApJ in press
- (52) Szokoly, G.P., Bergeron, J., Hasinger, G., et al. 2004, ApJSS 155, 271
- (53) Stevens, J.A., Page M.J., Ivison R.J., et al. 2003 MNRAS 342, 249
- (54) Ueda, Y., Akiyama, M., Ohta, K., Miyaji, T. 2003, ApJ, 598, 886
- (55) Willott, C.J., Simpson, C., Alamini, O., et al. 2003, MNRAS 339, 397